Effects of UV-dechloramination of swimming pool water on the formation of disinfection by-products: A lab-scale study.
Texte intégral
Figure
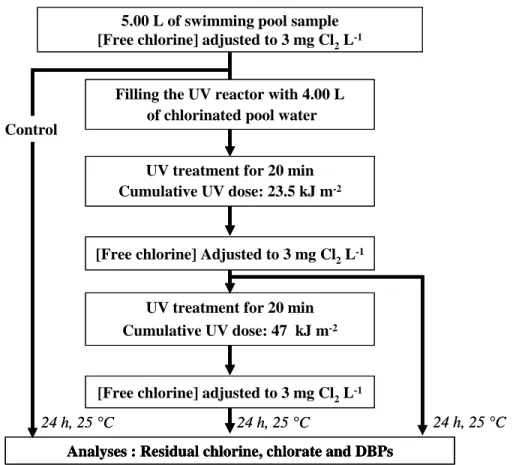
![Fig. 3 - Effects of ―UV + Cl 2 ‖ pre-treatment ([Cl 2 ] 0 = 3 mg L -1 ; Irradiance = 19.5 W m -2 ) on the chlorine demand of a pool water during post-chlorination (Fig](https://thumb-eu.123doks.com/thumbv2/123doknet/14773962.592707/33.918.278.643.139.771/fig-effects-treatment-irradiance-chlorine-demand-water-chlorination.webp)
Documents relatifs
Lucie Tsamba, Olivier Correc, Pierre Le Cloirec, Nicolas Cimetiere. Analysis of chlorination by- products in swimming pool water by membrane introduction mass spectrometry -
Les folies. Ce mot traversa la tête de la Marguerite qui se rappela soudain avoir surpris Héli dans une chambre où il n'avait rien à y faire. elle se rappela ce moment et, si
These two trends of converter technology, higher switching frequency and lower output voltage, make an even more promising perspective of efficiency improvement by
A surgical port was developed for intracardial access of surgical instruments used in minimally invasive beating heart intracardial surgery. Several methods for
a la surface entraˆıne du mouvement dans le syst` eme. On peut s’interroger sur l’efficacit´ e de ce brassage. Quel rˆ ole a-t-il dans la transformation du m´ elange ? Est-ce
Si le foyer est initialement éligible au RSA activité seul mais que le montant de ses revenus d’activité est proche du montant forfaitaire, alors la perte de revenu disponible suite
Mais pour étudier des phénomènes d’accumulation et de transport de charges électriques irradiés avec un faisceau d’électrons, la nouvelle configuration PEA sans
However, in order to obtain a model that could easily be used for different cements without any refitting to avoid new characterization tests, in our approach the kinetics of water
