HAL Id: hal-00298306
https://hal.archives-ouvertes.fr/hal-00298306
Submitted on 31 Jul 2007
HAL is a multi-disciplinary open access
archive for the deposit and dissemination of
sci-entific research documents, whether they are
pub-lished or not. The documents may come from
teaching and research institutions in France or
abroad, or from public or private research centers.
L’archive ouverte pluridisciplinaire HAL, est
destinée au dépôt et à la diffusion de documents
scientifiques de niveau recherche, publiés ou non,
émanant des établissements d’enseignement et de
recherche français ou étrangers, des laboratoires
publics ou privés.
Portuguese borehole climate observatories
J. Safanda, D. Rajver, A. Correia, P. D?de?ek
To cite this version:
J. Safanda, D. Rajver, A. Correia, P. D?de?ek. Repeated temperature logs from Czech, Slovenian and
Portuguese borehole climate observatories. Climate of the Past, European Geosciences Union (EGU),
2007, 3 (3), pp.453-462. �hal-00298306�
Clim. Past, 3, 453–462, 2007 www.clim-past.net/3/453/2007/
© Author(s) 2007. This work is licensed under a Creative Commons License.
Climate
of the Past
Repeated temperature logs from Czech, Slovenian and Portuguese
borehole climate observatories
J. ˇSafanda1, D. Rajver2, A. Correia3, and P. Dˇedeˇcek1
1Geophysical Institute Prague, Boˇcn´ı II/1401, 141 31 Praha, Czech Republic 2Geological Survey of Slovenia, Dimiˇceva 14, Ljubljana, Slovenia
3Department of Physics, University of Evora, 7000 Evora, Portugal
Received: 5 March 2007 – Published in Clim. Past Discuss.: 20 March 2007 Revised: 2 July 2007 – Accepted: 24 July 2007 – Published: 31 July 2007
Abstract. Two borehole climate observatories were es-tablished in Slovenia and Portugal within a joint Czech-Slovenian-Portuguese project in the years 2003-2005. To-gether with the older Czech observatory, which has been operating since the year 1994, they monitor air, soil and bedrock temperatures with the aim of studying air-ground coupling and the downward propagation of the surface tem-perature changes. We report here on repeated temtem-perature logs carried out within 6 boreholes at the sites of the obser-vatories and their surroundings within a time span of 8–20 years (1985–2005). The repeated logs revealed subsurface warming in all the boreholes amounting to 0.2–0.6◦C be-low 20 m depth. The compatibility of the observed temporal changes of subsurface temperature with surface air temper-ature (SAT) series measured in Prague (since 1771), Ljubl-jana (since 1851) and Lisbon (since 1856) was checked by comparing repeated temperature logs with synthetic profiles that were calculated using SAT series as forcing functions. The depth of the Czech borehole (140 m) and the Portuguese borehole (180 m) was sufficient for a reconstruction of the ground surface temperature (GST) history of the last 150– 200 years. Reconstructed GSTs were compared with the SAT series measured in Prague and Lisbon, respectively. The re-constructed histories reproduce reasonably well the ampli-tude of the recent warming inferred from the meteorological data, 1–1.5◦C above the long-term mean. The depth (100 m) of the four repeatedly logged Slovenian boreholes was too shallow for inversion, but a climatic reconstruction was car-ried out for a deeper borehole, logged in 2006 and located within 5 km from the Slovenian observatory. The obtained GST history was compared with SAT series from Ljubljana.
Correspondence to: J. ˇSafanda ([email protected])
1 Introduction
Reconstructing ground surface temperature (GST) histories from present-day measurements of temperature-depth pro-files in boreholes has been established as one of the inde-pendent and physically justified ways to obtain information about the past climate on the scale of hundreds to thousands of years (Shen and Beck, 1991; Huang et al., 2000; Harris and Chapman, 2001; Pollack and Smerdon, 2004; Majorow-icz et al., 2004). Climatic interpretation of GST histories in terms of surface air temperature (SAT) histories is based on the assumption that GST variations track SAT variations on decadal to centennial and longer time scales. To test the validity of this assumption, empirical studies at site-specific locations are necessary. Such efforts monitor air, ground and possibly bedrock temperature time series combined with other meteorological variables observed either at the location or at a near-by meteorological station over multiyear time in-tervals (Bartlett et al., 2006, Smerdon et al., 2004, 2006). Such observatories are sometimes referred to as geothermal climate change observatories (Putnam and Chapman, 1996) or borehole climate observatories (this paper).
In the Czech Republic, a borehole climate observatory has been monitoring air, soil and bedrock temperatures to a depth of 38 m since the year 1994 (Smerdon et al., 2004, 2006). Similar observatories have been established within a joint Czech-Slovenian-Portuguese project in Slovenia (in the year 2003) and Portugal (2005). Similar to the Czech station, the two observatories also monitor the bedrock temperature to a depth of 40 m in their respective boreholes, which are 180 m (Portugal) and 100 m (Slovenia) deep and have been repeat-edly logged.
This paper focuses on the ground – air temperature track-ing by compartrack-ing differences observed in repeated tem-perature logs of the three above mentioned boreholes plus 3 other Slovenian boreholes, and by simulating changes in the temperature profiles using SAT series from nearby
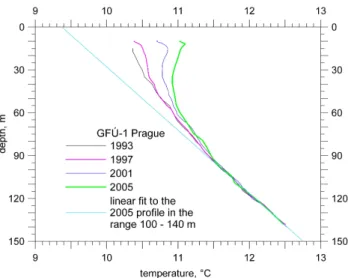
Fig. 1. Repeated temperature logs of borehole GF ´U-1 Prague at the site of the Czech borehole climate observatory in Prague done in the period 1993–2005.
meteorological stations. This method is not a substitute for direct temperature monitoring at borehole climate observa-tories, but can provide data on the ground-air coupling and downward propagation of the surface temperature changes over larger areas and greater depth and time intervals. Addi-tionally, one of the important features of repeated log differ-ences is the elimination of steady-state sources of curvature (Chapman and Harris, 1993; Majorowicz et al., 2006).
2 Data
2.1 Borehole climate observatories
The Czech observatory is located in a park within the campus of the Geophysical Institute in Prague (50◦02.5′N, 14◦28.7′E, 275 m a.s.l.) on a flat elevation in an undulated landscape with elevation variations of tens of metres. It con-sists of two boreholes, less than 2 m apart, drilled in October 1992 to 40 m and 150 m specifically for long-term borehole climate studies ( ˇCerm´ak et al., 2000). The deeper well, re-ferred to as GFU-1 Prague, has a diameter of 152 mm and was equipped by a 50 mm casing to minimize water con-vection and to facilitate repeated temperature logging ( ˇStulc, 1995) that has been done in 1 to 4 year intervals since 1993. Figure 1 shows the logs done in an equidistant time inter-val of 4 years in the period 1993–2005. The shallower well was equipped with a series of thermistors from 1 m depth down to 38.3 m and is used for monitoring the tempera-ture continuously. The area represents the tectonically most stable part of the Bohemian Massif, which belongs to the Variscan Branch of the Hercynian system. The deeper well, completely cored, penetrated consolidated sediments of Or-dovician age, mostly micaceous, silty to clayey shales. The
layer inclination varied between 0◦–90 as a result of folding.
Thermal conductivity, both along the bedding and perpen-dicular to it was measured on 124 core samples ( ˇSafanda, 1994). The mean conductivity values, 3.2 W m−1K−1along the bedding and 2.2 W m−1K−1 perpendicular to it, indi-cate a strong anisotropy factor of 1.45. No reliable dif-fusivity measurements were carried out, but for a typical density of 2.6–2.7×10³kg m−3 and specific heat of 0.8– 0.9 kJ kg−1K−1 ( ˇCerm´ak and Rybach, 1982), its value can be estimated at 1.3–1.5×10⁻⁶m2s−1along the bedding and 0.9–1.0×10⁻⁶m2s−1 perpendicular to it. Effective verti-cal values of conductivity and diffusivity corresponding to the mean bedding inclination of 50◦ from a horizontal are 2.8 W m−1K−1and 1.1–1.3×10⁻⁶m2s−1, respectively.
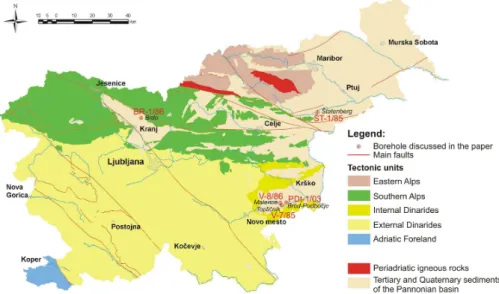
The Slovenian observatory is at Malence near Kostanje-vica in the Krˇsko basin (Fig. 2), which is filled with Ter-tiary and Quaternary sediments of the Pannonian basin. The Krˇsko basin is part of the Internal Dinarides. The observa-tory was established in November 2003 in borehole V-8/86 Malence (45◦52.1′N, 15◦24.5′E, 152 m a.s.l.) and is located on the alluvial plain of the Krka river in a rural area on a rim of the meadow. It was drilled in October 1986 with a diameter of 90–120 mm through 16 m of Quaternary clay, sand and gravel, and down to the bottom at 100 m through Miocene marl which is probably more silty or sandy in its upper part. The borehole was cased with plastic tube 4 cm in diameter. Thermal conductivity was measured on sam-ples taken in two different depths, 1.7 W m−1K−1in 0.7 m and 1.45 W m−1K−1in 99 m. Thermal diffusivity estimates based on typical density and specific heat values yields a range of 0.6–0.8×10⁻⁶m2s−1. The diffusivity can be even lower due to a high specific heat of the pore water, e.g. for 30% porosity it could be as low as 0.4×10⁻⁶m2s−1. The borehole was logged in 1987, one year after the drilling, and then in 2003 when a string of platinum sensors for per-manent temperature monitoring was installed from 1–40 m depth (Fig. 3a).
The Portuguese observatory is located at Caravelinha about 5 km northwest of the town of Evora, in southern Por-tugal. A string of platinum sensors has been monitoring tem-perature in the uppermost 40 m of the 200 m deep borehole TGQC-1 Caravelinha (38◦ 36.0′N,7◦ 54.6′W, 330 m a.s.l.) since May 2005. The borehole was drilled for water supply, but it turned out to be non-productive, with negligible inflow during pumping tests. It was cased with a plastic tube of 6.3 cm diameter, which was grouted at the bottom and filled with water. The borehole is located in an old cork tree for-est, the typical vegetation of the region. The vegetation has not changed in the last hundred years and probably more. The topography is subdued, with elevation variations of tens of metres in the nearest few kilometres. The outcropping rock type is Hercynian porphyric granite. Its thermophysical properties were measured on 4 samples collected in a quarry about 1.5 km east of the borehole and located in the same granite body. The mean conductivity and diffusivity values
J. ˇSafanda et al.: Repeated temperature logs from Czechia, Slovenia, Portugal 455
Fig. 2. Location map of the Slovenian boreholes and the Ljubljana meteorological station.
are 2.8 W m−1K−1and 1.3×10⁻⁶m2s−1, respectively. The first temperature log was carried out in 1997, several months after drilling and 2 months after casing installation. The logs were repeated from 2000 to 2005 (Fig. 4).
2.2 Additional subsurface temperature data
Another three boreholes were repeatedly logged in Slovenia, with no evidence of non-climatic influence on the subsurface temperatures. They belong to the same category as borehole V-8/86 Malence, about 100 m deep and 90–120 mm in diam-eter.
The borehole V-7/85 Topliˇcnik near Kostanjevica (Fig. 2), 100 m deep, is located in the alluvial plain of the Krka river in the same geological setting as the Malence station, and 1.7 km SE from it. It was drilled in 1985 through 9 m of Qua-ternary sand and gravel, and through Upper Miocene marl to the bottom. Conductivity was measured on two samples of marl from 52 m and 100 m depth, the results of which were 1.55 W m−1K−1 and 1.23 W m−1K−1, respectively. The borehole was logged in January 1986, several months after the drilling, and then in 2005 (Fig. 3b).
The borehole ˇST-1/85 ˇStatenberg (Fig. 2), 100 m deep, is situated in a slightly hilly area at the south-western border of the Pannonian basin, about 55 km NNE from the Malence borehole climate observatory. It was drilled in June 1985, through the upper 4 m of Quaternary sand, silt and gravel, then down to 60 m depth through marl and to the bottom through siltstone of Upper and Middle Miocene, respectively. Conductivity of 2.01 W m−1K−1 was determined on a silt-stone sample from the depth of 98 m. The borehole was logged in November 1985, 5 months after the drilling, and then in 2005 (Fig. 3c).
Borehole BR-1/86 Brdo near Kranj (Fig. 2), 98 m deep,
is located in a flat area within the Ljubljana basin, which is filled with sediments of the Pannonian basin within the Southern Alps. It is about 90 km NW from Malence observa-tory. It was drilled in October 1986, through the upper 7.8 m of Quaternary gravel, sand and clay, and down to the bottom through Oligocene clay. One conductivity value of clay from a depth of 60 m is available (1.43 W m−1K−1). The well was logged in January 1987, 3 months after the drilling, and then in 2005 (Fig. 3d).
In January–March 2003 borehole PDt-1/03 Brod-Podboˇcje (Fig. 2) was drilled five kilometers east of the Malence station (in the same geological setting) to a depth of 848 m. It penetrated 12 m of Quaternary clay, sand and gravel, underlain first with Upper Miocene sediments, predominantly quartz sand and carbonate silt down to 240 m and sandy silt, sandstone and marl down to 474 m. Below this depth was a sandy to marly limestone and calcarenite of Badenian age down to 675 m, followed by gravel, sand and clay of Ottnangian age down to 767 m and finally Upper Cretaceous carbonatic breccia, limestone, sandstone and quartz extended to the bottom of the borehole. The borehole was logged for the equilibrium temperature only once, in October 2006, but contrary to other Slovenian boreholes mentioned above, its greater depth allowed an inversion of the uppermost 260 m of the log (Fig. 5) in terms of the ground surface temperature history, similar to the profiles from the Czech and Portuguese observatories.
All logs were done sufficiently long after the borehole drilling for disturbances of temperature induced by the drilling to fade out. Therefore they show the true bedrock temperature. Most of the logs were done with the logging tool of the Geophysical Institute Prague, the resolution of which is a few mK and absolute accuracy of the order of 0.01 K. The Portuguese log in 1997 and the Slovenian logs
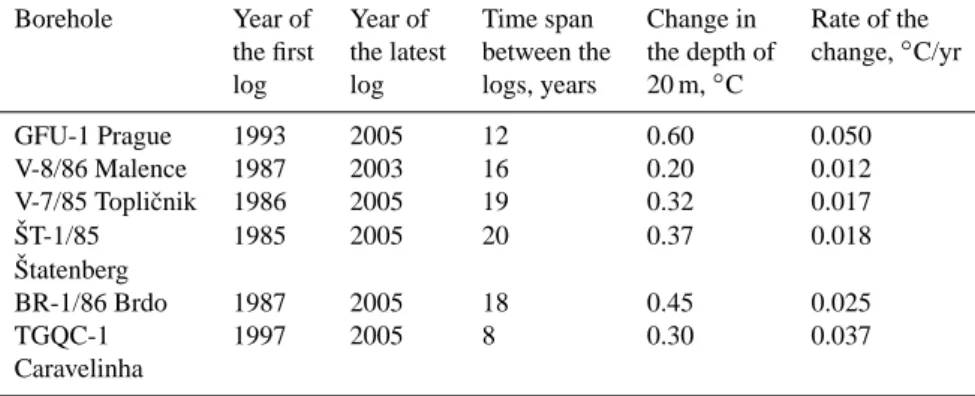
Table 1. Amplitude of the warming at the depth of 20 m observed in the individual boreholes by repeated logs.
Borehole Year of Year of Time span Change in Rate of the the first the latest between the the depth of change,◦C/yr log log logs, years 20 m,◦C
GFU-1 Prague 1993 2005 12 0.60 0.050 V-8/86 Malence 1987 2003 16 0.20 0.012 V-7/85 Topliˇcnik 1986 2005 19 0.32 0.017 ˇST-1/85 1985 2005 20 0.37 0.018 ˇStatenberg BR-1/86 Brdo 1987 2005 18 0.45 0.025 TGQC-1 1997 2005 8 0.30 0.037 Caravelinha
in the 80’s were done with tools of the Geological Survey of Portugal and Slovenia, respectively. Resolution of these tools was of the order of 0.01 K and an absolute accuracy of the order of 0.1 K. When comparing the repeated logs, it was assumed that small differences between their lowermost linear sections (80–100 m and below) are due to imperfect calibration.
3 Results
3.1 Observed and simulated temporal subsurface tempera-ture changes
The repeated logs shown in Figs. 1, 3 and 4 can be used to ex-amine the subsurface temperature changes over the logging period and their depth dependence. Figures 6–8 depict differ-ences between the most recent and the most remote tempera-ture logs of the individual Czech, Slovenian and Portuguese boreholes, starting from a depth of 15 m.
All differences indicate warming (Figs. 6–8, Table 1), which is in qualitative agreement with the SAT observations. The most intensive warming is observed in the Czech bore-hole, where its amplitude amounts to 0.6◦C at 20 m dur-ing the 12 year period 1993–2005 (Fig. 6) (warmdur-ing rate of 0.050◦C/yr) and temporal changes are evident down to 90 m. Appreciably smaller changes were registered at the Slove-nian observatory in borehole V-8/86 Malence (Fig. 7a) and in nearby borehole V-7/85 Topliˇcnik (Fig. 7b), with warm-ing amplitudes of 0.2◦C in the 16-year period 1987–2003
(0.012◦C/yr) and 0.3◦C in the 19-year interval 1986–2005
(0.017◦C/yr), respectively. The differences here attenuate
quickly with depth and diminish at 30–40 m. Slightly higher differences, about 0.4◦C at 20 m, are displayed by another two Slovenian boreholes ˇST-1/85 ˇStatenberg (Fig. 7c) and BR-1/86 Brdo (Fig. 7d) over a span of 20 years (1985–2005) (0.018◦C/yr) and 18 years (1987–2005) (0.025◦C/yr), re-spectively. They go also deeper than the previous two, to 90 m in ˇST-1/85 ˇStatenberg and to 50 m in BR-1/86 Brdo.
Repeated logs of borehole TGQC-1 Caravelinha at the Por-tuguese station cover an 8-year interval (1997–2005) and in-dicate warming of 0.3◦C at 20 m (0.037◦C/yr) fading out by a depth of 120 m (Fig. 8).
In order to explore the degree of coupling between the air and ground temperatures and propagation of the surface tem-perature changes downward into the bedrock, the observed differences are compared with synthetic profiles that were calculated for each borehole site by solving the heat conduc-tion equaconduc-tion, using the SAT observaconduc-tions at the correspond-ing meteorological stations as a surface forccorrespond-ing function. The heat conduction equation was solved with the finite differ-ence method ( ˇSafanda, 1985, ˇSafanda and ˇCerm´ak, 2000) for a one-dimensional case. No heat flow was assumed through the lower boundary set at a depth of 500 m (Smerdon and Stieglitz, 2006; Stevens et al., 2007). The simulations be-gin with the first SAT observation and continue to the time of the last borehole logging. The solution of the equation – the subsurface transient response to the SAT forcing func-tion - depends on the initial temperature versus depth profile, which was considered constant. This temperature value is referred to as the initializing temperature (IT) in order to dis-tinguish it from the so called pre-observational mean, which is the initializing temperature optimized with respect to the fit between the simulated and measured transient profiles. This parameter strongly influences the shape of the transient pro-file ( ˇSafanda et al., 1997; Harris and Chapman, 1997; Ma-jorowicz et al., 1999, 2004), but, as shown below, not so much a difference of the transient profiles. The synthetic differences for the Czech, Slovenian and Portuguese bore-holes were calculated using the SAT series from meteorolog-ical stations in Prague, Ljubljana and Lisbon, respectively. The distance between a borehole and a corresponding mete-orological station is not more than 100 km in all cases. The ITs used for these SAT series were equal to the mean of the first 50 years of the observations, i.e. 9.8◦C (1771–1820) for Prague, 9.0◦C (1851–1900) for Ljubljana and 15.6◦C (1856– 1905) for Lisbon. In order to demonstrate a low sensitivity of
J. ˇSafanda et al.: Repeated temperature logs from Czechia, Slovenia, Portugal 457
Fig. 3. Repeated temperature logs done in Slovenia in borehole (a) V-8/86 Malence at the site of the Slovenian borehole climate
observatory, (b) V-7/85 Topliˇcnik, (c) ˇST-1/85 ˇStatenberg and (d) BR-1/86 Brdo.
Fig. 4. Repeated temperature logs of the TGQC-1 Caravelinha
bore-hole at the site of the Portuguese borebore-hole climate observatory in Caravelinha near Evora done in the period 1997–2005.
Fig. 5. Temperature log of the upper part of borehole PDt-1/03
Brod-Podboˇcje.
the synthetic differences to the chosen IT, we considered IT values that varied by ±0.5◦C around the first-50-year-mean; the calculated curves are plotted together with the observed differences in Figs. 6–8. As expected, the sensitivity of the synthetic difference to the chosen IT is very small. It does not exceed 0.013◦C for the Czech and Portuguese boreholes and 0.034◦C for the Slovenian boreholes and is comparable with the noise level in the temperature logs.
In computing the synthetic transients for the Portuguese and the Czech sites, we used annual means because the re-peated logs were done in the same season of a year. In the case of the Slovenian sites, the monthly means were also used alternatively to account for a possible influence of the annual run on the difference calculated from the repeated logs done in different seasons of a year. It turned out that below 15 m the results yielded by the two alternatives coincide within
Fig. 6. Comparison of the difference between the repeated logs
(2005–1993) of the Czech borehole GFU-1 Prague versus the dif-ference simulated by SAT series from the Prague meteorological station. Three different initializing temperature (IT) values were considered. IT = 9.8◦C is equivalent to the 1771–1820 SAT mean.
several hundredths of a degree Celsius. Using the monthly means of the Ljubljana meteorological station, we also tested the concept of the surficial active layer (Pollack et al., 2005), i.e. surficial processes of the heat transfer are simulated by a reduced thermal diffusivity layer at shallow depths. We considered a 0.5 m thick layer below the ground surface with diffusivity 0.2×10⁻⁶m2s−1. Influence of this low diffusiv-ity layer on the synthetic differences is negligible. This is in agreement with the results of Pollack et al. (2005), because the difference between the repeated logs arises from multi-year variations and a multi-decadal warming trend, which pass through the active layer without a substantial alteration. 3.2 Ground surface temperature history
As shown in the previous section, the repeated logs and their differences agree qualitatively with the SAT series from the nearby stations. Although a degree of agreement varies among the individual sites and is definitely influenced by site specific conditions, it suggests that the signals con-tained in the two sets of data are coupled and it makes sense to invert the observed temperature-depth profiles to yield a ground surface temperature history. Therefore, we ap-ply the functional space inversion method (FSI) (Shen and Beck, 1991) to the temperature versus depth profiles from the Czech (Fig. 1) and Portuguese (Fig. 4) observatories, which are 140 m and 188 m deep, respectively, and to the upper-most 260 m of the Slovenian profile from borehole PDt-1/03 Brod-Podboˇcje (Fig. 5). The other temperature profiles from
Fig. 7. Comparison of the difference between the repeated logs
of the Slovenian boreholes versus difference simulated by SAT se-ries from Ljubljana. (a) V-8/86 Malence at the site of the Slove-nian borehole climate observatory, (b) V-7/85 Topliˇcnik, (c) ˇST-1/85 ˇStatenberg and (d) BR-1/86 Brdo. Three different initializing temperature (IT) values were considered. IT = 9.0◦C is equivalent to the 1851–1900 SAT mean.
J. ˇSafanda et al.: Repeated temperature logs from Czechia, Slovenia, Portugal 459
Fig. 8. Comparison of the difference between the repeated logs
(2005–1997) of the Portuguese borehole TGQC-1 Caravelinha ver-sus the difference simulated by SAT series from Lisbon. Three dif-ferent initializing temperature (IT) values were considered. IT = 15.6◦C is equivalent to the 1856–1905 SAT mean.
Slovenia are only 100 m deep and their inversion could not reproduce the whole amplitude of the recent warming (Ma-jorowicz et al., 2004). The reconstructed variations of the ground surface temperature (GST) history are depicted in Figs. 9a–c. In the case of the Czech and Portuguese profiles both individual and simultaneous inversions of the oldest and the most recent repeated logs were done (Figs. 9a, c). Con-sidering repeated logs in a simultaneous inversion helps to constrain better the steady-state part of the temperature pro-file, which is determined in a decisive manner by possible conductivity variations with depth. The GST histories re-constructed from individual inversions of the oldest and the youngest profiles differ considerably. This fact is connected with quickly decreasing resolution of the GST reconstruction going back in time. FSI of the Slovenian borehole, which was logged only once and where the estimated diffusivity of sedimentary rocks is not constrained by measured conduc-tivity data, was done for three different diffusivity estimates covering the possible range (Fig. 9b). As expected, the effect of different diffusivity values assumed for the reconstructed GST history is small.
The GST histories at the Czech, Slovenian and Portuguese sites are shown together with the mean annual SAT and its 11-year running average from meteorological stations in Prague, Ljubljana and Lisbon, respectively (Fig. 9). Whereas the resolution of the SAT series does not change in time, reso-lution of the GST reconstruction decreases with time into the past. The reconstructed GST at a given moment τ in the past
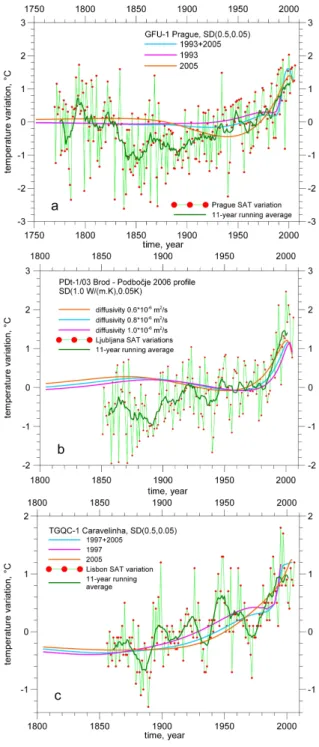
Fig. 9. Ground surface temperature histories reconstructed by
func-tional space inversion for the Czech (a), Slovenian (b) and Por-tuguese (c) borehole climate observatories. Variations of the ground temperature are shown together with variations of the surface air temperatures and their 11-year running averages from meteorolog-ical stations in Prague, Ljubljana and Lisbon, respectively. For the Czech and Portuguese boreholes both individual and simultaneous inversions of the repeated logs were done. Three histories shown for the Slovenian borehole corresponds to three different hypothesis of thermal diffusivity assumed in the inversion.
is a weighted average of temperature over a certain period of time, which increases linearly with τ like 0.5–0.7×τ (Clow, 1992). Thus, the GST value reconstructed, e.g. for the year 1850 from the temperature – depth profile measured in the year 2000, represents a weighted average over the time inter-val 1812–1887 (for the rate 0.5×τ ) up to 1797–1902 (for the rate 0.7×τ ) This loss of resolution explains a smoothness of the reconstructed GST histories and their incapability to re-solve decadal and multidecadal variations seen in the SAT se-ries prior to the last few decades. The SAT sese-ries were shifted tentatively to the level of the reconstructed GST variations in the interval 1961–1990, because the long-term values of their differences are not known yet and should be determined on the established borehole climate observatories. The used SAT series represents the longest one in each of the three countries. Observations in Prague began in the year 1771, in Ljubljana in 1851 and in Lisbon in 1856. The distance of the corresponding meteorological stations from the borehole sites is about 8 km in Prague, 80 km in Slovenia and 100 km in Portugal. Each of the meteorological stations is located in a large city, with Lisbon and Prague having about 1 mil-lion inhabitants each and Ljubljana about 0.3 milmil-lion. There-fore, the amplitude of the recent warming which started at the end of the 19th century may have been enhanced by the anthropogenic effect caused by the growing cities ( ˇSafanda et al., 1997). This could explain different amplitudes of the warming between SAT and GST observed at Prague and in Slovenia. The amplitude of the SAT warming since the end of the 19th century is about 2◦C both at Prague and Ljubl-jana, whereas the amplitudes of the GST warming at corre-sponding borehole sites are 0.5–1◦C smaller. Nevertheless,
in Portugal both the amplitude and the variations of the Lis-bon SAT warming are quite well reproduced by the inversion of the Portuguese profile, where it amounts to about 1.5◦C. One possible explanation of this difference between Portu-gal and Central Europe could be a different relative level of long-term means prior to 1840 with respect to the levels typ-ical for the period 1840–1900. As the Prague’s SAT series indicates, temperatures prior to 1840 were higher than in the period 1840–1900 in Central Europe and that is why the GST reconstructions yield there a long-term mean higher than the 1840–1900 SATs. It is possible that in Portugal this was not the case and the long-term mean prior to 1840 is comparable there with the 1840–1900 level.
4 Discussion
Both the observed and the synthetic differences (Figs. 6–8) reveal a warming, but the degree of quantitative agreement varies appreciably. In the Portuguese and the Czech bore-holes the synthetic difference approximates the observed dif-ference quite well below the depth of 40–50 m. By con-trast, in Slovenian boreholes V-8/86 Malence and V-7/85 Topliˇcnik, the synthetic difference is larger that the
ob-served difference even for the lowest possible diffusivity of 0.4×10⁻⁶m2s−1. Relatively good agreement between the two differences appears in the remaining two Slovenian bore-holes ˇST-1/85 ˇStatenberg and BR-1/86 Brdo for the realistic diffusivities 0.8×10⁻⁶m2s−1and 0.4×10⁻⁶m2s−1, respec-tively.
The most prominent feature of the SAT series is an accel-eration of the warming in the last two decades of the 20th century. In this respect it is interesting to compare the am-plitude of warming of the 11-year SAT running average and that of the GST reconstructed by the FSI in the period 1980– 2000. GST warming surpassed the SAT warming by 0.4◦C in Czechia (1.4◦C versus 1.0◦C) (Fig. 9a) and by 0.2◦C in Por-tugal (0.8◦C versus 0.6◦C) (Fig. 9c), but was 0.3◦C smaller in Slovenia (1.0◦C versus 1.3◦C) (Fig. 9b) during this pe-riod. The last two decades of warming has a strong influence on the temporal changes observed by the repeated logging. In accordance with the results of the FSI reconstructions, the observed differences are higher than the simulated profiles at the Czech and Portuguese observatories, but lower at the Slovenian station.
The largest difference was observed at the Czech obser-vatory, 0.6◦C at 20 m (warming rate of 0.050◦C/yr) (Fig. 6, Table 1). It is two times more than the simulated difference suggests. Therefore, it could be that subsurface temperature at the station is influenced by new structures built within the campus of the Geophysical Institute within the last 10–20 years and/or by other components of infrastructure (asphalt roads, a playground etc.) built 40–50 years ago. This sus-picion is supported by an otherwise good correspondence of the two differences at depths below 50 m. We carried out a quantitative analysis of these effects in the spring of 2007 (Dˇedeˇcek et al., 2007b) by solving numerically the heat con-duction equation in a three dimensional geothermal model of the borehole site. In compiling the model, we used results of our ground temperature monitoring below grass, sand and asphalt (Dˇedeˇcek et al., 2007a). It turned out that the above mentioned anthropogenic structures influence the tempera-ture in the borehole quite strongly. Their warming effect in the uppermost 40 m is nearly as large as the warming due to increasing SAT. This fact explains very well the discrepancy between the GST and SAT warming rates in the last decades (Fig. 9a). It also means that the coupling between the air and ground temperatures is quite strong at this site.
The situation at the Portuguese observatory is qualitatively similar to that at the Czech station. Here the observed differ-ence also surpasses the simulated profile in the uppermost 40 m and is similar to the profile below this depth (Fig. 8). In absolute values, however, the differences and their mis-fit are much smaller. The observed warming of 0.3◦C at 20 m (warming rate of 0.037◦C/yr) is 50% of that in Prague. The observed higher-than-simulated warming in the bore-hole might stem, at least partially, from possible differences in the last two decades of SAT warming on the Atlantic Ocean coast, represented by the Lisbon SAT series, and at
J. ˇSafanda et al.: Repeated temperature logs from Czechia, Slovenia, Portugal 461 the borehole site with a more continental climate typical for
the interior of the country.
The observed differences in borehole V-8/86 Malence at the site of the Slovenian observatory (Fig. 7a) and in the nearby borehole V-7/85 Topliˇcnik (Fig. 7b) are smaller than the simulated profiles and diminish to the noise level at shal-low depths of 30–40 m. The smaller-than-expected warm-ing of the ground is also evident from the GST history ob-tained by inversion of the temperature log of the third bore-hole in the area, PDt-1/03 Brod-Podboˇcje (Fig. 9b). All three boreholes are situated in the alluvial plain of the Krka river. As the long-term temperature monitoring (since November 2003) in the uppermost 40 m of the Malence station indicates (Rajver et al., 2006), a heat advection by horizontal ground-water flow is likely present here and interferes to a certain degree with the vertically propagating surface temperature changes.
The two remaining Slovenian boreholes, ˇST-1/85 ˇStatenberg and BR-1/86 Brdo, display the best fit of the observed and simulated differences among the boreholes discussed in the paper. Substantial misfits appear only at a depth of 15 m (Figs. 7c–d), where an influence of some unaccounted superficial effect(s) cannot be excluded
5 Conclusions
The repeated logging of 6 boreholes, among them those which became a part of the Czech, Slovenian and Portuguese borehole climate observatories, revealed a warming of the subsurface within the logging period spanning 8–20 years prior 2003–2005. The observed warming is in qualitative, and in some boreholes also in quantitative, agreement with the warming simulated by the 150–230 year-long SAT series from Prague, Ljubljana and Lisbon. The revealed discrepan-cies do not necessarily mean an imperfect air – ground sur-face temperature tracking, because they could stem at least partially from a bias in the SAT series due to the growing urban effects and/or from site-specific factors. The SAT se-ries used in the simulations were measured in large cities, but the boreholes are located either in countryside (the Slovenian and Portuguese boreholes) or on a rim of a city (the Czech borehole). In the case of the Czech observatory, we were able to show that after taking into consideration the effect of an-thropogenic structures in the borehole surroundings, the SAT series reproduces the warming trend observed in the borehole very well. In the case of the Portuguese station, located 100 km inland, the rapid warming of the last two decades could be higher than that revealed in the Lisbon SAT series, where it might be moderated by proximity of the Atlantic Ocean. At the Slovenian observatory, the weak subsurface warming could be connected with a horizontal groundwater flow. Acknowledgements. We are thankful to R. Harris, D. Demezhko,
Anonymous Referee and J. Smerdon for their valuable comments and language improvements. This research has been supported by
NATO Collaborative Linkage Grant PDD(CP)-(EST.CLG 980 152) and by the grant project IAA300120603 of the Grant Agency of the Academy of Sciences of the Czech Republic.
Edited by: J. Smerdon
References
Bartlett, M. G., Chapman, D. S., and Harris, R. N.: A decade of ground-air temperature tracking at Emigrant Pass Observatory, Utah, J. Climate, 19, 3722–3731, 2006.
ˇ
Cerm´ak, V., and Rybach, L.: Thermal conductivity and specific heat of minerals and rocks, in: Physical Properties of Rocks, edited by: Angenheister, G., Landolt-B¨ornstein New Series, Vol. V/1a, Springer, Berlin, 305–343, 1982.
ˇ
Cerm´ak, V., ˇSafanda, J., Kreˇsl, M. , Dˇedeˇcek, P., and Bodri, L.: Recent climate warming: surface air temperature series and geothermal evidence, Studia geoph. et geod., 44, 430–441, 2000. Chapman, D. S. and Harris, R. N.: Repeated temperature measure-ments in borehole GC-1, northwestern Utah: Towards isolating climate-change signal in borehole temperature profiles, Geophys. Res. Lett., 20, 1891–1894, 1993.
Clow, G. D.: The extent of smearing in surface-temperature his-tories derived from borehole temperature measurements, Global Planet. Change, 6, 81–86, 1992.
Dˇedeˇcek, P., ˇSafanda, J., ˇCerm´ak, V., and Kreˇsl, M.: Long-term monitoring of the air-ground temperature coupling under the dif-ferent surface conditions – the four years completed. Abstracts, DGG Aachen, March 26–29, 2007, p.164, 2007a.
Dˇedeˇcek, P., ˇSafanda, J., and Rajver, D.: Thermal signature of anthropogenic structures on the subsurface temperature field – examples from Slovenia and the Czech Republic, Geo-phys.Res.Abstr., Vol.9, 2007, EGU General Assembly 2007, 1607-7962/gra/EGU2007-A-04310, Wien, April 2007, 2007b Harris, R. N. and Chapman, D. S.: Borehole temperature as a
base-line for 20th-century global warming estimates, Science, 275, 1618–1621, 1997.
Harris, R. N. and Chapman, D. S.: Mid-latitude (30◦–60◦)climatic warming inferred by combining borehole temperatures with sur-face air temperatures, Geophys. Res. Lett., 28, 747–750, 2001. Huang, S., Pollack, H. N., and Shen, P.-Y.: Temperature trends over
the last five centuries reconstructed from borehole temperatures, Nature, 403, 756–758, 2000.
Majorowicz, J., ˇSafanda, J., Harris, R. N., and Skinner, W. R.: Large ground surface temperature changes of the last three centuries inferred from borehole temperatures in the Southern Canadian Prairies, Saskatchewan, Global Planet. Change, 20, 227–241, 1999.
Majorowicz, J., Skinner, W., and ˇSafanda, J.: Past surface tem-perature changes as derived from continental temtem-perature logs – Canadian and some global examples of application of a new tool in climate change studies, Adv. Geophys., 47, 113–174, 2004. Majorowicz, J., Skinner, W., ˇSafanda, J., and Gosnold, W.:
Dif-ferences between repeated borehole temperature logs in the southern Canadian Prairies – validating borehole climatology, Clim.Past Discuss.,2, 1075-1104, 2006
Pollack, H. N. and Smerdon, J. E.: Borehole climate reconstruc-tions: Spacial structure and hemispheric averages, J. Geophys.
Res., 109, D11106, doi:10.1029/2003JD004163, 2004.
Pollack, H. N., Smerdon, J. E., and van Keken, P. E.: Variable sea-sonal coupling between air and ground temperatures: A simple representation in terms of subsurface thermal diffusivity, Geo-phys. Res. Lett., 32, L15405, doi:10.1029/2005GL023869, 2005. Putnam, S. N. and Chapman, D. S.: A geothermal climate change observatory:First year results from Emigrant Pass in northwest Utah, J. Geophys. Res., 101, 21 877–21 890, 1996.
Rajver, D., ˇSafanda, J., and Dˇedeˇcek, P.: Monitoring of air-ground temperature coupling and examples of shallow subsurface warm-ing in Slovenia, Geologija, 49/2, 279–293, 2006.
ˇSafanda, J.: Calculation of temperature distribution in two-dimensional geothermal profile, Studia geoph. et geod., 29, 191– 207, 1985.
ˇSafanda, J.: Effects of topography and climatic changes on the tem-perature in borehole GF ´U-1, Prague, Tectonophysics, 239, 187– 197, 1994.
ˇSafanda, J. and ˇCerm´ak, V.: Subsurface temperature changes due to the crustal magmatic activity – numerical simulation, Studia geoph. et geod., 44, 327–335, 2000.
ˇSafanda, J., ˇCerm´ak, V., and Bodri, L.: Climate history inferred from borehole temperatures, data from the Czech Republic, Sur-veys in Geophysics, 18, 197–212, 1997.
Shen, P.-Yu. and Beck, A. E.: Least squares inversion of borehole temperature measurements in functional space, J. Geophys. Res., 96, 19 965–19 979, 1991.
Smerdon, J. E., Pollack, H. N., ˇCerm´ak, V., Enz, J. W., Kreˇsl, M., ˇSafanda, J., and Wehmiller, J. F.: Air-ground temperature cou-pling and subsurface propagation of annual temperature signals, J. Geophys. Res., 109, D21107, doi: 10.1029/2004JD005056, 2004.
Smerdon, J. E., Pollack, H. N., ˇCerm´ak, V., Enz, J. W., Kreˇsl, M., ˇSafanda, J., and Wehmiller, J. F.: Daily, seasonal and annual re-lationships between air and subsurface temperatures, J. Geophys. Res., 111, D07101, doi:10.1029/2004JD005578, 2006.
Smerdon, J. E. and Stieglitz, M.: Simulating heat transport of har-monic temperature signals in the Earth’s shallow subsurface: Lower-boundary sensitivities, Geophys. Res. Lett., 33, L14402, doi:10.1029/2006GL026816, 2006.
Stevens, M. B., Smerdon, J. E., Gonz´ales-Rouco, J. F., Stieglitz, M., and Beltrami, H.: Effects of bottom boundary placement on sub-surface heat storage: Implications for climate model simulations, Geophys. Res. Lett., 34, L02702, doi:10.1029/2006GL028546, 2007.
ˇStulc, P.: Return to thermal equilibrium of an intermittently drilled hole: theory and experiment, Tectonophysics, 241, 35–45, 1995.