HAL Id: hal-01085303
https://hal.archives-ouvertes.fr/hal-01085303
Submitted on 21 Nov 2014HAL is a multi-disciplinary open access archive for the deposit and dissemination of sci-entific research documents, whether they are pub-lished or not. The documents may come from teaching and research institutions in France or
L’archive ouverte pluridisciplinaire HAL, est destinée au dépôt et à la diffusion de documents scientifiques de niveau recherche, publiés ou non, émanant des établissements d’enseignement et de recherche français ou étrangers, des laboratoires
(Tetraclinis articulata (Vahl) Masters)
S El Alami, Mohammed El Mouridi, Thierry Laurent, Gilles Calchéra, A
Famiri, A Hakam, B Kabouchi, Joseph Gril
To cite this version:
S El Alami, Mohammed El Mouridi, Thierry Laurent, Gilles Calchéra, A Famiri, et al.. Fracture energy of wood and root burl wood of thuya (Tetraclinis articulata (Vahl) Masters). Journal of Tropical Forest Science, Forest Research Institute Malaysia, 2013, 25, pp.166 - 174. �hal-01085303�
Fracture energy of wood and root burl wood of
thuya (Tetraclinis articulata (Vahl) Masters)
S. El Alami1, M. EL Mouridi2.5, T. Laurent2, G. Calchéra3, A. Famiri4, A. Hakam5, B. Kabouchi1, J. Gril21Laboratoire de Spectronomie Moléculaire, Optique et Instrumentation Laser, Faculté des
Sciences, Université Mohammed V-Agdal, Rabat, Morocco, sal_alami@yahoo.fr, kabouchi@fsr.ac.ma
2Laboratoire de Mécanique et Génie Civil (LMGC), Université Montpellier 2, CNRS, France
{mohamed.el-mouridi, thierry.laurent, joseph.gril}@univ-montp2.fr
3CIRAD, Département PERSYST, gilles.calchera@cirad.fr
4Centre de Recherche Forestière (C.R.F), Rabat, Morocco, afamiri2001@yahoo.fr
5Laboratoire des Sciences et Technologies du Bois, Faculté des Sciences, Université
Mohammed V-Agdal, Rabat, Morocco, ahakam@fsr.ac.ma
ABSTRACT
The fracture energy of wood and root burl wood of thuya, coming from the forest of Essaouira (Morocco), was measured using a single edge notched specimen bending (SENB) test method. The variations along the longitudinal and transverse directions were studied using specimens taken from one radial section of thuya wood and on radial section of thuya burl, originating from two different trees. Thuya burl was more resistant than thuya wood to crack propagation in RL system (in the tangential plane). This difference is explained by the presence of dark growths, composed of cells with thicker walls that make the burl wood usually denser than thuya wood. Thuya burl was more resistant to crack propagation in RL system (tangential plane) than in TL system (radial plane), which is consistent with the radial orientation of the dark growths. The observed decrease of fracture energy along the longitudinal direction was explained by the progressive reduction of dark growth concentration.
Keywords: Thuya wood, thuya burl, Tetraclinis articulata, fracture energy, mode I, single edge notched bending specimen SENB.
INTRODUCTION
Fracture energy in mode I, denoted Gf, I, is the mechanical energy required to produce the
complete rupture in opening mode of a pre-split sample, divided by the ruptured surface (Baillères 1994, Gustafsson and Larsen 1990). This parameter, measured in N/m, is used to characterize a material's ability to withstand crack propagation. It is, in principle, an intrinsic property that enables the optimum choice of material for a specific application and provides an understanding of its performance in service.
The materials considered are thuya wood (Tetraclinis articulata) and thuya root burl wood, simply referred to as “thuya burl” hereafter. Thuya burl is an outgrowth developing
underground on the root of the thuya tree under poorly understood conditions. Its wood is prized by craftsmen for inlay work, cabinet-making and production of various items (Chakir 1999); it plays an important socioeconomic role for meeting the local needs of neighboring populations (Boudy 1950, Ballis 1992).
The published studies concerning the thuya tree pertain mainly to the development and/or phytoecology of this forest species (Benabid 1977, Fennane et al. 1984, Fennane 1987), to thuya wood drying (Lmouchter 2001), thuya wood quality (Dakak 2002) and to attacks by fungi (Abbas et al. 2006). More recently, a study was conducted on the physical characterization of thuya burl wood (El Mouridi et al 2011). No study on the fracture energy of thuya wood or thuya burl has previously been undertaken. This information could, however, be used to optimize the cutting processes used by craftsmen. The purpose of this study was to determine fracture energy within a disc of thuya burl, a material whose mechanical behavior is poorly known, and to compare it to that of thuya wood.
MATERIALS AND METHODS Sampling and cuts
The raw material used in this study was obtained from the Ait Daoued forest, in the province of Essaouira (Morocco). It was a thuya log of approximately one metre in length, along with a whole thuya burl (figure 1a). As it is very difficult to obtain raw material, this plant material was obtained from a seizure made by the Essaouira High Commission for Water and Forests. Consequently, we have no guarantees that the wood and the burl were obtained from the same tree.
Sawing was performed at the Physical and Mechanical Test Laboratory of the Forestry Research Center (CRF) in Rabat (Morocco). Test pieces were cut and tests conducted at the CIRAD in Montpellier (France).
The thuya burl was divided into two twin sections, sawn through a longitudinal plane (figure 1a). The two central sections M1 and M2 (figure 1b) were set aside for the fracture energy test. They were identified by 3 directions, L: corresponding to the longitudinal direction of the tree trunk, along with the R and T directions defining the transverse plane to this axis.
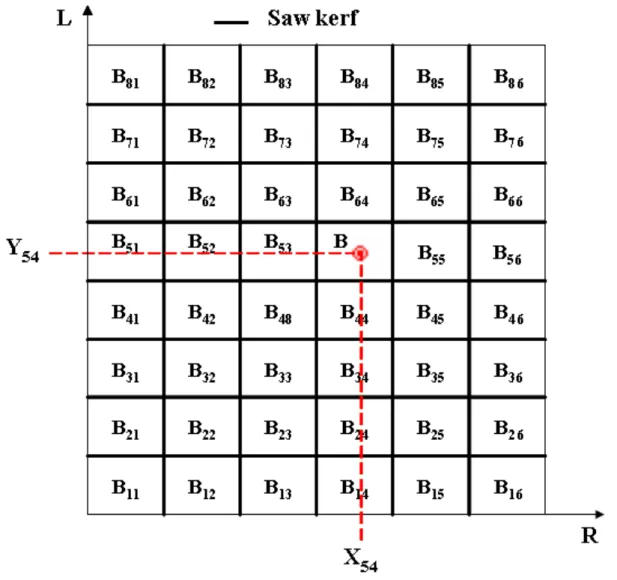
To correctly understand the directional identification of the samples, as used in this study, we must go over the choice of directions (R, T, L) conventionally used for wood. Indeed, a transverse section of thuya (perpendicular to the trunk's main direction) (figure 2a) clearly identifies the radial and tangential directions from growth ring orientation. In thuya burl, on the other hand, a transverse section (Figure 2b) does not display the same symmetries. This secondary or radial growth is, in part, modified by the presence of darker outgrowths, specific to thuya burl, with symmetries similar to those of the wood, but at the local level. Thus, we shall keep the usual notations (L, R, T) for thuya burl, with the R and T indices corresponding respectively to disc width and thickness. We thus traced a grid on disk M1 to create test pieces of dimensions R=12 mm x T=20 mm x L=20 mm, taking the saw kerf into account. Thuya
burl samples were marked according to a Bij row-column grid notation, where (B) indicates
the name of the studied wood (B for thuya burl and W for thuya), i is the ith row and j the jth column. Row 1 is at the bottom of the disc and column 1 is the column coinciding with the first longitudinal sawing plane of the burl (Figure 1c, Figure 3). The coordinates (Xij, Yij) of
the centre of each disc test piece (Figure 3), were determined by the following equations: Xij = a(j – 0.5) + (j-1)e ; Yij = a(j – 0.5) + (j-1)e (1)
where a and b are respectively the sample's width and height and 'e' is the thickness of the saw kerf, measured at 3.5 mm. The thuya wood log was cut into slabs. Only the central section, 20mm thick, was kept. It was divided into two parts along its longitudinal axis passing through the pith, then traced and marked in the same manner as that used for the thuya burl. These parallelepipeds will be used as the central part of single-edge-notched bending (SENB) specimens, using the procedure developed to estimate the fracture energy of wood in mode I of crack propagation by Gustafsson and Larsen (1990), as detailed below.
After having marked the edges of the discs, the arms were glued on (figure 4a) using a SADER Professional R22 polyvinyl adhesive, allowing repositioning during the first minutes. The system was clamped for a period of at least 24h (figure 4b). The wood used to create the arms was goupil, selected for its high rigidity that allows neglecting their contribution to the elastic energy during the bending test. Once the discs had been glued and stabilized, they were sawn twice to obtain the test pieces, dimensions 20mm x 12mm x 140mm (figure 5). To reduce the concern for the unstable crack propagation an initial crack length equal to 12 mm (60% of the beam depth), ensuring a stable response (Daudeville. 1999), was cut into each test piece along the section's greatest length, using a 1.5 mm thick special circular saw whose head is similar to a razor blade. The system of crack propagation is described by two letters AB, where A specifies the direction perpendicular to the plane of the crack (the axial direction of the central portion of the specimen) and B specifies the expected direction of crack propagation (the height of the specimen) (Smith et al. 2003). The TL and RL crack propagation systems constitute the most frequent ones because of the particular design of timber structures. Fracture energy measurements were conducted on 81 thuya wood specimens prepared for TL system, and on 137 thuya burl specimens, with 88 prepared for the TL system and 49 for the RL system. In order to clarify the definition of the modes, figure 6 illustrates the two chosen systems in the case of wood.
Measurement of moisture content and density
The physical moisture content and density measurements were performed, for each section, after the fracture energy tests, on 8 mm × 12 mm × 20 mm test pieces. 25 of these test pieces were used for thuya wood and 27 for thuya burl. Weight measurements were performed using a Sartorius precision balance with a resolution of 0.001 g and the dimensions in the three reference directions were measured using a Mitutoyo digital comparator with a resolution of 0.001 mm.
Measurement of fracture energy
The experimental system is comprised of an electromechanical universal testing machine (figure 7a) fitted with a force gauge with a maximum capacity of 2000N (at 0.1% of force reading) to induce fracture in mode I.
The upper cross piece, equipped with a displacement transducer with a resolution of 0.01 mm, was used to perform the 3-points bending test. The test was programmed and controlled by a computer that was also used to acquire the measurements using the "TestWorks4" software. The 3-points bending set-up (figure 7b) comprised two supports with a span of 120 mm: one was a 25 mm diameter steel ball and the other a freely rotating 30 mm diameter roller. This assembly allows to correct for possible parallelism problems between the side arms and the central element (pre-cut test sample) and to vertically align the 25 mm diameter central support ball and the cut. Even the most carful machining cannot prevent the occurrence of
growth irregularities, that would very easily provoke unwanted torsion load and result in mixed rupture mode. Indention resulting from the use of steel balls and cylinder cannot be out-ruled, but would contribute by a negligible amount to the measured displacement.
The method described by Gustafsson & Larsen (1990) was used to measure the fracture energy. Following a procedure proposed by Baillères (1994), preliminary tests were performed to determine the displacement speed of the load cell most appropriate for our type of wood. From 0.5 mm/min at the start of the test, it was increased to 2 mm/min after 3 minutes and to 8 mm/min 5 minutes later. These velocities were determined such that the shape of the force-displacement curve (figure 8) was similar to the curve obtained by Gustafsson & Larsen (1990). The test was stopped once fracture was complete, and this was achieved for every specimen. The displacement was measured using linear variable differential transducers (LVDT, range ± 2.5 mm) in contact with a reference surface rigidly attached to the load application device. Force and displacement values were recorded every 0.1 sec and saved into a file. The fracture energy Gf,I was calculated as the sum of work
performed by the central support and by the dead weight of the test piece, relative to the area of the fractured surface:
⎟ ⎟ ⎠ ⎞ ⎜ ⎜ ⎝ ⎛ + =
∫
0 0 0 , mg. d 1 δδ
δ
F S Gf I (2)where δ0 is the displacement recorded from the start of loading until complete fracture, S the
theoretical (nominal) fractured ligament area, mg the test piece weight and F the force recorded during the test.
It should be noted that although the test is intended to measure a material property, the value obtained by such a procedure is not intrinsic to the material, due to the existence of a damaged zone in front of the tip of the crack (process zone), responsible for scale effects that cannot be quantified. It can, however, be used to perform inter-material and inter-direction comparisons. RESULTS AND DISCUSSION
Density and moisture content
The density and moisture content values for thuya wood and burl, obtained from the test pieces, are presented in Table 1. The moisture content of the test pieces was of 8.88±0.15% for thuya wood and of 12.2±0.4% for thuya burl.
Thuya burl is dense, comprised of dark-colored, high-density outgrowths, encased in a "matrix" of ligneous tissue with a density comparable to that of thuya wood (El Mouridi et al. 2011). The small size of the samples used to determine density and moisture content, meant that these latter contained few or no outgrowths, thus explaining the similar values obtained for both thuya wood and thuya burl.
To study the correlations between density and sample position within the disc, we performed a statistical analysis (general linear model) of the oven dry density values for thuya wood and burl. Three variables were studied in this analysis: the 2 sample position variables XL and XR,
along with the XLXR variable, representing the coupling between the 2 position variables.
Thuya wood and burl density is expressed as follows:
ε + + + + = K K L K R K L R K a b X c X d X X D0 (3)
Where K represents data relative to thuya burl B or wood W; aK, bK, cK, dK are linear
regression coefficients and ε is the error. The results of this analysis, presented in Table 2, provide estimated values, along with the P-value of the regression coefficients of equation (3). The results of this analysis show that, for thuya burl, there was no significant correlation between density and the XL,XR or XLXR coupling variables (P-value >5%). For thuya wood, on
the other hand, a dependency between the XR and XLXR variables was observed, corresponding
to the juvenile transition from pith to periphery (Dakak 2002). This was confirmed by a second regression analysis where bB=0 was assumed in equation (3).
Fracture energy in TL system
Figure 9 shows that the fracture energy changes increases on average with the increase in density both for thuya wood and thuya burl: the denser the material, the greater its resistance to crack propagation.
The results of this energy in TL system, for thuya burl, showed a high degree of variability, both in the longitudinal direction (figure 10a) and the transverse direction (figure 10b), in the tree's orientation. In addition to the influence of the fracture surface roughness (Morel et al.
2003), this result can be explained by the presence of outgrowths that increase rigidity on the
one hand and, on the other hand, impart a higher degree of heterogeneity to thuya burl. This fracture energy ranged from 325 to 1736 N/m (Table 3), with an average value of circa 830 N/m.
For thuya wood, fracture energy displayed lower variability than that observed for thuya burl in the studied directions. Indeed, this low variability can be explained by the organization of the wood's internal structure (radial, transverse and longitudinal material symmetry), with low intra-ring heterogeneity compared to other species (Dakak 2002, p.89). The lack of outgrowths renders the wood more homogeneous than thuya burl. In thuya wood, the fracture energy ranged from 89 to 435 N/m, with an average value of 192 N/m (Table 3).
These results enable us, on the one hand, to conclude that thuya burl is tougher than thuya wood in TL system. The comparison with data obtained on other species must be made with caution due to the importance of size effects and testing conditions. On Eucalyptus
camaldulensis Maziri et al. (2010) obtained a mean fracture energy of 325 N/m using similar
testing conditions. Baillères (1994) observed average values of 140 à 295 N/m, with large variations related to the radial position or the presence of tension wood, for various Eucalyptus clones tested with the same geometry but in the green state. Dourado et al. (2008) obtained values of 330 N/m for Maritime pine (Pinus pinaster Ait.) and 150 N/m for Norway spruce (Picea abies L.), but with specimens of larger dimensions. The only conclusion that can be drawn from this comparison is that the fracture energy of thuya wood is in the usual range of values observed on other hardwood species of similar density, while thuya burl is definitely tougher.
The results also show that the mean fracture energy for thuya burl decreased from bottom to top of the M1 disc, reaching at the top a value similar to that of thuya wood. This variation is closely linked to outgrowth concentration that decreases longitudinally, according to an observation made by El Mouridi et al. (2011) on scans of thuya burl bars. Indeed, the upper part of the thuya burl section possesses an intermediate structure, between thuya burl and wood. It is a transition zone between the inner structure "disrupted" by the outgrowths of thuya burl, and the more organized structure of thuya wood.
Fracture energy in RL system
The results obtained for the fracture energy test in RL system, conducted on thuya wood and burl, also show a high degree of variability of fracture energy in the longitudinal direction (figure 11a) and the R direction (figure 11b).
The energy values obtained show a decrease in the vertical direction of the studied disc. For the whole M2 thuya burl disc, the minimum fracture energy value was of 598.5 N/m, the maximum was of 4323.6 N/m and the mean was of 1743.6 N/m (Table 4). These high values can be related to the heterogeneity of the burl, due to concentration gradient and orientation of outgrowths presents in this particular type wood that resulted in a rough crack surface of higher effective area. Generally, crack growth was stable and its spread often took place in the expected plane with a small deviation. However, it seems that the orientation of the outgrowths is the major factor that influences the rupture of thuya burl.
The results obtained show that this energy is higher for the RL system, which may be explained by the fact that, in RL system, the fracture occurred in a plane perpendicular to the axial direction of the outgrowths. Moreover, during the tests, it was noted that the parts on either side of the cut did not separate perfectly. The two arms frequently remained joined by twisted filaments.
Furthermore, the results show a gradient of fracture energy in the XR direction. This can be
explained by the fact that, as we move away from the core of the burl, new outgrowths appear, thus their number increases from the center outwards and, consequently, the fracture energy transversal to outgrowths in RL system increases.
Comparison of burl fracture energies in TL and RL systems
The fracture energy measurements collected, in both the TL and RL systems on thuya burl wood, showed a high degree of variability, though with the same direction of longitudinal variation (decrease).
The fracture energy values were higher in the RL system. Nevertheless, it was noted that the area fractured in RL system was higher than in TL system, due in particular to the transverse orientation of the outgrowths, leading to a curved or even rippled fracture surface.
This result has a direct impact on the manner in which thuya wood is cut by craftsmen. Indeed, it is easier to cut thuya wood in the radial plane (TL system) than in the tangential plane (RL system). The aesthetic appearance is preserved in both modes.
CONCLUSION
During this study, we considered the fracture energy of thuya wood in the TL system, along with thuya burl in the TL and RL systems. The results obtained allow us to infer that:
- Thuya burl wood is tougher than thuya wood in TL system;
- Contrary to thuya wood, thuya burl displays a high degree of density and fracture energy variability, both in the transverse and longitudinal directions. This variability can be explained by the different outgrowth concentrations between the lower and upper parts of thuya burl. - Thuya burl is less tough in TL system than in RL system. This can be explained by the radial orientation of outgrowths from the center to the outside of the burl.
During the tests, it was noted that the parts on either side of the cut did not separate perfectly. The two arms frequently remained joined by twisted filaments.
ACKNOWLEDGMENTS
This work was supported by the CNRST (Morocco) - CNRS (France) project nb 22626/STIC03/10.
REFERENCES
Abbas Y, Ducousso M, Abourouh M, Azcon R & Duponnois R. 2006. Diversity of arbuscular
mycorrhizal fungi in Tetraclinis articulata (Vahl) Masters woodlands in Morocco. Annals of Forest Science 63: 285-291.
Baillères H. 1994. Précontraintes de croissance et propriétés mécano-physiques de clones
d’Eucalyptus (Pointe Noire - Congo): hétérogénéités, corrélations et interprétations histologiques. PhD Thesis in wood science, University Bordeaux 1, France.
Ballis E. 1992. Rapport sur l’étude de la filière thuya (Tetraclinis articulata), Institut Agronomique et Vétérinaire, Rabat, Maroc.
Benabid A. 1977. Etude sylvo-pastorale de la tétraclinaie de l’Amsittène (Maroc). Ecologie
Mediterranea 3: 125-132.
Boudy P. 1950. Economie forestière nord-africaine, Tome 2 : Monographie et traitement des essences forestières, Fasc. 2: Essences résineuses, Paris, Larose.
Chakir A. 1999. Contribution à l’étude de la consommation de bois d’œuvre de thuya par
la marqueterie dans la ville d’Essaouira. Mémoire de 3ème cycle, Ecole Nationale Forestière d’Ingénieurs, Salé, Maroc.
Dakak JE. 2002. La qualité du bois de Thuya de Maghreb (Tetraclinis articulata) et ses
conditions de développement sur ses principaux sites phytoécologiques de son bloc méridional au Maroc, PhD thesis, ENGREF Nancy, France.
Daudeville L. 1999. Fracture in spruce: experiment and numerical analysis by linear and non
linear fracture mechanics. Holz Roh Werkst;57:425–32.
Dourado N, Morel S, De Moura MFSF, Valentin G, Morais J. 2008. Comparison of fracture
properties of two wood species through cohesive crack simulations. Composites Part A
39:415–427.
El Mouridi M, Laurent T, Famiri A, Kabouchi B, Alméras T, Calchéra G, El Abid A, Ziani M, Gril J & Hakam A. 2011. Caractérisation Physique du Bois de la Loupe de Thuya
(Tetraclinisarticulata (Vahl) Masters). Physical and Chemical News 59: 57-64.
Fennane M, Barbero M & Quezel P. 1984. Le thuya de Bérbérieau Maroc : Aperçu
phytogéographique et écologique. Bulletin de l’Institut Scientifique, Rabat 8: 115-134.
Fennane M. 1987. Etude phytoécologique des tétraclinaires marocaines, PhD Thesis, Université de Droit, Economie et Science, Marseille, France.
Gustafsson PJ & Larsen HJ. 1990. The fracture energy of wood in tension perpendicular to
the grain. Result from a joint project. International council for building research studies and documentation, Meeting 23, Lisbonne, Portugal, 35p.
Lmouchter M. 2001. Etude des caractéristiques physiques et de séchage artificiel du bois de
thuya, Thèse de 3ème cycle, Ecole Nationale Forestière d’Ingénieurs, Salé, Maroc.
Maziri A, El Ghorba M, Chergui M, Famiri A, Ziani M, Kabouchi B. 2010. Etude des
contraintes de croissance chez l’Eucalyptus camaldulensis et leur relation avec les fentes d’abattage, Physical and Chemical News 53: 15-21.
Morel S, Mourot G, Schmittbuhl J. 2003. Influence of the specimen geometry on R-curve behavior and roughening of fracture surfaces. Int J Fract, 121:23–42.
Smith I, Landis E & Gong M. 2003. Fracture and fatigue in wood, John Wiley and sons Ltd, ISBN 0.471.48708.2.
Table 1 - Moisture content and density of thuya wood and burl (Dh, density at moisture
content H%; D0, oven dry density).
Minimum Maximum Mean 95% confidence interval
H(%) Thuya burl 4.45 14.98 12.2 0.4 Thuya 8.35 9.59 8.88 0.15 Dh Thuya burl 0.66 0.95 0.841 0.027 Thuya 0.78 0.95 0.835 0.018 D0 Thuya burl 0.62 0.90 0.791 0.028 Thuya 0.73 0.90 0.789 0.017
Table 2 - Estimate values and P-values of the regression coefficients between oven dry density and position within the disc.
Coefficient (Variable)
Thuya burl Thuya
Estimated value P-value (%) Estimated value P-value (%) Estimated value P-value (%) a 0.78 - 0.76 - 0.75 - b (XL) 0.00032 15.7 -0.00011 22.9 (0) - c (XR) 0.000052 92 0.0013 0.00003 0.00146 6.10-6 d (XLXR) -0.0000045 15.4 -0.0000035 0.36 -0.0000047 10-9
Table 3 - Minimum, maximum and mean values and 95% confidence interval of the mean fracture energy (in TL system) of thuya wood and burl.
Minimum Maximum Mean 95% confidence interval Gf,I (N/m)
(in TL system)
Thuya burl 325 1736 830 140
Thuya 89 435 192 27
Table 4 - Minimum, maximum and mean fracture energy values and coefficient of variation (in RL system) of thuya burl wood
Minimum Maximum Mean CV
Gf,I (N/m)
Figure captions
Figure 1 Cutting of thuya burl into discs and sample marking: (a) thuya burl; (b) central discs; (c) disc M1, planed and traced
Figure 2 Cross-section of thuya: (a) thuya wood; (b) thuya burl wood Figure 3 Marking of the centre of the thuya burl M1 disc samples Figure 4 Disc arm bonding: (a):gluing an arm; (b) clamping Figure 5 Specimen for fracture energy test
Figure 6 Fracture system notation (illustrated for wood) Experimental system Figure 7 Experimental system: (a) general view; (b) 3-points bending set-up Figure 8 Test curve (Force – displacement)
Figure 9 Relation between fracture energy and oven dry density
Figure 10 Fracture energy in TL system of thuya burl and thuya wood: (a) variation along L direction; (b) variation along R direction
Figure 11 Fracture energy of thuya burl in RL system: (a) variation along L direction; (b) variation along R direction
Figure 1 Cutting of thuya burl into discs and sample marking: (a) thuya burl; (b) central discs, (c) disc M1, planed and traced
Figure 1 - Cutting of thuya burl into discs and sample marking: (a) thuya burl; (b) central discs; (c) disc M1, planed and traced
Figure 2 - Cross-section of the material: (a) thuya wood; (b) thuya burl
(a) (b) 4 cm 4 cm L M1 M2 C o L R L T 30cm 25 cm (c) (a) (b)
Figure 3 Marking of the centre of the thuya burl M1 disc samples
(a) (b)
Figure 5 – Specimen for fracture energy test.
Figure 6 Fracture system notation (illustrated for wood)
Test piece
Test piece
20
m
m
12 mm
Test wood sample
140 mm
mm TL system RL system Sample cut in TL plane, propagation L Sample cut in RL plane, propagation LFigure 7 Experimental system: (a) general view; (b) 3-points bending set-up
Figure 9 Relation between fracture energy and oven dry density Gf,I = 2687.D0 -‐ 1295 Gf,I = 503.D0 -‐ 207
0
400
800
1200
1600
2000
0,60
0,70
0,80
0,90
1,00
Fr
ac
tu
re
e
ne
rg
y
G
f,I
(N
/m
)
Density D0 (g/cm3)
Thuya burl
Thuya wood
(a)
(b)
Figure 10 Fracture energy in TL system of thuya burl and thuya wood: (a) variation along L direction; (b) variation along R direction
Gf,I = -‐1,8.XL + 1085 Gf,I = -‐0,4.XL + 264
0
400
800
1200
1600
2000
0
100
200
300
400
Fr
ac
tu
re
e
ne
rg
y
G
f,I
(N
/m
)
XL (mm)
Thuya burl
Thuya wood
Gf,I = -‐1.2XR + 854
Gf,I = 0.43XR + 179
Fr
ac
tu
re
e
ne
rg
y
G
f,I
(
N
/m)
XR (mm)
Thuya burl
Thuya wood
(a)
(b)
Figure 11 Fracture energy of thuya burl in RL system: (a) variation along L direction; (b) variation along R direction
Gf,I = -‐7.9XL + 2682