Pépite | Caractérisation et déploiement d'un instrument FAGE pour l'étude des processus d'oxydation atmosphériques
228
0
0
Texte intégral
(2) Thèse de Mohamad Al Ajami, Université de Lille, 2018. 2 © 2018 Tous droits réservés.. lilliad.univ-lille.fr.
(3) Thèse de Mohamad Al Ajami, Université de Lille, 2018. To my beloved parents for their everlasting love and support…. 3 © 2018 Tous droits réservés.. lilliad.univ-lille.fr.
(4) Thèse de Mohamad Al Ajami, Université de Lille, 2018. Acknowledgments My thanks are first addressed to my PhD supervisors, Christa Fittschen and CoralieSchoemaecker for their guidance, advices, encouragements, and patience throughout my PhD, and for providing me the opportunity to be involved in exciting science in different places.I am extremely grateful for all you have taught me, it has been a pleasure working with you.I apologize if I have done anything that you did not like. I would also like to thank Laurefor her great sympathy, all her advice and encouragements. My sincere thanks to the various members of the jury for agreeing to evaluate this thesis work. Thank you, Valérie Gros, and Yoshizumi Kajii for invaluable time spent in reading my thesis and writing the report. Their remarks and comments added value to my manuscript. Thanks to the examinersSébastien Dusanter, and AlexandreKukuifor the exchanges we had during our meetings for different field campaigns and at the defense. I would like to sincerely acknowledge Pr. Yoshizumi Kajii from the Atmospheric Chemistry, Department of Natural Resources, in Kyoto University for his great hospitality during my visit to his laboratory in Japan and for the good times that we spent together. I thank Laurent Gasnot, laboratory director of PC2A, for his hospitality as well as all the administrative and technical staff who allowed me to work in very good conditions. In particular, I would like to thank Sébastienand Christophe for their technical help, availability, advice and numerous interventions, and without which the manipulation would not have worked as well. Many thanks to the scientists and engineersthat I met in different field campaigns where I was participated, I lookforward to meeting them again in the future. I owe my sincere thanks to Marion Blocquet and Emmanuel Assaf for their everlasting help and support throughout my stay. I would like to thank all the people who have made this thesis successful and have made it possible for me to evolve in a very healthy and friendly working atmosphere. Many thanks my office mates, past and present, for their friendship, advice, andfor providing welcome distractions. My thoughts go first to Emmanuel, Florent, Elaine, Sonia, Dorra, Nicolas, and Patrice. Thank you for all our good times together in the laboratory and outside in different activities. I would continue with all the other people of the laboratory, Jinan, Nabil, Lucia, Ahmad, Lisa, Junteng.To all those I forget, the following white page is dedicated to you. 4 © 2018 Tous droits réservés.. lilliad.univ-lille.fr.
(5) Thèse de Mohamad Al Ajami, Université de Lille, 2018. Thanks to all my friends, Elias, Salim, Mario, Grace, Mohamad nour, Ahmad, Sandy and Jalal for their support and encouragement. On a more personal level, I obviously owe this success to my parents who have dedicated their whole lives to the education and well-being of their sons.I am very grateful to my family for their constant encouragement and support. Finally, my father’s dream comes true. Thank you again…. 5 © 2018 Tous droits réservés.. lilliad.univ-lille.fr.
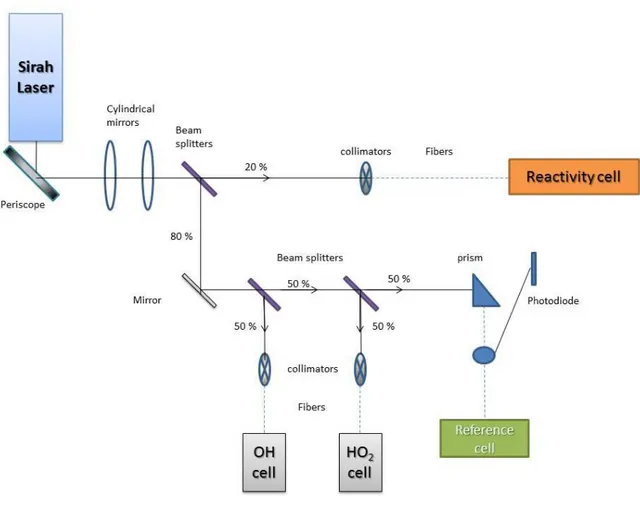
(6) Thèse de Mohamad Al Ajami, Université de Lille, 2018. Abstract The hydroxyl radical, OH, the hydroperoxyl radical HO2 (known collectively as HOx) and peroxy radicals RO2, play a key role in the tropospheric chemistry and are intricately related to the chemical cycles that control the concentration of greenhouse gases such as methane and have important implications for air quality through VOC oxidation and ozone formation. Accurate quantification of these three important radicals and investigations on the chemical mechanisms that control their formation and removal through comparisons between measured and modeled concentrationsare needed to develop a better understanding of the atmospheric chemistry mechanisms. Different types of instruments have been developed and deployed to quantify HOx radicals in the field. One has been developed over the last few years in our group based on the most deployed technique: the FAGE (Fluorescence Assay by Gas Expansion). This technique represents direct measurement of OH and indirect measurement of HO2 radicals by chemical conversion to OH after addition of NO. However, some RO2 radicals can also be converted to OH by a similar radical reaction sequence as HO2, so that they are potential interferences for HO2 measurements. For UL-FAGE, the conversion efficiency of various RO2 species to HO2 has been investigated and it has been shown that variation of NO allows to selectively detect HO2 and double bound RO2.With similar FAGE instruments, field campaigns have been carried out in remote biogenic environments (dominated by isoprene emission) in the last decade. They have highlighted unidentified interferences in these measurements. In our laboratory, we used our FAGE instrument in controlled conditions to investigate the origin of the interference and we have shown that ROOOH (trioxides), product of radical-radical reactions in the atmosphere may be responsible. PC2A calibration cell was intercompared to other calibrators (IMT-Douai and LPC2E) of similar design over wide range of conditions. One goal of the intercomparison was to evaluate each other’s calibration and to make sure that they had no significant biases. The results showed a good agreement between the three calibration cells for HOx and RO2 radicals. Finally, the UL-FAGE in both configurations (quantification and reactivity) was deployed to a field measurement (LANDEX) in forest environment. Part of the campaign was conducted to an intercomparison between LP-FAGE and LSCE-CRM instruments. Measured reactivity showed very good agreement between both techniques. Keywords: Atmospheric chemistry, HO x radicals, Peroxy radicals, FAGE instrument, Laser. Induced. Fluorescence,. Field. campaigns,. interference,. calibration 6. © 2018 Tous droits réservés.. lilliad.univ-lille.fr.
(7) Thèse de Mohamad Al Ajami, Université de Lille, 2018. 7 © 2018 Tous droits réservés.. lilliad.univ-lille.fr.
(8) Thèse de Mohamad Al Ajami, Université de Lille, 2018. Table of contents Abstract ................................................................................................................................................... 3 Context and objectives of the thesis ..................................................................................................... 13 Chapter I: The tropospheric chemistry of OH and HO2 radicals .................................................. 17. I. I.1. Introduction........................................................................................................................... 18. I.1.1. The Atmosphere ............................................................................................................ 18. I.1.2. Regions and characteristics of the atmosphere ............................................................ 18. I.1.2.1. The Troposphere ....................................................................................................... 19. I.1.2.2. The Stratosphere ....................................................................................................... 20. I.1.2.3. The Mesosphere ........................................................................................................ 21. I.1.2.4. The Thermosphere .................................................................................................... 21. I.1.2.5. The Exosphere ........................................................................................................... 21. I.1.3 I.2. Chemical composition of the troposphere.................................................................... 22 Interest of the atmospheric measurements and motivations .............................................. 24 Chemistry of HOx radicals in the atmosphere ............................................................... 25. I.2.1 I.2.1.1. OH radical .................................................................................................................. 25. I.2.1.2. HO2 radical ................................................................................................................. 27. I.2.1.3. RO2 radicals................................................................................................................ 28. I.2.2. Determinants of HOx radicals concentration in the atmosphere.................................. 29. I.2.3. OH reactivity in the atmosphere ................................................................................... 31 Review of the techniques for the quantification of HOx and ROx radicals in the atmosphere 33. I.3 I.3.1. Techniques for HOx and ROx quantification .................................................................. 33. I.3.1.1. OH detection ............................................................................................................. 34. I.3.1.2. HO2 and RO2 detection .............................................................................................. 39. I.3.2. Potential interferences with HOx measurements ......................................................... 45. I.3.2.1. Interferences on OH measurement........................................................................... 45. I.3.2.2. Interference on the quantification of HO2 ................................................................ 48. I.3.3 I.4. HOx measurements in field campaigns ......................................................................... 49 Techniques for OH reactivity measurement ......................................................................... 50. I.4.1. Flow tube-LIF (FT-LIF) .................................................................................................... 51. I.4.2. Laser photolysis –LIF (LP-LIF) ......................................................................................... 51. I.4.3. Flow tube – CIMS (FT-CIMS) .......................................................................................... 52. I.4.4. CRM (Comparative Reactivity Method) ........................................................................ 52 8. © 2018 Tous droits réservés.. lilliad.univ-lille.fr.
(9) Thèse de Mohamad Al Ajami, Université de Lille, 2018. I.4.5. OH reactivity measurements in field campaigns and modeling.................................... 55. I.4.6. Intercomparison campaigns for reactivity measurements ........................................... 59. I.5. Conclusion ............................................................................................................................. 60. Chapter II: Materials and Methods .............................................................................................. 63. II. II.1. Introduction........................................................................................................................... 64. II.2 Experimental description of the UL-FAGE (University of Lille - Fluorescence Assay by Gas Expansion) for HOx quantification .................................................................................................... 65 II.2.1. The laser system ............................................................................................................ 65. II.2.2. Probing system .............................................................................................................. 67. II.2.2.1. Sampling .................................................................................................................... 68. II.2.2.2. Preinjector ................................................................................................................. 68. II.2.3. The detection cells......................................................................................................... 72. II.2.3.1. OH and HO2 cells........................................................................................................ 73. II.2.3.2. The OH fluorescence collection system .................................................................... 73. II.2.4. The reference cell .......................................................................................................... 75. II.2.5. Data acquisition ............................................................................................................. 77. II.2.6. Use of the quantification configuration during the thesis ............................................ 78. II.3. Calibration of the FAGE Instrument in the quantification configuration .............................. 78. II.3.1. Generation of OH and HO2 radicals in the calibration cell ............................................ 79. II.3.2. Calibration cell configuration and calibration procedure ............................................. 80. II.3.3. Calibration uncertainty.................................................................................................. 83. II.3.4. Improvement of the calibration cell during the thesis.................................................. 84. II.4. II.3.4.1. Lamp flux reduction................................................................................................... 85. II.3.4.2. Use of a photodiode .................................................................................................. 85. II.3.4.3. Use of the calibration cell for the RO2 generation .................................................... 87. OH reactivity configuration ................................................................................................... 88. II.4.1. Experimental setup ....................................................................................................... 88. II.4.2. The photolysis laser ....................................................................................................... 89. II.4.3. Photolysis cell and gas distribution ............................................................................... 91. II.4.4. Decay analysis and validation of the reactivity measurement...................................... 92. II.4.5. Uses of the reactivity configuration during the thesis .................................................. 94. II.5. Conclusion ............................................................................................................................. 94. III Chapter III: Kinetic analysis of the role of ROOOH as interference for OH quantification by FAGE ...................................................................................................................................................... 96 III.1. State of the art concerning OH interferences in FAGE instruments ..................................... 97 9. © 2018 Tous droits réservés.. lilliad.univ-lille.fr.
(10) Thèse de Mohamad Al Ajami, Université de Lille, 2018. III.2. Experimental setup ............................................................................................................. 103. III.2.1. Pump and Probe FAGE (or LP-LIF) ............................................................................... 103. III.2.2. LIF Calibration procedure ............................................................................................ 104. III.2.3. Experimental conditions.............................................................................................. 104. III.3. Results and discussions ....................................................................................................... 105. III.3.1. III.3.1.1. Modeling the chemistry in the photolysis cell .................................................... 105. III.3.1.2. Experimental results in conditions favorable to the reaction of RO2+OH........... 107. III.3.1.3. Conditions unfavorable to the reaction of RO2+OH ............................................ 108. III.3.2. Is the interference a 1- or 2-photon process?............................................................. 110. III.3.2.1. Study of a known 2 photon process with acetone .............................................. 110. III.3.2.2. Test with isoprene ............................................................................................... 111. III.3.3. III.4. Tests with isoprene ..................................................................................................... 105. Is the interference due to ROOOH ? ........................................................................... 113. III.3.3.1. Test with n-butane (high ROOOH yield) .............................................................. 113. III.3.3.2. Test with CH4 (low ROOOH yield) ........................................................................ 114. Global modeling .................................................................................................................. 116. III.4.1. Modeling methodology ............................................................................................... 116. III.4.2. Global modeling results............................................................................................... 119. III.5. Conclusion ........................................................................................................................... 120. IV Chapter IV: characterization of UL FAGE and different calibration cells for HOx and RO2 measurements .................................................................................................................................... 123 IV.1. Introduction......................................................................................................................... 124. IV.2. Calibration methods used for HOx and RO2 quantification ................................................. 125. IV.2.1. UL-FAGE calibration cell .............................................................................................. 127. IV.2.2. IMT Lille Douai calibration cell .................................................................................... 128. IV.2.3. LPC2E calibration cell................................................................................................... 128. IV.2.4. Summary of the calibrations cells and conditions used for the intercomparison ...... 129. IV.3. Characterization of the calibration cells on the UL-FAGE for HOx measurements ............. 130. IV.3.1. Characterization of the PC2A calibration cell for wall losses and water effect .......... 131. IV.3.1.1. Radical losses in the calibration cell .................................................................... 131. IV.3.1.2. Effect of water vapor concentration on HOx calibration ..................................... 133. IV.3.2. LPC2E calibration cell on the UL-FAGE ........................................................................ 135. IV.3.2.1. FAGE response as a function of the lamp flux at constant humidity .................. 135. IV.3.2.2. FAGE response as a function of the calibration cell flow at constant lamp flux . 136. 10 © 2018 Tous droits réservés.. lilliad.univ-lille.fr.
(11) Thèse de Mohamad Al Ajami, Université de Lille, 2018. IV.3.2.3 IV.3.3. IMT Lille Douai calibration cell on the UL-FAGE .......................................................... 140. IV.3.3.1. Determination of the wall losses......................................................................... 140. IV.3.3.2. FAGE response as a function of the calibration cell lamp flux ............................ 142. IV.3.3.3. FAGE response as a function of the calibration cell humidity............................. 145. IV.3.4 IV.4. FAGE response as a function of the humidity in the calibration cell .................. 138. Summary of the results on the HOx measurements.................................................... 147. Characterisation of the UL-FAGE for RO2 conversion.......................................................... 148. IV.4.1. State of the Art ............................................................................................................ 148. IV.4.2. Protocol to generate and study the RO2 interference ................................................ 150. IV.4.3. Preliminarily tests with CO and methanol................................................................... 152. IV.4.4. Characterization of the RO2 interference in the UL-FAGE with our calibration cell ... 157. IV.4.5. Characterization of the different calibration cells with the UL-FAGE for RO2 generation 162. IV.5. Conclusion ........................................................................................................................... 165. Chapter V: LANDEX campaign .................................................................................................... 169. V. V.1. Introduction......................................................................................................................... 170. V.2. Context of the study ............................................................................................................ 171. V.2.1. Role of forests in the atmosphere ............................................................................... 171. V.2.2. Specificities of the Landes forest – learns from LANDEX 0 ......................................... 173. V.3. Field site description ........................................................................................................... 175. V.4. Sampling and instrumentation ............................................................................................ 176. V.4.1. HOx measurements...................................................................................................... 177. V.4.2. Total OH reactivity measurements.............................................................................. 178. V.4.2.1. Pump probe-FAGE technique .................................................................................. 178. V.4.2.2. Comparative Reactivity Method (CRM) .................................................................. 180. V.4.3. V.5. Other gas species quantification ................................................................................. 182. V.4.3.1. Proton Transfer Reaction-Mass Spectrometry ........................................................ 182. V.4.3.2. Gas chromatography ............................................................................................... 183. Results ................................................................................................................................. 184. V.5.1. OH radical detection.................................................................................................... 184. V.5.2. OH interference ........................................................................................................... 186. V.5.3. HO2 and RO2 detection ................................................................................................ 188. V.5.4. Total OH reactivity ....................................................................................................... 191. V.5.4.1. Overview of the results obtained ............................................................................ 192. 11 © 2018 Tous droits réservés.. lilliad.univ-lille.fr.
(12) Thèse de Mohamad Al Ajami, Université de Lille, 2018. V.5.4.2. Intercomparison of CRM and UL-FAGE measurements at the same location ........ 194. V.5.4.3 Comparison of CRM and UL-FAGE measurements at the same height but different horizontal locations ................................................................................................................. 196 V.5.4.4 V.5.5. V.6. Comparison of CRM and UL-FAGE measurements at different heights ................. 198 Missing reactivity......................................................................................................... 199. V.5.5.1. Trace gases considered for the calculated reactivity .............................................. 199. V.5.5.2. Comparison between the measured and calculated reactivity .............................. 205. Conclusion ........................................................................................................................... 209. Bibliography......................................................................................................................................... 211 General conclusion .............................................................................................................................. 225. 12 © 2018 Tous droits réservés.. lilliad.univ-lille.fr.
(13) Thèse de Mohamad Al Ajami, Université de Lille, 2018. Context and objectives of the thesis The study of the atmosphericcomposition and its evolution is crucial as it has a direct impact on our health(particles and dangerous gaseous species with potential cancerogenic effect, respiratory diseases) and the climate (greenhouse gases). The atmospheric composition is driven by biogenic and anthropogenic emissions and their transformation due to physical and chemical processes. Within the major species involved in oxidation processes in the atmosphere are the hydroxyl radical, OH, and the hydroperoxyl radical, HO2 (known collectively as HOx). They play a key role in tropospheric chemistry and are intricately related to chemical cycles that control the concentration of greenhouse gases and the formation of tropospheric ozone, and acid rainwith important implications for air quality and ecosystems. Hydroxyl radicals initiate the hydrocarbons degradation and are linked to the hydroperoxyl radical, HO2, through a series of oxidation steps leading to the formation of different peroxy radicals (RO2, R being a hydrocarbon group) as a function of the hydrocarbons present in the local air mass.As the composition of different air masses can vary a lot from one environment to another one (forest, urban, marine,…) and because of the multiplicity of species present, accurate measurements of these radicals are needed forinvestigating the oxidationmechanisms that control their formation and removal. Comparison between measured and modeled profilesallow to develop more representative atmospheric chemistry mechanisms and a better understanding of atmosphere. Different types of instruments have been developed and deployed to measure these radicals in the field. Although HOxand RO2quantification provides important information about theatmospheric chemistry, to access to a better description of the radical balance, another parameter is particularly interesting to measure: the reactivity of the OH radical. OH reactivity is defined as the first order loss rate of the hydroxyl radical and provides information about the budget of all species reacting with OH present in the atmosphere. Recent instruments have been developed to measure OH reactivitywhich can then be compared to a calculated reactivity obtained from the concentrations of species reacting with OH,simultaneously measured at the same location. Any discrepancy between measured and calculated OH reactivity (called missing reactivity) represents OH sinks that have not been characterized by trace gas measurements and indicates that important unmeasured reactive species are present. The development of the different instruments used to quantify the radicals or the OH reactivity is very challenging due to the low concentration of the species and to the complex composition of the 13 © 2018 Tous droits réservés.. lilliad.univ-lille.fr.
(14) Thèse de Mohamad Al Ajami, Université de Lille, 2018. atmosphere. This is why it is necessary to check that the measurements are not subjected to potential interferences due to the presence of other species in the atmosphere and if present a particular attention should be taken to characterize well these interferences and to reduce them. In the last few years, interferences have been identified on OH and HO2 measurements. In this context, this thesis concentrates on the continued development of a dedicated HOx radical detection instrument, based on laser induced fluorescence spectroscopy at low pressure (fluorescence assay by gas expansion (FAGEinstrument of the PC2A called the UL-FAGE)). The aims of my thesis were focused on the improvement of the reliability of the measurements with the UL-FAGE instrument and on its deployment for a better understanding of biogenic environments.It includes: -. a better characterization of the origin of interferences in ambient measurements of OH and HO2, and the identification of the interference on the OH measurement,. -. the improvement of the instrument to limit the interferences,. -. the study of the possibility of measuring RO2 radicals. -. a better characterization of the calibration of the FAGE instrument which can be source of error in measurementsother than interferences,. -. the deployment of UL-FAGE in the field forradical quantification and OH reactivity measurement in order to better characterize the oxidation processes in a forest where nocturnal particle formation has been observed.. The present thesis consists of six chapters.The first chapter describes the atmosphere and in particular the region of interest for my work:the troposphere, the atmospheric chemistry of the troposphere involving HOx radicals and the instruments available for the characterization of these key radicals as well as their potential interferences. The second chapter provides a detailed description of the instruments used in this thesis: -. the FAGE instrument in the quantification mode measuring OH and HO2radicals, the improved calibration cell and the preinjector system installed to allow a selective measurement of OH,. -. the FAGE in the OH reactivity mode also called pump - probe FAGE.. The third chapter presents the kinetic studies of RO2 + OH to highlight the interference of products formed by these reactions on the OH measurement in the FAGE. These findings could explain the discrepancies between measured and calculated OH concentrations that have been seen in different field campaignsin biogenic environment with low NO concentrations. 14 © 2018 Tous droits réservés.. lilliad.univ-lille.fr.
(15) Thèse de Mohamad Al Ajami, Université de Lille, 2018. The first part of chapter four presents the characterization of the FAGE cells concerning the wall loses, the humidity,the interferences of different peroxy radicals (RO2) on the HO2 measurement in the UL-FAGE instrument. Conversion efficiencies of different peroxy radicals are presented.The second part of chapter IV presents the results of an intercomparison between different calibration cells for different instruments measuring HOx and/or RO2radicals (FAGE forPC2A, PERCA for IMT-Lille Douai, and CIMS for LPC2E). Results show the reliability of UL-calibration system with Mines Douai and LPC2E calibration systems. Finally, chapter five presents the results of the deployment of the UL-FAGE during the LANDEX field campaign that was conducted in July 2017 in a pinus forest near Bordeaux in the south of France, where HOxconcentrations and OH reactivity were measured. This campaign involved different groups to characterize the environmental conditions (wind, temperature, solar radiation), the plant emissions, the ambient gas phase (VOCs, ozone, NOx, NO3, HOx, OH reactivity)and the particles (granulometry, composition) and to better understand the formation of particles in such environment. As two instruments to measure the OH reactivity were presents, this chapter presents results of the intercomparison that have been done between the pump-probe UL-FAGE and the CRM instrument of LSCE.. 15 © 2018 Tous droits réservés.. lilliad.univ-lille.fr.
(16) Thèse de Mohamad Al Ajami, Université de Lille, 2018. 16 © 2018 Tous droits réservés.. lilliad.univ-lille.fr.
(17) Thèse de Mohamad Al Ajami, Université de Lille, 2018. I Chapter I: The tropospheric chemistry of OH and HO2 radicals. 17 © 2018 Tous droits réservés.. lilliad.univ-lille.fr.
(18) Thèse de Mohamad Al Ajami, Université de Lille, 2018. I.1. Introduction. I.1.1. The Atmosphere. The Planet Earth is surrounded by a layer of solid, liquid and mainly gas constituents called the atmosphere. This layer of gas, known as air, is retained by Earth gravity. The word atmosphere was introduced into the western languages in the 17th century and comes from the Greek ‘’atmos’’ meaning vapor and ‘’sphaira’’ meaning ball.The atmosphere plays an essential role in the protection of the life on the Earth.It absorbs short ultraviolet (UV) radiation which alters the DNA and the Infrared (IR) radiation reemitted by the Earth surface,and thus maintains temperatures favorable to life(greenhouse effect) and reducestemperature variationbetween day and night.It is considered that the atmosphere extends up to an altitude of more than 800 km (Seinfeld and Pandis, 2016). The atmosphere is generally described in layers as a function of different parameters such as the pressure, chemical composition, andtemperature or the electromagnetic properties.. I.1.2. Regions and characteristics of the atmosphere. The atmosphere is generally divided into several regions depending on the chemical composition, pressure, and mainly on the vertical temperature profile.Based on the evolution of the vertical temperature, the atmospheric regions, as shown inFigure I- 1, are namely the troposphere, stratosphere, mesosphere, thermosphere and a further region at about 500 km above the Earth'ssurface, called the exosphere(Finlayson-Pitts and Pitts Jr, 1999). Temperature shows a complex dependence on altitude linked to the chemical composition of the atmosphere and the capacity of the different molecules to absorb sunlight.The inversionpoints of the temperature gradient mark the boundaries between regions of the atmosphere (Finlayson-Pitts and Pitts Jr, 1999; Seinfeld and Pandis, 2016).. 18 © 2018 Tous droits réservés.. lilliad.univ-lille.fr.
(19) Thèse de Mohamad Al Ajami, Université de Lille, 2018. Figure I- 1: the temperature profile and layers of the atmosphere(Barker, 1995). The different layers of the atmosphere are described in more details in the followings paragraphs. I.1.2.1. The Troposphere. This is the lowest part of the atmosphere. It is the region where we live and the day to day phenomena associated with the weather take place (clouds, rain, snow...). The word troposphere originates from 2 Greece words (tropos) which means turning or mixing and (sphaira) meaningball. The troposphere ranges from 0 to 15 km and is divided into two parts depending on the latitude (Finlayson-Pitts and Pitts Jr, 1999; Wayne, 2000): a small layer above the surface which is called the planetary boundary layer (PBL) and the free troposphere (FT). PBLis the air layer near theground affected by diurnal heat, moisture etc. The depth of the boundary layer varies depending on the location. Approximately it was found that the boundary-layer depth is between 0.5 and 2 km(Vogelezang and Holtslag, 1996). This is the region of the atmosphere which is directly affected by 19 © 2018 Tous droits réservés.. lilliad.univ-lille.fr.
(20) Thèse de Mohamad Al Ajami, Université de Lille, 2018. the earth surface emissions and surface temperature. PBL hasan essential influence on the chemical composition of the atmosphere as the majority of the trace gases are emitted from the earth surface(Finlayson-Pitts and Pitts Jr, 1999). In the troposphere, the temperature gets colder as the distance above the earth increases, by about 6.5°C per kilometer which is termed as environmental lapse rate (ELR). This temperature profile in the troposphere arises from the heating of the surface by the solar radiation. The absorbed radiation is re-emitted to the atmosphere, warming it close to the surface. As a result, the heated air masses above the earth’s surface arise vertically due to convection. Cooling and adiabatic expansion of the air takes place as it is going up resulting in a vertical mixing. This mixing allows the transportation of the species from the surface to the free troposphere in several days depending on the weather conditions in the troposphere and the chemical stability of the species.The troposphere is a region of continuous turbulence and mixing, and it is where most of the chemical and physical processes take place (Finlayson-Pitts and Pitts Jr, 1999).The boundary layer between the troposphere and the stratosphere where the temperature profile changes from a decreasingtrendto an increasingone is called the tropopause. I.1.2.2. The Stratosphere. The stratosphere extends upwards from the tropopause to about 50 km. It fulfills the conditions (composition, pressure, sunlight wavelengths) for the formation of the ozone layer. It contains much of the ozone present inthe atmosphere. The increase in temperature with height occurs because of absorption of ultraviolet (UV) radiation in a series of exothermic reactions involved in the formation cycle of the stratospheric ozone. Temperatures in the stratosphere are highest over the summer pole, and lowest over the winter pole. The ozone formation and destruction reactions are known under the ”Chapman cycle”(Barker, 1995). O + hϑ(< 240 O∙ + O → O. O∙ + O → 2O. O + hϑ (< 320. ) → 2O∙. R I- 1 R I- 2 R I- 3. ) → O∙ + O. R I- 4. As a result, less and less UV radiation passes through the stratosphere creating different temperature layers. This brings the name stratosphere because a stratification of the temperature occurs. In the stratosphere, the vertical mixing is weak compared to the horizontal mixing because of the lack of convection (Finlayson-Pitts and Jr, 1999; Finlayson-Pitts and Pitts Jr, 1999; Seinfeld and Pandis, 20 © 2018 Tous droits réservés.. lilliad.univ-lille.fr.
(21) Thèse de Mohamad Al Ajami, Université de Lille, 2018. 2016).Since ozone absorbs most of the solar light with wavelengths lower than 320 nm, it makes the stratospheric ozone an indispensable factor for the life on earth (Finlayson-Pitts and Pitts, 2000) by absorbing dangerous UV radiation (range 200-300 nm) destructing the DNA. However, chemicals (called CFCs or freons, and halons) which were used until the 90's for example in refrigerators, spray cans andfire extinguishershave reduced the amount of ozone in the stratosphere, leading to the socalled "Antarctic ozone hole".The stop of their use has ledalready to the gradual recovering of the ozone. At the top of the stratosphere, a boundary layer called stratopause separates the stratosphere from the mesosphere. The temperature atthis level is about 270 K at a height of about 50 to 55 Km above the surface. I.1.2.3. The Mesosphere. The region above the stratosphere is called the mesosphere (middle of the atmosphere), it extends from the stratopause up to 80-85 Km. In this region, the temperature again decreases with increasing altitude, reaching a minimum of about -90°C at the mesopause. In the mesosphere, heating due to light absorption is less important than in the stratosphere due to the decrease in the concentration of oxygen and thus ozone. Subsequently, the temperature falls again with altitude and the vertical mixing within this region occurs. The mesopause is the layer which separates the mesosphere from the thermosphere, and it is the coldest region in the atmosphere. I.1.2.4. The Thermosphere. The thermosphere lies above the mesopause, at an altitude of approximately 80 Km. The thermosphere is a region in which temperature again increases with altitude. Even if the density is less than in the mesosphere, in the thermosphere the molecules receive high amounts of energy from the Sun, at short wavelengths. This leads to a temperature increase, caused by the absorption of energetic ultraviolet and X-Ray radiation (λ < 200) from the Sun (Finlayson-Pitts and Jr, 1999; Finlayson-Pitts and Pitts Jr, 1999) by O,. O2 and N2, filtering the atmosphere of these wavelengths. I.1.2.5. The Exosphere. Itis the upper part of the atmosphere, based on electromagnetic properties. It extends from about 550 Km tothousands of kilometers. It contains mainly oxygen and hydrogen atoms, but there are so few of them that they rarely collide - they follow "ballistic" trajectories under the influence of gravity, 21 © 2018 Tous droits réservés.. lilliad.univ-lille.fr.
(22) Thèse de Mohamad Al Ajami, Université de Lille, 2018. and some of them escape right out into space. This is the area where satellites orbit the earth.My PhD thesis work is focused on the chemistry of the troposphere and its chemical composition is described in more detail in the next paragraph. I.1.3. Chemical composition of the troposphere. The troposphere is the layer where most of the air is concentrated, in particular in the planetary boundary layer (PBL)and where most of the chemical transformations take place. The air consists of 2major constituents which are nitrogen N2(78% by volume), andoxygenO2(21% by volume) molecules. The remaining 1% of theatmospheric gasesis known as trace gases because they are present in small concentrations. The concentration of these gases is generally expressed in mixing ratio (ratio of the number of molecules of the trace gas to the total number of molecule in the same volume) in part per million (10-6) by volume (ppmv), per billion (ppbv, 10-9) or per trillion (pptv , 1012. ). The most abundant of the trace gases is the noble gas argon (approximately 1% by volume).. Noble gases, which also include neon, helium, krypton and xenon, are inert and do not take part inany chemical transformation within the atmosphere. In addition, other trace gasesas CO, CO2, CH4 and volatile organic compounds (VOC), nitrogen species as NO, NO2, N2O, NH3and peroxyacylnitrates (PANs), sulphur containing species as SO2, dimethylsulphine (DMS) and H2S, ozone, and halogenated compounds as hydrochlorofluorocarbons(HFCs), hydrochlorofluorocarbons(HCFCs), HCl, HF, CH3Cl, CH3Br and CH3I are present(Seinfeld and Pandis, 2016).In addition, there is a variable concentration of water vapor ranging from less than 1% to 4% (Wayne, 2000). Water vapor concentration can be represented by therelative humidity(abbreviated RH) which is the ratio of thepartial pressureof water vapor (Pwater) to theequilibrium vapor pressureof water at the given temperature (Ps). The equilibrium vapor pressure decreases with decreasing temperature and depends only on the temperature.RH will change in the atmosphere as a function of the local composition of the air mass (varying Pwater) and the temperature (varying PS). Natural processes which produce trace gases include emissions from trees and plants, volcanic eruptions, natural fires, thunderstorms and biological processes.Anthropogenic origin related to the human activities such as agriculture, transport, industries and household activities are also a source of trace species.Despite their relative scarcity, the role of trace species is crucial in the atmosphere. Carbon dioxide, methane, nitrous oxide,water vaporand ozone are called greenhouse gases. Their name comes from their capacity to warm the atmosphere. Apart from water vapor, the most abundant greenhouse gas (by volume) is carbon dioxide.. 22 © 2018 Tous droits réservés.. lilliad.univ-lille.fr.
(23) Thèse de Mohamad Al Ajami, Université de Lille, 2018. Organic compounds are another type of trace species emitted in the atmosphere through natural and anthropogenic activities. In this way, VOCs are regarded as biogenic VOCs (BVOCs) and anthropogenic VOCs (AVOCs). There is also another important class of VOCs, called oxygenated VOCs (OVOCs), which includes compounds having at least an oxygen atom in their structure, both from natural and anthropogenic origin, or generated from oxidation reactions occurring in the atmosphere, hence secondary products. Natural activities are responsible of the emission of the largest majority of VOCs (90%). However, even if minor, anthropogenic emissions increase drastically since the 1900’s with an impact on radiative processes and air quality by controlling the formation of tropospheric ozone and secondary organic aerosols in different environments. Unstable reactive species like ions, atoms and radicals are also present in very small concentrations (ppt level or below).Some of these radicals have an essential effect on the chemical composition and the chemistry of the atmosphere like hydroxyl radicals (OH), hydroperoxyl radicals (HO2)and peroxy radicals (RO2, R being an hydrocarbon group) (Finlayson-Pitts and Jr, 1999).They are involved in most of the gas phase oxidation processes during the day, whereas NO3 radicalsplay a similar role than OH during the night.The concentrationranges of several species present in the atmosphere are listed inTable I- 1.These are typical ranges of atmospheric mixing ratios but they are not representative for every place in the world (for example, remote environments have often NMHC below 5 ppbv). Table I- 1:Fraction of volume of air occupied by different species at 1 atm in the troposphere (Wallace and Hobbs, 2006). Gas Nitrogen Oxygen Argon Carbon dioxide Neon Helium Methane Hydrogen Nitrous oxide Carbon monoxide Ozone Nonmethane hydrocarbons Halocarbons Hydrogen peroxide Formaldehyde Nitrogen species Ammonia Sulfur dioxide Dimethyl sulfide (DMS) Hydrogen sulfide Carbon disulfide. Chemical formula N2 O2 Ar CO2 Ne He CH4 H2 N 2O CO O3 H2O2 HCHO NOX , N2O5 , HNO3 NH3 SO2 CH3SCH3 H2 S CS2. Fraction of volume of air occupied by the species 78.084% 20.946% 0.934% 379 ppmv 18.18 ppmv 5.24 ppmv 1.7 ppmv 0.56 ppmv 0.31 ppmv 40-200 ppbv 10-100 ppbv 5-20 ppbv 3.8 ppbv 0.1-10 ppbv 0.1-1 ppbv 10 pptv - 1 ppmv 10 pptv - 1 ppbv 10 pptv - 1 ppbv 10-100 pptv 5-500 pptv 1-300 pptv. 23 © 2018 Tous droits réservés.. lilliad.univ-lille.fr.
(24) Thèse de Mohamad Al Ajami, Université de Lille, 2018. Hydroxyl radicals Hydroperoxy radicals. HO HO2. 0 – 0.4 pptv 0 – 5 pptv. Smallsolid and/or liquid particles are present in suspension in the atmosphere and are called atmospheric aerosols (excluding cloud particles). These particles range in size from a few nanometers to millimeters (Finlayson-Pitts and Pitts Jr, 1999). Atmospheric aerosols can be either primarily emitted to the atmosphere or secondarily formed during the transformation of chemical species in the atmosphere. Typically, primary aerosols are dust, sea salt, volcanic ashes or soot. Sulphuric acid, sulphates, nitrates, organic matter and biogenic VOCs are the typical precursors for secondary aerosols (Finlayson-Pitts and Pitts Jr, 1999; Wayne, 2000). The different species present in the troposphere can interact through physical and chemical processes which influence its composition, with impact on air quality, health and climate change. The main motivations and strategies to study the chemical transformations in the troposphere are described in the following paragraph.. I.2. Interest of the atmospheric measurements and motivations. Due to direct impact of the atmosphere composition on our healthand onthe climate,pressure is being put on governments to act and control the rise in greenhouse gases and pollutants. They determine policy changes to limitthe climate change and improve the air quality based on the results ofcomplex models that aim to predict pollutant levels and the future of our climate. These models are based on the description of the physical and chemical processes taking place in our atmosphere.In order to develop, test and improve these models, observations of atmospheric constituents and laboratory studies,investigatingthe understanding of the chemical processes, are needed. For example, the atmospheric lifetimes of certain greenhouse gases, particularly methane, are controlled by the chemical oxidation. Oxidationprocesses can enhance the production of much more toxic gases and particulate matter than the primary emitted species, and participate to the chemical aging of particles, modifying their properties. All these processes impact the atmospheric composition and the change in our climate with consequences for natural resource sectors, such as agriculture, forestry, ecosystems, water resources, and fisheries and on other human activities. It is why it is essential to have a good understanding ofthe reactions and processes that take place in the atmosphere in order to be able to predict the pollution events at shorter scale,the evolution of the atmosphere on long term scale, and their impact on the climate change. 24 © 2018 Tous droits réservés.. lilliad.univ-lille.fr.
(25) Thèse de Mohamad Al Ajami, Université de Lille, 2018. One of the most important oxidants in the atmosphere is the OH radical.It’scalled the detergent of the atmosphere. OH reactions are the primary removal processes for many trace gases, such as carbon monoxide, methane andorganic compounds (VOCs). The degradation of these trace gases leads to the formation of secondary gaseous species and organic aerosols (SOA). Hydroxyl radicals are linked to the hydroperoxyl radical, HO2, through a series of oxidation steps involving VOCs, NO and leading to the formation of different peroxy radicals (RO2) as a function of the hydrocarbons present in the local air mass.These highly reactive radicals, known collectively as HOx for the sum of OH and HO2, have short tropospheric lifetimes (<1 s and ~100 s for OH and HO2 respectively) and their concentrations are therefore uninfluenced by transport processes.Close monitoring of HOxand RO2concentrations can therefore provide useful information on the chemical reactions taking placeand the oxidative capacity of a specific environment. I.2.1. Chemistry of HOx radicals in the atmosphere. The OHradical plays a very important role in the chemistry of the atmosphere oxidizing both anthropogenic and natural trace species. It controls the rates of removal of most of these trace gases during the day. These chemicaltransformations involve rapid interconversion between OH and HO2,initiatethe hydrocarbons degradation,the formation of tropospheric ozone, the photochemical smog and influencethe global warming and acid rain. The reactions producing or consuming OH, HO2 and RO2 radicals are listed in the coming sections. I.2.1.1. OH radical. OH is highly reactive; its concentration ranges between 105-107 molecule cm-3 and its lifetime from ms in polluted areas to 1 second in clean environments. Its processes of formation and consumption are multiple and briefly described here. The main source of OH in the troposphere is via the ozone photolysis (λ <310 nm) to form an electronically excited oxygen atom O (1D)that reacts with water vapor to form OH. O3 + hv< 310 nm O (1D) + H2O. O(1D) + O2 2 OH. R I- 5 R I- 6. Reaction R I- 6is, however, a minor consumption pathway of the O (1D) since the water vapor concentration in the troposphere is low (~1%) compared with the N2and O2 concentration (~99%) with whichexcited oxygen atom O (1D) can also relax by collision (calledquenching,R I- 7) to decay to the ground state O(3P), whichreact with O2 to reform O3 according to the following reactions: 25 © 2018 Tous droits réservés.. lilliad.univ-lille.fr.
(26) Thèse de Mohamad Al Ajami, Université de Lille, 2018. O (1D) + M (N2, O2 or H2O) O2 + O (3P) + (M). O(3P) + M. R I- 7. R I- 8. O3. The production rate of OH by ozone photolysis is determined by the relative rates of reactionsR I5andR I- 7and the concentration of H2O. OH production can also be done in the troposphereby photolysis of other species such as nitrous acid (HONO),or hydrogen peroxide (H2O2). These photolysis sources typically constitute a minor route to OH formation. HONO + hv< 400 nm H2O2 + hv >300 nm. R I- 9. OH + NO. R I- 10. 2 OH. In addition, other reactions such as the reactions of O3 with alkenes including isoprene andmonoterpenes lead to the formation of OH (Chew and Atkinson, 1996). O3 + alkenes. OH + products. R I- 11. OH can also be formed through the reactions of HO2 with O3. OH can be consumed by reaction with NO2 or hydrocarbon species (called RH in the following) but in that case, it initiates a cycle which forms HO2andthe reactions involving the conversion of HO2 into OH can be seen as OH reservoir reactions.These reactions are summarized below. OH+ RH. R I- 12. R + H2O. R + O2 + M (third collision partner). RO2+ M. R I- 13. RO +NO2. R I- 14. RO + O2. HO2 +R’CHO. R I- 15. HO2 + NO. OH + NO2. R I- 16. RO2 + NO. The sum of RO2 + RO + HO2 + OH is called ROxradicals. Sources and consumption paths of HO2 are described in the next paragraph.. 26 © 2018 Tous droits réservés.. lilliad.univ-lille.fr.
(27) Thèse de Mohamad Al Ajami, Université de Lille, 2018. I.2.1.2. HO2 radical. HO2 is less reactive than OH,its lifetime varies between 10 s in polluted areas and 1 min in clean environmentsand its concentration is in the rangeof 107-108molecule cm-3. In the presence of NOX and RO2, HO2 radicals are productsof reactionsR I- 12to R I- 15. In the case of methylperoxyl (R = CH3), it also leads to the formation of formaldehyde: CH3O2 + NO CH3O + O2. CH3O + NO2 CH2O + HO2. R I- 17 R I- 18. The reaction between CO and OH is also producing HO2: OH + CO + O2. HO2 + CO2. R I- 19. In areas with lowNOX, HO2 radicals can be consumed and producedby reaction involving ozone: HO2 + O3 OH + O3. OH + 2O2 HO2 + O2. R I- 20 R I- 21. or from reactions of recombinationofRO2illustrated here forCH3O2: CH3O2 + CH3O2. 2 CH3O + O2. CH3O + O2 CH2O +HO2. R I- 22 R I- 18. or from reaction between OH and RO2, here for example for CH3O2 (Assaf et al., 2017a): CH3O2 + OH CH3O + HO2. R I- 23. HO2 canalso be produced by photolysis of aldehydes such as formaldehyde: CH2O + hν H + HCO. R I- 24. H + O2 + M HO2 + M. R I- 25. It is consumed by reacting with NO (R I- 16) or ozone (R I- 20) or halogen compounds, X representing a halogen such as Cl, Br, I (R I- 26 and R I- 27) to form OH: HO2+ XO. HOX+ O2. R I- 26. 27 © 2018 Tous droits réservés.. lilliad.univ-lille.fr.
(28) Thèse de Mohamad Al Ajami, Université de Lille, 2018. HOX+hv. OH + X. R I- 27. It can also react with itself to form H2O2 or with RO2: HO2+ HO2. H2O2. R I- 28. RO2 + HO2 ROOH + O2. R I- 29 ROH + O3. R I- 29a. RO + OH + O2. R I- 29b. R’CHO + H2O + O2. R I- 29c. The yield of the different reaction pathways varies according to the RO2 and little is known about these reactions (Dillon and Crowley, 2008), especially for larger peroxy radicals.At night, the production of HOX is from the reaction of NO3 with VOCsleading to peroxyl radicals (RO2) (Bey et al., 2001) or by reactions between ozone and alkenes. I.2.1.3. RO2 radicals. Peroxy radicals,RO2, are producedby the reactions of OH, during the day, and NO3 with anthropogenic andbiogenic organic gaseous species in the atmosphere such as CH4(Parker et al., 2009) or VOCs. OH, HO2 and RO2 radicals form a catalytic reaction cycle in which RO2has an essential effect on OH and HO2 removal and production in the atmosphere as described in the reactionsR I- 12 to R I- 29.This cycle is connected to the photochemically driven equilibrium between NO2 and NO. Both together are responsible for the production of ozone in the atmosphere(Fuchs et al., 2008)(Monks, 2005). Peroxy radicals are present in the atmosphere at similar concentrations than HO2.When producedby R I- 12andR I- 13, peroxyradicals undergo reaction with NO (R I- 14) or HO2 (R I- 29). Reaction with NO is dominated by the production of NO2 and an alkoxy radical, RO, (R I- 15) and further reaction with O2 produces HO2 (Figure I- 2). This is summarized in the following reactions (R I- 30 being the result of R I- 10 to R I- 13andR I32being the result of R I- 30toR I- 31) RH + 2 O2+2 NO R'CHO + H2O+2 NO2. R I- 30. NO + O (3P) ). R I- 31. 2(NO2 + hν< 420 nm 2 (O (3P) + O2 + M RH + 4 O2+ hν. O3 + M. ). R'CHO + H2O+2 O3. R I- 32 R I- 33. 28 © 2018 Tous droits réservés.. lilliad.univ-lille.fr.
(29) Thèse de Mohamad Al Ajami, Université de Lille, 2018. Products VOCs (Volatile organic compounds) Figure I- 2: simplified schematic of the radical photochemistry in the troposphere.. RO2 can also react with HO2(R I- 29)or other RO2 or with NO or NO2to produce organic nitrates or peroxynitrates (R I- 34,R I- 35) which are stable during night time. RO + NO + M. R I- 34. RONO + M. RO2+ NO +M. R I- 35. RO2NO + M. Recently, the reactions of the smallest RO2(C1 to C4) with OH have been measured and found to be fast(Assaf et al., 2016, 2017b). Depending on the yield of the different paths, these reactions can have important effect on the atmospheric composition. RO2 + OH. I.2.2. R I- 36. ROOOH + O2 ROH + O2. R I- 37. RO + HO2. R I- 38. Determinants of HOx radicals concentration in the atmosphere. OH and HO2concentrations depend on the chemical composition of the atmosphere and the photolysis processes, and will vary depending on the location as well as the meteorological conditions. The concentration of OH is governed by the balance between the processes of formation and consumption. (. ). = (. )− (. ). Eq I- 1. 29 © 2018 Tous droits réservés.. lilliad.univ-lille.fr.
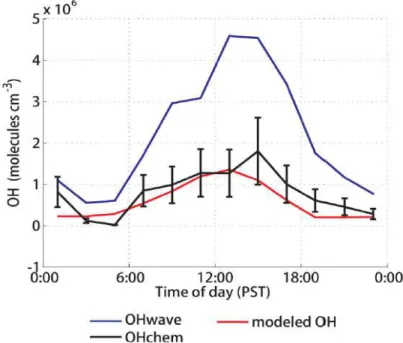
(30) Thèse de Mohamad Al Ajami, Université de Lille, 2018. where P represents the OH production rate and can be expressed as: P(OH) = kHO2+O3[HO2][O3] + kNO+HO2[NO][HO2] +. ∑ΦOHkO3+alkenes[alkenes][O3 ] +∑ν J [i]. Eq I- 2. i i. including the production of OH by HO2 (with ozone or NO), by ozonolysis of alkenes (ΦOH is the OH yield of the reaction), by photolytic sources using O3 or other sources such as HONO, H2O2 (where νi is the OH yield and J is the frequency of photolysis of species i in s-1).. The photolysis frequencies are calculated as follows:. J(T)=∫σ(λ,T).ϕ(λ,T).F(λ).dλ. Eq I- 3. where F (λ) is the actinic flux(in photons cm-2 s-1 nm-1), σ (λ, T) and φ (λ, T) are respectively the absorption cross sections (in cm² molecule-1) and the quantum efficiency of the molecule, that represents the probability that the molecule dissociates after absorption of a photon.. L(OH) represents all the losses of OH such as the consumption by NO, NO2, CH4, CO and with all the reactive species (X) such as volatile organic compounds (VOCs). L(OH) = k OH+NO[NO ][OH ]+ k OH+NO2[NO2][OH ]+ k OH+CH4[CH4][OH ]+k OH+CO [CO] [OH] +. Eq I- 4. ∑ k OH+x[x][OH ]. The consumption and formation pathways of OH in the atmosphere are so fastthat,in a firstapproximation, the steady state can be assumed for the OH concentration in the atmosphere. d[OH]/dt= 0 can be considered, andan estimation of the OH concentration is given as the ratio between its production sources and its consumption pathways.. =. !. !. "!. #. + + !. "!. "!. !. #. #. +. !. + ∑ Φ! ! 4 5 6 5 +. &'()*)+. !. 4!. ,- . ./ 6 + ∑*. !. + ∑3 νiJi i 7 8 *. Eq I- 5. However, this approximation provides only a rough estimation of the OH concentration and measurements are needed to determine the real concentration of OH in different environments in order to understand its chemistry. Different types of instruments have been developed and deployedduring intensive field campaigns(Di Carlo et al., 2004; Fuchs et al., 2017a; Griffith et al., 2016; Hansen et al., 2015; Stone et al., 2012; Tan et al., 2016; Whalley et al., 2016)at ground or 30 © 2018 Tous droits réservés.. lilliad.univ-lille.fr.
(31) Thèse de Mohamad Al Ajami, Université de Lille, 2018. inairplanes to study the OH and HO2 sources and sinks. These ambient measurements arecompared to modeled concentrationsobtained using atmospheric models. These models reflect the chemical reactions taking place in the atmosphere and simulate the concentration level of the different species depending on conditions. We can mention, for example, the MCM (Master Chemical Mechanism) with more than 12,700 reactionsand 4,400 species (Jenkin et al., 2003). Summary of the main results can be found in paragraph I.3.3.. Good agreement between ambient measurements of [OH] and [HO2] under a variety of atmospheric conditions and the results of chemical models constrained to the concentrations of long-lived species such as VOCs, NOx, and O3, is a good indicationthat our understanding of the oxidation chemistry in these regions of the troposphere is robust.Though it should be noted that agreement can also be achieved even if sinks and sources of similar magnitude are missing inthe model. Poor agreement indicates that chemical or physical processes are missing inthe model, and usually prompts further atmospheric measurements or laboratory experiments to discover the missing part of the mechanism.. Recent studies in environments rich in biogenic VOCs such as isoprene and low in nitrogen monoxide (<100 ppt) often exhibit significant differences between measurement and modeling (Kubistin et al., 2010; Lelieveld et al., 2008; Pugh et al., 2010; Tan et al., 2001; Whalley et al., 2011). These discrepancies suggest either measurement artifacts for OH, HO2 potentially, or an incomplete understanding of reaction mechanisms involving HOx radicals (more details in paragraph I.3.3). It can be mentioned that studies in laboratories (Winiberg et al., 2015) or in simulation chambers (Fuchs et al., 2017b), using similar instruments can also help in determining more accurate chemical mechanisms.This combination of laboratory and field measurements coupled to modeling studies is the key to the study of atmospheric chemistry.. I.2.3. OH reactivity in the atmosphere. Although HOx quantification providesimportant information about radicalchemistry, to access to a better description of the radicals balance, another parameter is particularly interesting to measure: the reactivity of the OH radical. OH reactivity is defined as the first order loss rate of the hydroxyl radical with ambient air and represents the inverse of its lifetime.. 31 © 2018 Tous droits réservés.. lilliad.univ-lille.fr.
(32) Thèse de Mohamad Al Ajami, Université de Lille, 2018. OH reactivity provides a globalinformation about the budget of the species reacting with OHpresent in the atmosphere. In general, the higher the reactivity is,the more polluted is the area, butthe OH reactivity directly depends on the species concentrations in the air weighted by their respective rate constant. OH reactivity is expressed in s-1 and is defined by:. kair = ∑3:;<. =>. Xi. Eq I- 6. with Xi being a reactive chemical species, kXithe rateconstant of OH with Xi and, [Xi] the concentration of the species Xi. OH reactivity (Rair) can be calculated by summing the individual reactivity of the different species (Eq I- 6).. Recent instruments have been developed to measure OH reactivity which can be compared to acalculated reactivity from the concentrations of species reacting with OH simultaneously measured at the same place(Nölscher et al., 2012a). Any discrepancy between measured and calculated OH reactivity represent OH sinks that have not been characterized by trace gas measurements and indicates that important unmeasured reactive species are present. The difference between the measured and calculated reactivity is called missing reactivity.. kmissing = kair - kcalculated = ∑ kOH+Xi un [Xiun]. Eq I- 7. with [Xiun] the concentration of unmeasured species Xiun. The missing reactivity provides an important parameter for the study of chemical processes in the atmosphere even if it does not provide direct information on the nature of the species involved(Zannoni, 2015). Several ambient measurements were done in different sites and different techniques in an attempt to understand the hidden chemistry of the OH reactivity(Yang et al., 2016).. A large number, probably more than 105, of different VOCs exists in the atmosphere (Goldstein and Galbally, 2007), but less than one hundred are commonly measured in field campaigns.Different field experiments showed that there is in many environments a missing OH reactivity, which could be due to a fraction of organic compounds missed by the instrument dedicated to VOCs and deployed simultaneously with OH reactivity instruments(Mao et al., 2009; Sadanaga et al., 2005). Thus, incomplete VOCs measurement and/or not suitable techniques used can explain at least a part ofthe missing OH reactivity.TheOH reactivitymeasurement is useful in urban environments where the amount of VOCs is often very high, above the canopy to study the highly reactive biogenic species or in remote environmentswhere oxidized or "aged" air masses can be studied. 32 © 2018 Tous droits réservés.. lilliad.univ-lille.fr.
(33) Thèse de Mohamad Al Ajami, Université de Lille, 2018. Heterogeneous losses of radicals on the surface of aerosol particles could be one of the possible processes to explain the difference, however, the consumption of OH being fast by reactions in the gas phase, this contribution should be minor. Indeed, correlations between measured and missing reactivities showed that the missing reactivity could not be explained by loss of OH on the surface of particles(Mogensen et al., 2011). Until now, from the different fields campaigns, the missing reactivity seems rather due to VOC oxidation products that form more oxidized, semi-volatile compounds reacting with OH, but that are not detected(Mogensen et al., 2011; Sinha et al., 2010; Whalley et al., 2016).Another use of the OH reactivity measurements is to estimate the rate of ozone production. Indeed, the instantaneous production rate of ozone can be linked to the reactivity of OH when combined with measurements of NOX, OH and peroxy radicals. This approach was used to analyze the impact of point sources of ozone during a campaign in a coastal site in Spain (Sinha et al., 2010). It showed that ozone production was higher when the site was influenced by continental air masses. This studydemonstrated that monitoring the air quality could be improved by measures of the reactivity of OH, NOX and O3.The different techniques used to characterize the HOx and ROx radicals and the OH reactivity are described in the following paragraph.. I.3. Review of the techniques for the quantification of HOxand ROxradicalsin the atmosphere. The important role of HOx radicals in atmospheric chemistry has motivated the development of measurement. techniques. for. atmospheric. OH,. HO2. and. RO2. radicalsand. the. OH. reactivity.Instruments developed for field measurements are described briefly below. These measurements are essential to understand the atmospheric chemistry and toimprovemodels. The high reactivity of HOx radicals results in low ambient steady state concentrations (~106 and ~108 molecule cm-3 for OH and HO2 respectively) and hence detection techniques need to be highly sensitive. I.3.1. Techniques for HOxand ROxquantification. Different techniques are used to measure the concentration of OH, or OH and HO2or the sum of RO2 or ROX (RO2 + RO + HO2 + OH). The most common instruments used to make these measurements in the field are describedin the following sections which summarize various techniques used by different groups in the world with their principles of operation, the advantages and disadvantages. More information can be found for OH and HO2in the dedicated review article from Heard and Pilling(Heard and Pilling, 2003)and in the articles related to an inter-comparison campaigns (Fuchs et al., 2010a; Schlosser et al., 2009). 33 © 2018 Tous droits réservés.. lilliad.univ-lille.fr.
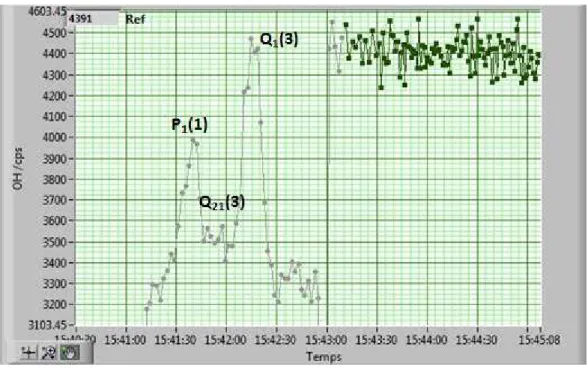
(34) Thèse de Mohamad Al Ajami, Université de Lille, 2018. I.3.1.1. OH detection. Experimental devices for quantifying OH radicals in the atmosphere are few due to the many constraints related to this species suchas the low concentration and high temporalvariability. They are either based on spectroscopic techniques: Fluorescence Assay by Gas Expansion (FAGE, temporal resolution of 1-10 min), Differential Optical Absorption Spectroscopy (DOAS, temporal resolution of 200 s to 10 min), or chemical techniques: Chemical Ionization Mass Spectrometry (CIMS temporal resolution of 30 s 1 min), oxidation by detecting 14CO (time resolution of 5 minutes), by chemical trapping using the salicylic acid (temporal resolution of 30 to 90 min) or trapping on cold matrix (temporal resolution of 20 to 30 minutes (Heard and Pilling, 2003). It may be noted that among the chemical techniques, only the method by CIMS enables temporal resolution measurements high enough for a detailed analysis of the atmospheric chemistry. Indeed, to identify phenomena involving OH, it is necessary to be able to achieve god time resolution since fast variation of the environmental conditions (sun, pollutants) will impact rapidly the OH concentration.Among FAGE, it was therefore chosen to focus on the description of the methods CIMS and DOAS with similar performances in terms of detection limit and temporal resolution compared to those of FAGE, used during this work.. I.3.1.1.1. FAGE (Fluorescence Assay by Gas Expansion). Following the discovery of the importance of OH radicals in the atmospheric oxidation chemistry (Levy, 1971; Weinstock, 1969), it was suggested in 1972 (Baardsen and Terhune, 1972) that the laser induced fluorescence (LIF) technique can be suitable for OH measurement in the atmosphere.It was applied to make the first quantification of OH and HO2in the atmosphereby Hard et al. (Hard et al., 1979). However due to constraints linked to the atmospheric environment (as the presence of ozone and the low concentration of OH), the first instruments developed suffered from interferencesdue to the photolysis of ozone and low sensitivity due to high background signal. Following this, theFAGE (Fluorescence Assay by Gas Expansion) techniquehas been developed, still basedon the detection of OH by LIF but at a longer excitation wavelength and at low pressure.. 34 © 2018 Tous droits réservés.. lilliad.univ-lille.fr.
(35) Thèse de Mohamad Al Ajami, Université de Lille, 2018. Nowadays, about ten groups in the world are using this type of instrument.Laser Induced Fluorescence (LIF) involves the excitation of a molecule or radical in a rovibronic transition from its ground state to an electronically excited state using laser light. The subsequent relaxation of the species from the excited state can be accompanied by spontaneous emission of light (fluorescence), the intensity of which is directly proportional to the concentration of the species probed. The speciescan also relax via nonradiative processes such as collisional quenching, in which the excess energy is transferred to another molecule (O2 or N2).For the first atmospheric OH measurement, laser light at λ=282 nm was used to excite the OH radical in order to spectrally separate the fluorescence light from the OH relaxation from the scattered laser light (Baardsen and Terhune, 1972). However, at that excitation wavelength, the photolysis of ozone causes asignificant interference by the OH production (R I- 5,R I- 6). For this reason, all LIF instruments now are using laser light atλ=308 nmto excite one line of the OH radical in the A (v΄=0) -X (v΄΄=0) transicon, and detect the fluorescenceover the fluorescence band in the same wavelength range(Figure I- 3).This reduces the photolysis of ozone by about a factor of 30. The use of high repetition rate lasers with low pulse energies allows increasing the sensitivity and the time resolution. The main drawback of this excitation/collection scheme is that the fluorescence cannot be separated spectrally from the excitation and a temporally delayed detection is needed.. 2 +. Figure I- 3: Excitation and fluorescence scheme of A ∑ (Ѵ΄=0). 2. X ∏i (ѴG΄΄=0) OH transiHon at λ=308 nm(Heard, 2006).. In the conditions of the UL (University of Lille)-FAGE instrument,the OH fluorescence lifetime is about 800 ns, which is longer than the laser pulse (τ. laser. =20 ns). Then the laser scattered light can be 35. © 2018 Tous droits réservés.. lilliad.univ-lille.fr.
(36) Thèse de Mohamad Al Ajami, Université de Lille, 2018. temporally discriminated from the fluorescence signal by using a gated detector (see chapter IIfor more details).The FAGE instruments are generally calibrated with a source based on water vapor photolysis by a mercury lamp but other calibration sources have also been tested(Dusanter et al., 2008).. I.3.1.1.2. CIMS (Chemical Ionization Mass Spectrometry). The CIMS technique is a technique were OH is chemically converted in a reactor at atmospheric pressure into a molecule that can be ionized and then detected using a mass spectrometer (Berresheim et al., 2000; Eisele and Tanner, 1991).The CIMS technique is based on a rapid titration of the OH radicals by 34SO2after sampling to produceand detect H234SO4without interference with the ambient H232SO4:. OH + 34SO2 + M H34SO3 + O2 34. SO3 + 2 H2O. H34SO3. R I- 39. SO3 + HO2. R I- 40. 34. R I- 41. 34. SO4 H2 + H2O. H234SO4 is then ionized into H34SO4- in an ionization chamber by reaction with NO3-produced separately in the ion source by a corona discharge. The H34SO4- ions are then pumped and selectively detected by a quadrupole mass spectrometer.. H234SO4 + NO3- H34SO4- + HNO3. R I- 42. The CIMS instruments are calibrated using a H2O photolysis calibration system similar to those used for FAGE instruments. The limit of detection of this technique is below 105 cm-3 for 5 min average (Eisele et al., 1996). The main limitation of the CIMS is the conversion of HO2(from R I- 41) into OH at high NO concentrations which then causes an artificial signal. Care was taken in order to reduce this effect by minimizing the reaction time between OH and SO2(Tanner and Eisele, 1995). Propane is also regularly added in order to quantify other interferences.. 36 © 2018 Tous droits réservés.. lilliad.univ-lille.fr.
Figure
+7
Documents relatifs