HAL Id: halshs-00724495
https://halshs.archives-ouvertes.fr/halshs-00724495
Submitted on 21 Aug 2012
HAL is a multi-disciplinary open access archive for the deposit and dissemination of sci-entific research documents, whether they are pub-lished or not. The documents may come from teaching and research institutions in France or abroad, or from public or private research centers.
L’archive ouverte pluridisciplinaire HAL, est destinée au dépôt et à la diffusion de documents scientifiques de niveau recherche, publiés ou non, émanant des établissements d’enseignement et de recherche français ou étrangers, des laboratoires publics ou privés.
Energy-GDP decoupling in a second best world–a case
study on India
Céline Guivarch, Sandrine Mathy
To cite this version:
Céline Guivarch, Sandrine Mathy. Energy-GDP decoupling in a second best world–a case study on India. Climatic Change, Springer Verlag, 2012, 113 (2), pp.339-356. �10.1007/s10584-011-0354-8�. �halshs-00724495�
Energy-GDP decoupling in a second best world - A case study on India
Céline Guivarcha,*, Sandrine Mathya
a
Centre International de Recherche sur l’Environnement et le Développement, Nogent-sur-Marne, France
* Corresponding author at: CIRED, 45bis, Av. de la Belle Gabrielle, F-94736 Nogent-sur-Marne, France.
Tel.: +33 1 43 94 73 20; fax: +33 1 43 94 73 70.
E-mail address: [email protected] (C. Guivarch)
Suggested citation: Guivarch, C. and Mathy, S. 2012. Energy-GDP decoupling in a second best world – A case study on India. Climatic Change, Volume 113, Number 2, pages 339– 356.
Abstract
Reference emission scenarios in the literature have been the target of criticisms that suggest they convey too optimistic views on spontaneous energy-GDP decoupling of emerging countries economies. This article focuses on the case of India. It explores the role of current suboptimalities of the Indian power sector (structural under-investment in the sector leading to capacity shortage, power cuts and low efficiency) on future energy-GDP decoupling. To do so, it uses a hybrid general equilibrium framework, in which these suboptimalities are explicitly introduced. The results highlight that whether the constraints on investments in the power sector persist or not leads to contrasted trends in energy-GDP decoupling and GHG emissions. Over the short-term, capital scarcity in the power sector constrains the development of energy-intensive activities and therefore leads to higher energy-GDP decoupling. But on the longer-term, constrains on the power sector capacity limits substitution from fossil fuels to electricity, which entails both a low energy-GDP decoupling and a constraint on GDP growth when oil prices are high. The alleviation of suboptimalities appears thus as an insurance policy towards future oil price increase.
Keywords
India, energy intensity, second-best world, power sector, reference scenario.
Introduction
Reference scenarios play a critical role in the message conveyed to policy makers for the definition of GHG emission mitigation actions.
Recently, existing reference scenarios, either from the SRES (IPCC, 2000) or from other studies using global energy models, have been the target of repeated criticisms.
First, the relevance of reference scenarios is questioned by actual observations, as Raupach et al. (2008) and Sheehan (2008) showed that GHG emissions are increasing faster than predicted in the large panel of SRES modeling exercises (IPCC, 2000). One of the major
reasons for the discrepancy between short term GHG emissions projection from models and recent trends is the persistent very high levels of economic growth in emerging countries. Until recently economic growth rates considered for these countries in models were significantly lower than currently observed growth rates. This pushed modellers to recalibrate their modelling exercises on recent trends: Blandford et al. (2008) revised emission growth projections from MERGE for China with recent trends, the World Energy Outlook 2007 (IEA, 2007) and the International Energy Outlook 2008 (EIA, 2008) adopted much higher economic growth rates for China and India compared to preceding publications1.
A second side of criticisms (Urban et al. 2007, Van Ruijven et al. 2008) discusses the suitability of methodologies used in existing global energy models to represent the specificities of the developing countries’ energy systems. In particular, it appears that most models neglect some characteristics such as supply shortages, poor performance of the power sector, economic structural change, urban-rural divide, traditional bio-fuels etc, which may bias results.
A third trend of criticism, initiated by an article from Pielke et al. (2008), questions the optimistic views on the automatic (without policies) decarbonisation of economies that are reflected by existing reference scenarios, in particular SRES scenarios. Moreover they warn these scenarios may under-estimate the challenge for climate change mitigation and convey biased views to policy makers
Acknowledging these criticisms, this article proposes to build reference scenarios for India taking explicitly into account specificities of energy systems and particularly current suboptimalities of the power sector: structural under-investment leading to capacity shortage, power cuts and low efficiency. Our objective is to disentangle the mechanisms driving decarbonisation of the economy and the constraints that may stall this process. To do so we use IMACLIM-R a dynamic recursive energy-economy model that represents a second best world with market imperfections and short-run adjustments constraints along a long-term growth path. The first section is an overview of the energy context in India focusing on existing suboptimalities in the power sector, and of existing energy forecasts for India. The second section describes this modelling framework and details how the Indian power sector sub-optimalities are represented. The third section presents three alternative scenarios, based on contrasted assumptions on the evolution of these suboptimalities. Results show that future energy decoupling would increase in the future only if suboptimalities are alleviated. On the contrary persisting suboptimalities in the power sector would lock the Indian economy in a carbon and energy intensive technological pathway.
1 What energy decoupling in the future in India?
Energy intensity and carbon intensity of GDP in developing countries are determining indicators regarding climate change. In particular, climate mitigation targets developing
1 These revisions upwards of future growth rates for emerging countries date from before the financial crisis. More
recent studies either keep assuming high growth rates for emerging countries in the coming years (see for instance IEO 2009 in Table 1), or take into account a relative slowdown of economic growth (see for instance WEO 2009 in Table 1).
countries adopt are often expressed in energy intensity or carbon intensity2 evolution because climate mitigation should not be a supplementary constraint on their development.
In this first part, we analyze what could be the evolution of energy intensity in India.
1.1 Indian energy intensity drivers
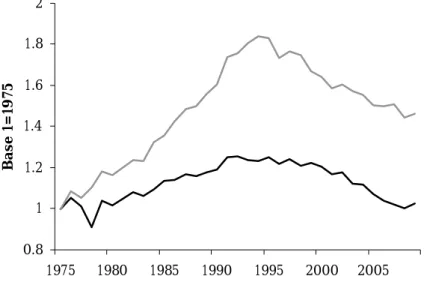
Figure 1 pictures Indian GDP energy intensity since 1975. After important increase until early 90s, energy intensity has decreased during the 20 following years.
During the phase of Indian take off, between the 70s and the 90s, important structural changes have driven economic growth and commercial primary energy consumption in India:
A fast industrialization for infrastructure building, relying on highly energy intensive industries, based on highly energy consuming technologies compared to international standards in industry and in the power sector (Dasgupta, 1999, Mongia et al., 2001).
The development of modern energy forms, allowing the substitution from traditional energy carriers towards electricity.
The evolution of consumption styles with a smooth diffusion of end-use equipments and motor vehicles.
Commercial primary energy consumption grew faster than economic growth (5.7% vs. 4.3%). This led to an important increase in energy intensity.
After this first period, energy intensity began to decrease due to the combined effect of:
A structural evolution of the economy: in 2008 the tertiary sector represents 54% of GDP;
Energy efficiency improvement in industry: energy intensities of industries such as iron and steel, fertilizer and cement have declined significantly: by 70% for iron and steel, and by 65% for cement industries, between 1990 and 2005 (Kumar and Kumar, 2008).
2 Following the Copenhagen Accord, India pledged to reduce the emission intensity of its GDP by 20-25% in 2020
compared to 2005 level, and China to lower its carbon dioxide emissions per unit of GDP by 40-45% in 2020 compared to 2005 level.
Figure 1: Evolution of key energy indicators, period 1975-2008. Source: Enerdata. 0.8 1 1.2 1.4 1.6 1.8 2 1975 1980 1985 1990 1995 2000 2005 B a se 1= 19 75
Commercial primary energy intensity of GDP at US$ constant Final electricity consumption intensity of GDP at US$ constant This trend could continue in the future, as emerging countries could benefit from:
The “leapfrogging mechanism” (Goldemberg, 1998) that argues developing countries should leapfrog to low energy GDP elasticity as they would benefit from transfers of modern and low GHG emitting technologies.
The material content of consumption styles: whether emerging countries choose to reproduce industrialized countries consumption standards with high levels of saturations for equipments or dematerialized modes of consumptions will induce different structures of economies and contrasted energy needs.
Nevertheless, other drivers could deter future energy decoupling.
First, Indian energy intensive sectors still remain highly inefficient with energy consumption critically high compared to international standards (Graus et al. 2007; Kim and Worrell, 2002), and one main objective of the government is to increase the (currently low) share of industry. This would tend to increase energy use per unit of GDP.
Second, energy services for both households and productive sectors are still significantly restrained:
Per capita commercial energy consumption is only 0.3 tep in India in 2007 compared to the world average of 1.7 tep, 1.4 tep for China and 7.7 tep for USA.
Electrification covers only 60% of Indian households. The energy needs of Indian households not connected to the grid rely mainly on biomass or on diesel generators to compensate for the deficiencies in the centralized power supply. Capacity shortage amounts to 10 GW (14.8% of peak power) and the gap between supply and demand rose to 66 TWh (9.6% of demand) in 2007 (Planning Commission), even though the installed power capacity has increased from 66 GW in 1990 to 146 GW in 2007. Capacity shortage leads to power cuts, affecting both households and productive sectors, thus leading to lower productivity and to the use of diesel generators.
One main challenge for the Government is thus to provide electricity and modern forms of energy to all. This would again mean an increase in final energy consumption and a proportional increase in primary energy consumption considering Indian power plant and grid performances are currently very low. A significant improve in energy efficiency of the power system only could moderate this increase. This will depend upon the investment capacity to respond jointly:
to the enlargement of energy access by financing new plants and transmission and distribution (T&D) infrastructures,
to energy efficiency increase by improving the efficiency of existing and future plants and of currently deficient T&D of electricity.
It is thus very difficult to assert whether the recent decrease in energy intensity will continue or not. In the following, several Indian energy prospective exercises are presented focusing on the way energy decoupling drivers are taken into account and on the resulting energy decoupling.
1.2 Analysis of existing reference scenarios
Scenarios considered in this subsection are summarized in Erreur ! Source du renvoi
introuvable.. Methodologies and assumptions are described below:
Projections from the World Energy Outlook (WEO) realized by the International Energy Agency (IEA, 2006, 2007, 2008 and 2009) and from the International Energy Outlook (IEO) realized by the US Department of Energy (EIA, 2006, 2007, 2008 and 2009) are based on bottom-up models: exogenous economic growth rates and assumptions related to structural changes in the economy and to the diffusion of energy efficient technologies and equipments determine the energy mix in (2015 and) 2030. Resulting decoupling of GDP is shown in Erreur ! Source du renvoi
introuvable..
The Integrated Energy Policy (IEP) Report (Parikh, 2006) was commissioned by the government to undertake a comprehensive review of aspects like energy security, research, environmental concerns, and energy conservation in order to make policy recommendation. Economic growth rates are taken as political objectives and energy decoupling exogenous assumptions set future energy requirements. Two sets of assumptions related to economic growth (8% and 9%) and to primary energy decoupling (constant elasticity and falling elasticity) are used; they determine the level of commercial primary energy demand.
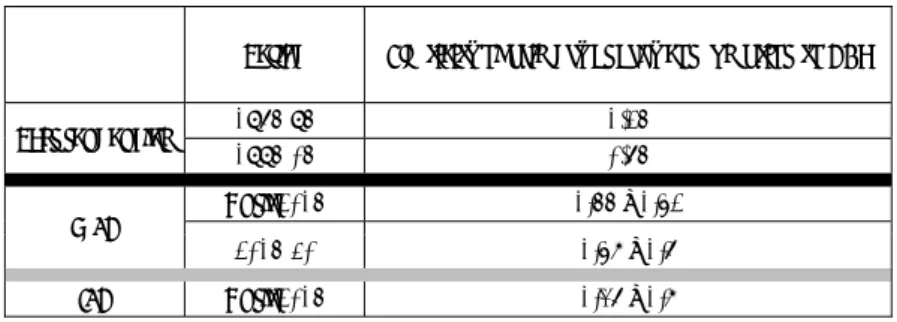
Table 1: Energy decoupling comparison between past tendencies, WEO and IEO energy prospective scenarios and IEP Report. Assumptions are in italics and results are in bold characters.
Period Elasticity of primary energy consumption to GDP Past tendencies 1975‐95 1.25 1995‐05 0.75 WEO Until 2015 0.44 – 0.51 2015‐30 0.57 – 0.6 IEO Until 2015 0.36 – 0.7
2015‐30 0.49 – 0.52 IEP ‐ Falling elasticities 2005‐11 0.75 2011‐21 0.70 2021‐31 0.67 IEP ‐ Constant elasticities 2005‐31 0.8
Erreur ! Source du renvoi introuvable.compares energy intensity of WEOs and IEOs
results to assumptions adopted in IEP:
Primary energy decoupling decreases from 0.75 in 2005 till around 0.5 in 2015 in WEO and even less in IEOs and increases again after 2015. In 2030, energy intensity is halved compared to current levels.
In IEP, two exogenous assumptions are considered. In the first one, energy decoupling decreases during the whole period, from 0.75 in 2005 to 0.70 in 2015 and to 0.67 in 2030. In the second assumption, energy intensity remains constant. The reason for having kept these two sets of assumptions is that normally overall elasticity falls over time as is corroborated by the time series data for India’s commercial energy consumption. However IEP states that for India the energy elasticity of GDP growth may not fall any further as rising income levels will foster more energy intensive lifestyle.
In spite of these contrasted pictures in term of energy decoupling, primary energy demand drivers are quite the same in WEO and IEP3:
Slight increase in industry’s share of total final energy demand. This trend is consistent with the political objective of reinforcement of Indian industry activities, but there is a shift away from energy-intensive heavy manufacturing towards lighter industries and services. In WEO 20074, industry’s share of energy demand edges up to 34% in 2030 compared to 28% in 2005;
Evolution of lifestyles. With the very high economic growth considered in all scenarios, and particularly until 2015, household energy service (household equipment, electric appliances, mobility) demand increase is very high. In WEO 2007, the total vehicle stock in India is projected to increase from 68 million in 2004 to 295 million5 by 2030, overtaking that of the United States soon after 2025; refrigerator sales are expected to nearly triple by 2020;
Enlargement of electricity access: In 2005, the share of lighting met by electricity in urban households was about 90%, but only 50% in rural households. High electricity generation and consumption growth rates are consistent with the governmental priority for giving modern energy and electricity access to 100% of the Indian population. By 2030, in WEO 2007, all lighting is projected to be met by electricity in urban areas while in rural areas about 7% of households will still rely on kerosene for lighting. Electricity growth is even more important in IEP.
Important energy efficiency improvement. Indian power plants are among the least efficient in the world. In WEO 2007, efficiency is expected to increase from 27% now
3 In IEO, energy demand growth drivers for India are not detailed.
4 In this subsection, we often refer to WEO 2007, as this edition was dedicated to India and China.
5 This number however corresponds to a relatively low equipment rate: around 200 vehicles for 1000 persons. It is
to 38% in 20306. In all WEO scenarios electricity T&D losses decrease significantly. In IEP also, the gross efficiency in power generation increases from the current average 30.5% to 34%: efficiency of new plants improves from the prevailing 36% to at least 38-40%.
The combined effect of these drivers leads, in all WEO and IEO scenarios, to a very significant GDP energy intensity decrease, while IEP scenarios are more conservative concerning the potential decrease in energy intensity. Actually, IEP report states that an aggressive pursuit of energy efficiency and conservation only7 could reduce India’s energy intensity by up to 25% from current levels. Financing at the same time energy efficiency improvements of a very inefficient system and energy access enlargement in a more energy intensive economy (with the deployment of industry) and with higher energy consuming lifestyles appears the condition to reach important energy decoupling in the future.
Attracting investment in a timely manner will thus be essential and underlying assumption of the WEO 2007 scenario is that investment will be available and that this power infrastructure will be built in time, even if many challenges remain. Chronic underinvestment in power sector has been a major constraint to the country's development. The capacity addition targets set in the five-year plans have generally not been met and performance has deteriorated over the past three plans. Performance in the 10th plan period (2002-2007) was the worst ever. Less than half of the capacity envisaged was built. Insufficient investment resulted in electricity generation increasing at a rate well below the economic growth rate for five consecutive years (2001 to 2006), a situation never seen in the past. The pace of capacity additions stagnated in the 1990s. Economic reforms were introduced in 1991, in the expectation that part of the required investment would come from the private sector. But many of the projects proposed have not proceeded, mainly because of an inadequate legal and commercial framework, involving lack of law and contract enforcement and delays in obtaining regulatory approvals. The target in the 2007-2012 Plan foresees capacity additions of 69 GW, much higher than the unmet target of 41 GW set in the 10th Plan.
This under-investment is largely due to the high risks and low profitability of investments in the power sector. Administered prices do not cover production costs: in 2006, the average price of electricity sold covered only 77% of the average production cost. Official data estimate the total under-recovery of costs to 0.8% of GDP. The same report estimates that the residential tariff covers 56% of the generation costs and farmers tariff only 12%, while industries and the commercial sector partly compensate by paying respectively 108% and 122% of production costs. Official data reports that subsidies to household and agriculture electricity consumption tripled to represent respectively 0.4% and 1.1% of GDP. In 2000, agriculture electricity uses represented 1/3 of electricity sales in volume while the corresponding revenues constituted less than 5% of total revenues.
These subsidies are justified by positive externalities on development, particularly regarding access to cheap energy for irrigation to promote food production. Nonetheless, they have significant side effects. First, the very low tariffs for farmers induce overconsumption, which increases the magnitude of capacity shortage. Overconsumption of electricity in the agricultural sector amounts to 30% of its consumption due to the combination of critically low
6 Over the projection period, the efficiency of coal fired power generation is projected to improve considerably, as
the new plants will be larger and more efficient, and more supercritical units will be built.
prices and of frequent but unpredictable power cuts that create a strong incentive to a continuous use of electric pumps for irrigation (Dorin and Jullien, 2004). Second, low revenues from electricity sales induce maintenance under-financing and increasing inefficiencies in T&D. Technical and commercial T&D losses have increased from around 20% in 1993 to more than 30% in 2001 (Thakur et al., 2006)8. Moreover, power sector inefficiencies constrain economic activity and economic growth: electricity shortages hamper productivity and competitiveness.
It appears that the sub-optimalities of the Indian power sector described above9 are structural characteristics of the Indian energy system. Therefore, they have to be taken into account in modelling framework to develop realistic prospective scenarios, as advocated fifteen years ago by Shukla (1995) and more recently by Urban et al. (2007) and Van Ruijven et al. (2008). Next section describes a modelling framework able to embark sub-optimalities of the Indian power sector and to represent power and investment shortage and their impact on economic growth.
2 A modelling framework to represent a second best world
2.1 Model architecture and major features
The IMACLIM-R model 10 (Sassi and al. 2010) is a recursive, dynamic, region and multi-sector Computable General Equilibrium (CGE) model of the world economy. It describes growth patterns in second best worlds through a hybrid and recursive dynamic architecture that captures market imperfections, partial uses of production factors and imperfect expectations.
2.1.1. A growth engine with gaps between natural and effective growth
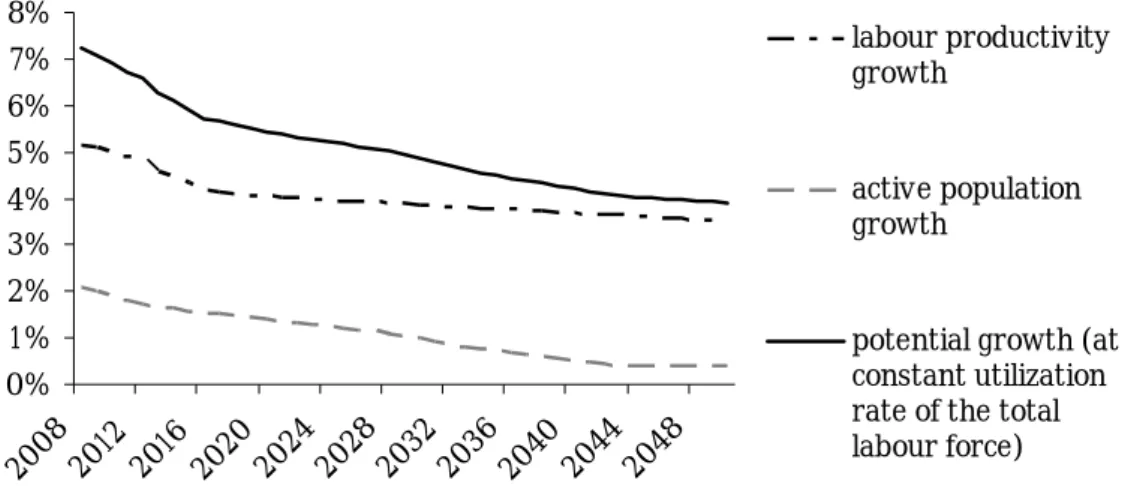
IMACLIM-R relies on exogenous assumptions11 of regional labour productivity and active population growths, the sum of which determines the ‘natural’ growth rates (Solow, 1956). They represent real GDP growth that would be realized at constant unemployment and structure of the economy. For India, natural growth decreases from 7.2% to 3.9% in 2050 (Figure 2).
8 The level of T&D losses is in fact uncertain. For instance, the value stated by the Indian Planning Commission was
22% in 1998 while the World Bank (1998) pointed out that it could actually be twice this official level. Moreover, as there is no metering of the electricity consumption it is difficult to distinguish technical from commercial losses.
9 For further description of suboptimalities and of the institutional aspects of the Indian power sector, refer to
Mathy and Guivarch (2010).
10 Details concerning calibration and disaggregation are given in SOM. 11 See SOM for details on these assumptions.
0% 1% 2% 3% 4% 5% 6% 7% 8% 20082012 2016 2020 2024 2028 203 2 203 6 2040 204 4 204 8 labour productivity growth active population growth
potential growth (at constant utilization rate of the total labour force)
Figure 2 : Exogenous potential growth of the Indian GDP over the 2050 time horizon, and its decomposition.
The endogenous ‘effective’ growth rates can be different, higher or lower, from ‘natural’ rates, depending on the evolutions of unemployment and labour allocation across regions and sectors. These evolutions are constrained by financial resources for investments and short-term rigidities like capital stock inertia, frictions in reallocating labour or wage rigidity.12
2.1.2. A recursive and modular architecture to account for inertia in technical systems and sub-optimalities
The IMACLIM-R model has a hybrid structure relying on a consistent representation of the economy in money values and physical quantities. Its recursive structure organizes a systematic exchange of information between a top-down annual static equilibrium providing a snapshot of the economy at each yearly time step, and bottom-up dynamic modules informing on the evolution of technical parameters between two equilibria.
Within the static equilibrium, domestic and international markets for all goods – except factors such as capital and labour – are fully cleared by a unique set of relative prices that depend on the behaviours of representative agents on the demand and supply sides. It determines the following variables: relative prices, wages, labour, quantities of goods and services, value flows. Within the static equilibrium, producers are assumed to operate under short-run constraints of (i) a fixed maximal production capacity defining the maximum level of physical output achievable, and (ii) fixed input-output coefficients representing current set of embodied techniques. The only margin of freedom of producers is to adjust the production capacities utilisation rate according to the relative market prices of inputs and output, taking into account increasing costs when the production capacities utilization rate approaches one13. This represents a different paradigm from usual production specifications, since the ‘capital’ factor is not always fully utilized.
12 Guivarch et al. (2011) analyze the impact of the real wages rigidities on the model results.
13 Following (Corrado and Mattey, 1997), we assume that this is generally caused by higher labour costs due to extra
The dynamic modules make the short-term constraints of the static equilibriums evolve in time. They represent the accumulation of capital and its technical content. They include the modelling of (i) the evolution of capital and energy equipment stock described in both vintage and physical units, (ii) of technological choices of economic agent described as discrete choices in explicit technology portfolios for key sectors such as electricity, transportation and alternative liquid fuels, or captured through reduced form of technology rich bottom-up models, and (iii) of endogenous technical change for energy technologies.14
Aggregate capital accumulation is controlled by exogenous saving rates, but IMACLIM-R represents second-best investment decisions under imperfect foresight. Thus, installed capital resulting from past investment decisions may not be adapted to future economic settings. However, it cannot be renewed overnight due to inertias and acts as a constraint on growth pathways, like in the case of a sharp increase of fossil energy prices.
2.2 Representing market and institutional failures of the power sector in Imaclim-R modelling architecture
In the static equilibriums, the electricity price depends on the characteristics of the installed power generation capacities (the type of fuel used and the efficiency, including T&D losses) and on the utilization rate of these generation capacities: high utilization rates induce extra-costs. Between each static equilibria, the evolution of power generation capacities depends on annual investment decisions, that determine new capacities installation (among 26 generation technologies in competition) to satisfy (imperfectly) anticipated future demand minimizing generation costs, given (imperfect) anticipations of future fuel prices. This minimization is run under the constraint of the actual amount of investment allocated to the electric sector Within this modelling framework, suboptimalities of the Indian power sector are embarked. The analysis focuses on under-investment in the sector, and its consequences, namely (i) power generation capacity shortage, and (ii) inefficiencies and T&D losses.
(i) Under-investment in the power sector is represented by a gap between the estimated need for investments (i.e. the investment to build the optimal mix of productive equipment to satisfy the anticipated electricity demand) and realized investments in the power sector. Realized investments for all sectors are constrained by sectors profitability and total domestic investment plus net capital inflows. Additionally, to represent at the aggregate level the capital scarcity in the Indian power sector, investments in the sector are limited to a maximum share of GDP.
(ii) Power generation capacity shortage is represented by over utilization of generation capacities. In the model, a utilization rate superior to 0.8 means that the capacity is overused. In 2008, the utilization rate of electricity production capacities is 0.86, which corresponds to 7.5% of capacity shortage (i.e. 7.5% more capacities would be needed to reach a utilization rate of 0.8) and is consistent with estimations given above. This over utilization of productive
14 See SOM for further details on the representation of the evolution of energy supply and demand, energy efficiency
capacities entails extra generation costs15 and raises the electricity usage cost, which is a stylized representation of electricity shortage (power cuts) for the Indian economy16.
(iii) Power plants characteristics, in particular their efficiencies, as well as T&D losses are calibrated on the sectoral model POLES (LEPII-EPE, 2006). In 2001, the calibration date, overall efficiency of power generation is equal to 32% and T&D losses are 35%.
The following section uses the Imaclim-R model to project over the period 2008-2050 baseline scenarios taking into account the evolution of the three elements described above.
3 Energy decoupling and power sector suboptimalities in baseline
scenarios
3.1 Description of baseline scenario parameterization
Whether constraint on investments in the power sector will be alleviated or not in coming decades will depend upon several factors:
The evolution of regulatory and administrative barriers and of commercial framework in the power sector and the reduction of investment risks in order creating effective incentives for private investors.
Possible increased tensions on the international capital market as in the future Europe and China may experience a drop of their saving capacities due to an aging population (Aglietta et al., 2006).
These elements legitimate investigating three possible evolutions of the investment constraint in the power sector: the continuation of current trends (MEDIAN), the deterioration of the investment context (INV-) and an alleviation of investment constraint (INV+). These parameters are set respectively to 2.2%, 1.8% and 3% of annual GDP.
This financing is invested in new power capacities. Nevertheless to bridge the gap between demand and supply, financing T&D loss reduction should also become a priority. Historically, capital scarcity in the Indian power sector has prevented from investing in maintenance of the T&D network. This is why we assume that in India a stringent capital constraint prevents from improving T&D losses. On the contrary, the alleviation of the capital constraint would trigger T&D loss decrease. These assumptions are implemented in INV-, MEDIAN and INV+. Cost and technical potential parameterization (Table 2) is consistent with Ruet (2001).
Table 2: Typology of scenarios
INV+ MEDIAN
INV-Investment constraint (%GDP) 3% 2.2% 1.8% T&D losses decrease linearly to 10% in 2050 decrease linearly to 20% in 2050 constant
15 Mean generation costs increase when capacity is overused due to the existence of static decreasing returns due to
higher labour costs and because less efficient units are switched on last at the aggregate level. By default, following Corrado and Mattey (1997), in our model the increasing factor is attached to wages.
16 There are alternative representation of shortages, in particular explicit restriction of demand growth in some
3.2 Results
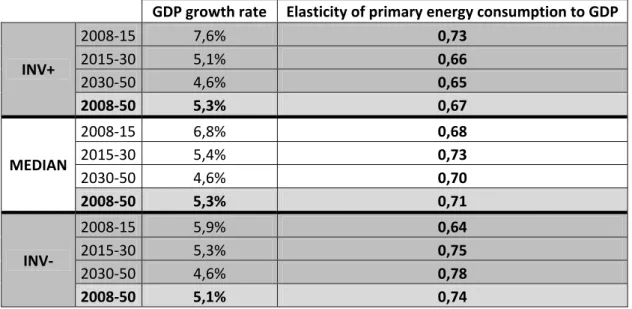
Scenarios main characteristics are introduced in the following (Table 3), and economic mechanisms at play are then further detailed.
Energy decoupling in INV-, MEDIAN and INV+ are very different from scenarios presented previously.
Primary energy supply decoupling in Imaclim-R baseline scenarios is much lower than in WEO or in IEO reference scenarios, particularly during the period 2008-2015, but roughly at the same level as IEP assumptions.
Table 3: Economic growth and energy, electricity and GHG emission indicators comparison between MEDIAN, INV+ and INV- GDP growth rate Elasticity of primary energy consumption to GDP INV+ 2008‐15 7,6% 0,73 2015‐30 5,1% 0,66 2030‐50 4,6% 0,65 2008‐50 5,3% 0,67 MEDIAN 2008‐15 6,8% 0,68 2015‐30 5,4% 0,73 2030‐50 4,6% 0,70 2008‐50 5,3% 0,71 INV‐ 2008‐15 5,9% 0,64 2015‐30 5,3% 0,75 2030‐50 4,6% 0,78 2008‐50 5,1% 0,74
The second point concerns temporal trends:
In all WEO and IEO scenarios energy decoupling is very high during 2008-2015 (elasticity of primary energy consumption around 0.5) due to significant energy efficiency improvements compared to current trends (0.75) and followed by a relative decrease of the decoupling incurred by energy consuming end-use equipment penetration as Indian population get richer,
In IEP scenarios, trends show slightly decreasing, or constant, energy-GDP elasticity over the whole period. ,
In Imaclim-R scenarios, energy decoupling trajectory depends upon the level of investment constraint in the power sector as temporal profile is different for each scenario:
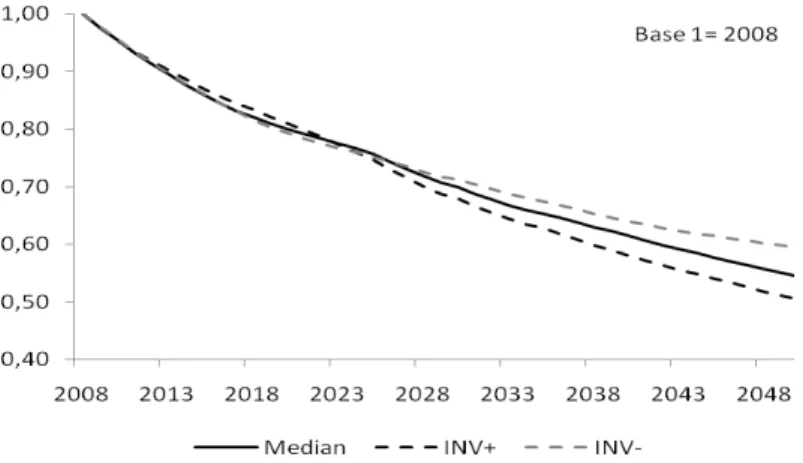
in INV- energy decoupling decreases on the whole period, in MEDIAN it decreases and then increases again,
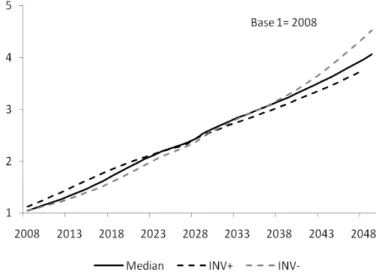
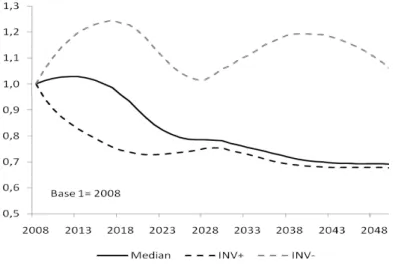
Figure 3 shows three distinct periods: before 2020, between 2020 and 2030 and after 2030. The year 2020 corresponds to the “peak oil” with a steep increase in oil prices17 until 2030 after which prices stabilize at 200$/bl. The decade between 2020 and 2030 corresponds to the delay for the large scale development of substitutes to oil (Coal-To-Liquid and biofuels) with default parameterization of the model. During this decade of increasing oil prices, Indian GDP growth rates drop down in the three IMACLIM-R scenarios.
Moreover, around 2025, CO2 emission and energy decoupling trajectories of INV-, MEDIAN
and INV+ cross each other (Figure 4 and Figure 5): before this date, INV+ is the scenario with the highest CO2 emissions and with the lowest energy decoupling; after, INV- becomes
the scenario with highest CO2 emissions and energy intensity of GDP.
Figure 3: GDP growth rate in the Imaclim-R scenarios and potential growth
Figure 4: CO2 emissions in the Imaclim-R scenarios
Figure 5: Primary energy GDP intensity in the Imaclim-R scenarios
17 Oil prices in IMACLIM-Rresult from the endogenous interplay between the strategic behaviour of oil producers,
constraints on supply (temporal constraints on capacity development and total reserves available) and demand dynamics. Assumptions concerning oil reserves amount to 2.200 Gbl of conventional oil and 1.200Gbl of non conventional oil (including extra-oil in Venezuela and tar sands in Canada). This is in line with estimates from the US Geological Survey.
BEFORE THE PEAK-OIL
In the first period, the less capital constrained scenarios (INV+ and MEDIAN) result in economic growth rates close respectively to WEO2008 (7.8%) and to WEO2009 (7%) forecasts. On the contrary, INV- economic growth rate is significantly lower than most recent WEO economic assumptions during this period (5.9%).
The effective investment constraint in the power sector can be evaluated, for a given value of T&D losses, by the gap between the estimated need for investments and realized investments. The stringency of the constraint will be reinforced by higher T&D losses. In a context characterized by power shortage, producers have no choice but using more the existing capacities. Productive capacity over-utilization leads to generation extra-costs as described previously. They raise the electricity usage cost (
Figure 7), which limits the development of electricity use by productive sectors as well as by households.
In the most capital constrained scenario (INV-), the pessimistic assumptions related to the T&D losses explains the lower electricity consumption than in the MEDIAN scenario, the overall electricity generation is higher. The investment constraint stringency leads to important generation extra-costs (
Figure 7), which hinders an increase in electricity generation, in electricity consumption and in energy substitution towards electricity particularly in industry. The energy intensive sectors are more constrained than other sectors: for instance, in 2020 real GDP is reduced by 7.2% compared to the MEDIAN scenario, while industry output is reduced by 11.2% (Figure 8). This compensates the higher energy content of GDP due to high electricity T&D losses, which leads to almost the same energy-GDP decoupling (Figure 5). Since economic growth is lower, so are primary energy and total CO2 emissions (Figure 4).
The release of the investment constraint in the power sector (INV+) makes possible, on the short term, the increase in electricity generation to meet demand. As a result, electricity consumption in the short term is higher: +7% in INV+ compared to the MEDIAN scenario (Figure 6, left panel). Even if T&D losses decrease power generation is higher than in the MEDIAN scenario, over the short-term (Figure 6, right panel). Extra-generation costs due to capacity shortage are rapidly absorbed and electricity price decreases (
Figure 7). This lowers industrial production costs, enhances industrial products competitiveness and also improves households’ purchasing power. Industrial production is
thus increased: for instance in 2020 real GDP is increased by 3.4% compared to the MEDIAN scenario, while industry output is increased by 8.5% (Figure 8). The improvement of households’ purchasing power also leads to more electricity consumption and more transportation activities. Therefore, energy-intensive activities take a larger share in GDP and there is less energy-GDP decoupling over the short-term (Figure 5). Since GDP is higher, total CO2 emissions are also higher than in MEDIAN scenario (Figure 4).
These results are consistent with short term WEO results forecasting high economic growth rates in an unconstrained investment context. Nevertheless, forecast differences between WEO reference scenarios and INV+ come from different views concerning the potential pace of energy efficiency diffusion, the rate of T&D losses reduction and the industrial content of households’ consumption. It may be noted that in 2020, the three IMACLIM-R scenarios lead to a GHG-GDP intensity of respectively -21%, -23% and -20% of 2005 level, which is very close to the Indian pledge following Copenhagen Accord (-20% to -25% in 2020 compared to 2005 level). WEO and IEO scenarios give GHG-GDP improvement significantly higher than the Indian pledge (between -30% and -45% in 2020 compared to 2005).
AFTER THE PEAK OIL
These trends are reversed when peak-oil occurs: in a world of high oil prices, the less the investment in the power sector is constraint, the higher the energy decoupling is and the lower GHG emissions are.
After the peak oil, the electricity capacity shortage is absorbed in both MEDIAN and INV+ scenarios (Figure 7). The only significant difference between the two scenarios is then the T&D losses. Both scenarios have the same level of GDP (Figure 3), but INV+ is characterized by less electricity generation for the same level of consumption (Figure 6), hence more energy-GDP decoupling ( Figure 5) and lower emissions (Figure 4).
On the contrary, in INV- scenario, power generation capacity shortage remains a lasting constraint. This limits the substitution between oil and electricity in the industry when oil prices rise. In a first time (approximately 2018-2028), the higher fossil fuel content of industrial inputs in the INV- scenario is compensated by the carbon content of the substituted electricity input in the MEDIAN scenario (Figure 9). But, when power generation efficiency has improved, the limit to the substitution between oil and electricity leads to higher carbon content of industry production in INV- scenario. Moreover, this limit to substitution entails higher energy costs in industrial production (Figure 10), which hinders production (Figure 8). The composition of higher fossil fuel unitary input (Figure 9, lower-left panel) and lower output leads here to higher emissions from industry (Figure 11), which adds to the higher emissions due to important T&D electricity losses. It leads to less energy-GDP decoupling than in the MEDIAN scenario (Figure 5) and higher emissions (Figure 4) even if GDP is lower.
Figure 6: Electricity generation and electricity final consumption compared to the MEDIAN scenario
Figure 7: Electricity prices
Figure 9: Carbon content of industrial output and carbon content of electricity input in industrial production in MEDIAN and INV-.
Total carbon content of industrial output (including carbon content of electricity
consummed) 0 0.2 0.4 0.6 0.8 1 2008 2013 2018 2023 2028 2033 2038 2043 2048 in d ex 1 = 2008 to ta l ca rb on co n te n t MEDIAN
INV-Carbon content of industrial output from fossil fuel consumption
0 0.2 0.4 0.6 0.8 1 2008 2013 2018 2023 2028 2033 2038 2043 2048 in d ex 1 = 20 0 8 to ta l ca rb o n c o nt en t MEDIAN
INV-Carbon content attributed to industrial output from electricity intermediate consumption
0 0.2 0.4 0.6 0.8 1 2008 2013 2018 2023 2028 2033 2038 2043 2048 in d ex 1 = 2008 to ta l ca rb on c ont en t MEDIAN
INV-Figure 10: Energy costs in industrial production in MEDIAN and INV- (index 1=2008)
Energy costs in industrial production
0 0.2 0.4 0.6 0.8 1 1.2 2008 2013 2018 2023 2028 2033 2038 2043 2048 MEDIAN
Figure 11: CO2 emissions from industrial production in MEDIAN and INV- (index 1=2008) (excluding emissions
CO2 emissions from industry
0
0.5
1
1.5
2
2.5
3
3.5
20
08
201
4
202
0
202
6
20
32
203
8
20
44
205
0
MEDIAN4 Conclusion
Main results can be summarized as follows. First, energy decoupling in Imaclim-R scenarios is much lower than in WEO and IEO scenarios, but comparable to Indian expert forecasts. Second, the three Imaclim-R scenarios lead to contrasted evolution of energy decoupling and of decarbonisation, showing capital scarcity. Over the short-term, capital scarcity in the power sector constrains the development of energy-intensive activities and therefore leads to higher energy-GDP decoupling. But on the longer-term, constrains on the power sector capacity limits substitution from fossil fuels to electricity and entail less energy-GDP decoupling. Three kinds of conclusions can be drawn.
First, future decarbonisation and further energy decoupling of GDP in India should not be considered as granted as it may appear in WEO or IEO reference scenarios or in SRES scenarios. Persisting capital scarcity and deficiencies in the power sector could limit energy efficiency improvements, and prevent power supply capacity from responding to increasing energy demand. This can have negative impacts on economic growth on the short term, as well as on a longer term when oil prices increase.
Second, regarding climate policies, the realism of the reference scenario is critical for estimates of the costs of stabilization at a given GHG concentration and for policy recommendations. Persisting failures in the power sectors encloses India in a carbon and energy intensive technology lock-in. Climate policies such as a carbon tax in such a context would weigh significantly on economic growth (Mathy and Guivarch, 2010). On the contrary, the alleviation of investment barriers in the power sector on the short term would both lift barriers to development and reduce GHG emissions on the long term. This potential for synergies between development and climate policies could help getting out of the deadlock in international negotiations.
Third, from a methodological point of view, it emphasizes the importance to improve the realism of modelling tools and to use methodologies that allow representing for each country specificities and sub-optimalities, and to consider the interactions and feedbacks between the energy system and economic mechanisms. Similar modelling methodologies, focusing on
China in particular, would bring valuable insights to a comprehensive understanding of energy and economic interactions driving current and future GHG emissions trends.
References
Aglietta M, Borgy V, Château J, Juillard M, le Cacheux J, Le Garrec G, Touzé V (2006) World Growth and international capital flows in the XXIst century. Working Paper OFCE 2006-07, April. 41pp.
Blanford GJ, Richels RG, Rutherford TF (2008) Revised Emissions Growth Projections for China: Why Post-Kyoto Climate Policy Must Look East. Working Paper, September. 32pp.
Corrado C, Mattey J (1997) Capacity Utilization. The Journal of Economic Perspectives 11, n°. 1 (Winter): 151-167.
Dasgupta N (1999) Energy efficiency and environmental improvements in small-scale industries: present initiatives in India are not working, Energy Policy (27) 789:800.
Dorin B, Jullien T (2004) Agricultural incentives in India. Past trends and prospective paths towards sustainable development. Manohar, New Delhi, 334pp.
EIA, (2009) International Energy Outlook 2008. Office of Integrated Analysis and Forecasting, U.S. Department of Energy, Washington, DC. 274pp.
EIA (2008) International Energy Outlook 2008. Office of Integrated Analysis and Forecasting, U.S. Department of Energy, Washington, DC. 260pp.
EIA (2007) International Energy Outlook 2007. Office of Integrated Analysis and Forecasting, U.S. Department of Energy, Washington, DC. 220pp.
EIA (2006) International Energy Outlook 2006. Office of Integrated Analysis and Forecasting, U.S. Department of Energy, Washington, DC. 192pp.
Goldemberg J (1998) Leapfrogging energy technologies. Energy Policy 10, 729–741.
Graus WHJ, Voogt M, Worell E (2007) International comparison of energy efficiency of fossil power generation. Energy Policy, 35 3936–3951
Guivarch C, Crassous R, Sassi O, Hallegatte S (2011) The costs of climate policies in a second best world with labour market imperfections. Climate Policy 11: 768-788.
IEA (2006) World Energy Outlook. OCDE/IEA. Paris. IEA (2007) World Energy Outlook. OCDE/IEA. Paris.
IEA (2008) World Energy Outlook. OCDE/IEA. Paris. IEA (2009) World Energy Outlook. OCDE/IEA. Paris.
IPCC (2000) Special Report on Emissions Scenarios: a special report of Working Group III of the Intergovernmental Panel on Climate Change. I Cambridge University Press, New York, NY (US).
Kim Y, Worrell E (2002) International comparison of CO2 emission trends in the iron and steel industry. Energy Policy, 30, 827–838
Kumar A, Kumar V (2008) Energy, industries and commerce, High-Level India-EU Seminar,
Potsdam, 27-29 May 2008. Available at:
http://www.climatecommunity.org/documents/Paper8-Energy-industries-commerce_001.pdf
Mathy S, Guivarch C (2010) ‘Climate policies in a second-best world - A case study on India’, Energy Policy 38:3, 1519-1528.
Mongia P, Schumacher K, Sathaye J (2001). Policy reforms and productivity growth in India's energy intensive industries, Energy Policy (29) 715:724.
Parikh KS et al (2006) “Integrated Energy Policy, Report of the Expert Committee”, Planning Commission, Government of India.
Phelps E (1961) The Golden Rule of Accumulation: A Fable for Growthmen . The American Economic Review, 51(4): 638-643
Pielke R, Wigley T, Green C (2008) Dangerous assumptions. Nature, 452, 531-532.
Raupach MR, Marland G, Ciais P, Le Quéré C, Canadell JG, Klepper G, Field C (2008) Global and regional drivers of accelerating CO2 emissions. PNAS June 12, 104(24) 10288-10293.
Ruet J (2001) Investment profitability in bridging the power gap in India. The Indian Economic Journal. October-December. Volume 49, n°2. 17p.
Sassi O, Crassous R, Hourcade JC, Gitz V, Waisman H, Guivarch C (2010) Imaclim-R: a modelling framework to simulate sustainable development pathways. International Journal of Global Environmental Issues 10, n°. 1: 5-24.
Sheehan P (2008) The new global growth path: implication for climate change analysis and policy. Climatic Change, 91, 211-231.
Shukla PR (1995) Greenhouse gas models and abatement costs for developing nations. A critical assessment. Energy Policy 23, n°. 8: 677-688.
Solow R M (1956) A contribution to the theory of economic growth. The Quarterly Journal of Economics: 65-94.
Thakur T, Deshmukh SG, Kaushik SC (2006) Efficiency evaluation of the state owned electric utilities in India, Energy Policy 34, 2788-2804.
Urban F, Benders R, Moll H (2007) Energy Policy, 35, 3473-3482.
Van Ruijven B, Urban F, Benders R, Moll H, Van der Sluijs J, De Vries B, Van Vuuren D (2008) Modeling energy and development: An evaluation of models and concepts. World Development, 36-12, 2801-2821.
WorldBank (1998) Power sector reform and the privatization of distribution in India. Internal working document prepared by H. Salgo et al.