The
Jour
nal
of
P
hysiology
Time-course changes of muscle protein synthesis
associated with obesity-induced lipotoxicity
Aur´elie Masgrau
1,2, Anne Mishellany-Dutour
1,2, Hitoshi Murakami
1,2, Anne-Marie Beaufr`ere
3,
St´ephane Walrand
1,2, Christophe Giraudet
1,2, Carole Mign´e
1,2, Maude Gerbaix
4, Lore Metz
4,
Daniel Courteix
4, Christelle Guillet
1,2and Yves Boirie
1,2,51French National Institute for Agricultural Research (INRA), UMR 1019, UNH, CRNH Auvergne, F-63000 Clermont-Ferrand, France 2Clermont University, Universit´e d’Auvergne, Unit´e de Nutrition Humaine, BP 10448, F-63000 Clermont-Ferrand Cedex 1, France 3University Hospital (CHU) Clermont-Ferrand, Service Anatomie et Cytologie Pathologiques, F-63003 Clermont-Ferrand, France 4Clermont University, Universit´e Blaise Pascal, EA3533, Laboratory of Exercise Physiology, Clermont-Ferrand, France
5University Hospital (CHU) Clermont-Ferrand, Service Nutrition Clinique, F-63003 Clermont-Ferrand, France
Key points
• Prolonged obesity leads to ectopic lipid accumulation in non-adipose tissues, particularly in skeletal muscles, inducing metabolic dysfunctions (reduced glucose uptake, mitochondria dysfunction, lipotoxicity).
• Several studies in humans and rodents have shown that obesity induces a short-term increase in fat-free mass but a long-term decrease in skeletal muscle mass.
• We investigated the mechanisms potentially involved in muscle loss by measuring simultaneously protein synthesis and lipid infiltration in different types of skeletal muscles, during the development of obesity.
• Our results show that protein synthesis rate in glycolytic muscles increased together with muscle mass during the early phase of obesity development, whereas it decreased later. Reduced protein synthesis rate was associated with a high lipid accumulation in glycolytic muscles.
• These results suggest that lipid accumulation in muscles during prolonged obesity is deleterious for amino acid incorporation in skeletal muscle proteins, and thus indirectly for muscle mass.
Abstract The object of the study was to investigate the sequential changes of protein synthesis in skeletal muscle during establishment of obesity, considering muscle typology. Adult Wistar rats were fed a standard diet for 16 weeks (C; n= 14), or a high-fat, high-sucrose diet for 16 (HF16;
n= 14) or 24 weeks (HF24; n = 15). Body composition was measured using a dual-energy X-ray
absorptiometry scanner. The fractional synthesis rates (FSRs) of muscle protein fractions were calculated in tibialis anterior (TA) and soleus muscles by incorporation ofL-13C-valine in muscle protein. Muscle lipid and mitochondria contents were determined using histochemical analysis. Obesity occurred in an initial phase, from 1 to 16 weeks, with an increase in weight (P< 0.05), fat mass (P< 0.001), muscle mass (P < 0.001) and FSR in TA (actin: 5.3 ± 0.2 vs. 8.8 ± 0.5% day−1, C vs. HF16, P< 0.001) compared with standard diet. The second phase, from 16 to 24 weeks, was associated with a weight stabilization, a decrease in muscle mass (P< 0.05) and a decrease in FSR in TA (mitochondrial: 5.6± 0.2 vs. 4.2 ± 0.4% day−1, HF16 vs. HF24, P< 0.01) compared with HF16 group. Muscle lipid content was increased in TA in the second phase of obesity development (P< 0.001). Muscle mass, lipid infiltration and muscle protein synthesis were differently affected, depending on the stage of obesity development and muscle typology. Chronic lipid infiltration in glycolytic muscle is concomitant with a reduction of muscle protein synthesis, suggesting that
muscle lipid infiltration in response to a high-fat diet is deleterious for the incorporation of amino acid in skeletal muscle proteins.
(Resubmitted 15 June 2012; accepted 9 July 2012; first published online 16 July 2012)
Corresponding author C. Guillet: Laboratoire de Nutrition Humaine, 58, rue Montalembert 63009 Clermont-Ferrand
Cedex 1, France. Email: [email protected]
Abbreviations DIO, diet-induced obesity; DXA, dual-energy X-ray absorptiometry; EDL, extensor digitorum longus (muscle); FFM, fat-free mass; FSR, fractional synthesis rate; HDL-C, high-density lipoprotein-cholesterol; HFHSD, high-fat, high-sucrose diet; IMCL, intramyocellular lipid; LAI, lipid accumulation index; MAI, mitochondria accumulation index; NEFA, non-esterified fatty acid; TA, tibialis anterior; TG, triglyceride.
Introduction
Obesity has become a serious public health problem because of its major complications, such as diabetes mellitus, cardiovascular diseases, respiratory failure and cancers (Bray, 2004; Haslam & James, 2005). It is characterized by a dramatic rise in body fat which may contribute to dyslipidaemia, lipotoxicity, insulin resistance and chronic inflammation (Bastard et al. 2006; de Ferranti & Mozaffarian, 2008). Beside increased fat mass, the fat-free mass (FFM) compartment could be modified in relation to obesity establishment. Indeed, FFM has often been reported to be normal or increased (Forbes & Welle, 1983; Hulens et al. 2001; Patterson
et al. 2002), suggesting that exposure to greater weight
bearing and greater mechanical loads may have a physical training-like effect (Hulens et al. 2001; Maffiuletti et al. 2007; Katsanos & Mandarino, 2011) and stimulate FFM anabolism. Interestingly, a misinterpretation of changes in body composition has arisen with confusion between FFM and muscle mass compartments: non-muscle fat-free mass might increase due to an obesity-induced enlargement of several organs like liver, intestine, kidney and heart tissues, whereas muscle mass might not be involved. In genetic models of obesity, a lower muscle mass has been reported (Durschlag & Layman, 1983; Argiles et al. 1999; Fluckey et al. 2000; Hamrick et al. 2004; Kemp et al. 2009; Nilsson et al. 2010) and in diet-induced obesity (DIO) animal models, muscle mass was unchanged despite increasing fat mass (Borst & Conover, 2005; Chanseaume
et al. 2007; Adechian et al. 2009). In obese people, a
lower muscle mass or a lower muscle mass gain with increased body weight has been reported (Janssen et al. 2000; Patterson et al. 2002). Noticeably, muscle alterations such as changes in fibre types (Lillioja et al. 1987; Tanner
et al. 2002; Kemp et al. 2009) and in contractile and
metabolic functions (Simoneau et al. 1995) have also been described in obesity, suggesting that not only muscle mass but also muscle quality may be impaired in obese patients.
Metabolically, muscle mass depends on the turnover rate of overall proteins that constitute skeletal muscle. We
recently showed that obesity-associated insulin resistance can affect not only skeletal muscle glucose metabolism but also muscle protein metabolism (Guillet et al. 2009). Actually, obesity was characterized by a blunted response of mitochondrial protein synthesis to insulin with a reduced post-absorptive total muscle protein synthesis rate (FSR) (Guillet et al. 2009). In addition, a negative relationship has been highlighted between body fat mass and muscle FSR in young and elderly people (Guillet
et al. 2009; Katsanos & Mandarino, 2011), suggesting
that an increase in adipose or ectopic fat mass may affect protein kinetics within skeletal muscle. In obese humans and Zucker rats, studies have reported a decreased (Durschlag & Layman, 1983; Argiles et al. 1999; Fluckey
et al. 2004; Guillet et al. 2009; Nilsson et al. 2010; Katsanos
& Mandarino, 2011) or unchanged (Fluckey et al. 2000; Nilsson et al. 2010) muscle protein synthesis rate in the post-absorptive state. By contrast, in animal models of DIO, studies have reported an increased (Chanseaume
et al. 2007) or unchanged (Anderson et al. 2008) FSR in
the post-absorptive state. In the genetically obese animal or the obese patient, studies have all been performed after long-term obesity. In contrast, DIO studies were mostly realized over a relatively short time period and the exposure time to obesity has never been considered with regard to muscle protein metabolism. We hypo-thesized that DIO may provoke changes in protein metabolism differentially during obesity development. Additionally, in DIO studies different muscles have been used (soleus, tibialis anterior, extensor digitorum longus (EDL), gastrocnemius) and the muscle fibre composition was not considered even though oxidative and glycolytic fibres have different insulin sensitivity not only for glucose but also for protein metabolism (Castellino et al. 1987; Lillioja et al. 1987; Louard et al. 1992; Bassel-Duby & Olson, 2006; Guillet et al. 2009). DIO may also differentially affect protein synthesis in glycolytic and oxidative muscles. Therefore, we chose to analyse the sequential changes of protein synthesis in two types of skeletal muscles during the establishment of obesity in a model of prolonged diet-induced obesity.
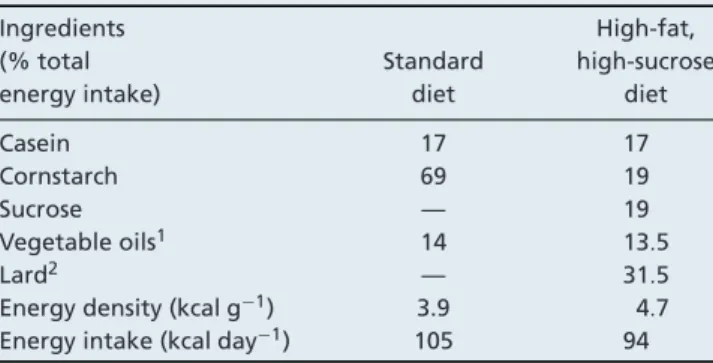
Table 1. Composition of the experimental diets
Ingredients High-fat,
(% total Standard high-sucrose
energy intake) diet diet
Casein 17 17
Cornstarch 69 19
Sucrose — 19
Vegetable oils1 14 13.5
Lard2 — 31.5
Energy density (kcal g−1) 3.9 4.7 Energy intake (kcal day−1) 105 94 All diets were developed by INRA in Jouy-en-Josas and were similarly enriched in vitamins, fibres (cellulose) and minerals. 1Vegetable oils are 50% peanut oil and 50% canola seed oil. 2Lard is rich in saturated (40%) and monounsaturated (44%) fatty acids.
Methods
Animals and experimental procedures
Experiments were carried out according to guidelines in the care and use of animals and approved by the ethical committee for animal experimentation (CREFA, Auvergne CE1-09). Forty-three adult male Wistars rats (∼500 g), were purchased from CERJ Janvier (Le Genest St Isle, France), individually housed with free access to water, maintained under standard conditions (inverted 12:12 h light–dark cycle with lights out at 08.00 h, controlled-temperature room 20◦C to 22◦C) and weighted every week. After 1 week of acclimatization, animals were randomly divided into three groups: one group fed a standard diet (17% proteins, 14% lipids and 69% carbohydrates) for 16 weeks (C (n= 14)) and two groups fed a high-fat, high-sucrose diet (HFHSD) (17% proteins, 45% lipids and 38% carbohydrates), for 16 or 24 weeks (HF16 (n= 14) and HF24 (n = 15)). The daily food intake was measured then diets were distributed at a dose corresponding to 90% of the measured food intake, to be sure that the entire ration is eaten (Table 1). Energy density was significantly increased in HFHSD compared with standard diet, but energy intake was not significantly different between rats fed a control or high-fat, high-sucrose diet (P= NS) because food intake in the Wistar rats was adjusted according to the energy density of the diet. All rats were housed in the same type of cage and their living space (very small) did not allow intense physical activity as to induce changes in muscle mass.
Body composition
Total body composition was measured 6 days before killing using a dual-energy X-ray absorptiometry (DXA) scanner
with an internal adapted collimator for small animal measurements (QDR 4500, HOLOGIC, Roissy Charles de Gaulle, France). All scans were analysed using the Hologic QDR Software (version 12.0). To assess animals muscle mass, the composition of all four paws was analysed and appendicular fat-free mass was measured.
Measurement of in vivo muscle protein synthesis Reagents were obtained from Sigma Chemical (St Louis, MO, USA) and L-13C-valine (99 atom% excess)
was obtained from Eurisotop France (Saint-Aubin, France). Muscle protein synthesis rates of specific fractions were assessed in tibialis and soleus muscles by using the flooding-dose method (Chanseaume et al. 2007). After an overnight fast, rats were injected sub-cutaneously withL-13C-valine (300μmol (100 g body)−1).
The incorporation time was 50 min. After anaesthesia by inhalation of 5% isoflurane and oxygen for 3 to 5 min, rats were killed by decapitation, blood was collected and plasma and serum samples were frozen at −80◦C until analysis. Soleus and tibialis anterior muscles of both legs were quickly excised, weighed, frozen in liquid nitrogen and stored at−80◦C. Perirenal, peri-epididymal and sub-cutaneous fat tissues were removed, weighed, frozen in liquid nitrogen and stored at−80◦C.
Analytical method. A 250 mg piece of soleus or tibialis
anterior was used to isolate mixed, myosin, actin and mitochondria proteins as described previously (Guillet
et al. 2004c; Zangarelli et al. 2006). Muscle samples
were homogenized in an ice-cold buffer, using a Potter-Elvehjem homogenizer. A fraction of the homo-genate was collected to measure total muscle protein synthesis rates. The rest of the homogenate was centrifuged (2000 g, 10 min, 4◦C) and the pellet containing fibrillar protein was collected for purification of myo-sin and actin as described previously (Zangarelli et al. 2004). The supernatant was centrifuged at 7000 g and the new pellet containing mitochondria was collected and prepared as described previously (Guillet et al. 2004c). After protein hydrolysis (6N HCl, 110◦C, 24 h), amino
acids were derivatized, and measurement ofL-13C-valine
enrichment in hydrolysed proteins was performed using gas chromatography–combustion–isotope ratio mass spectrometry (Gas System; Fisons Instruments, VG Iso-tech, Middlewich, UK).L-13C-valine enrichments in tissue fluid were assessed using a gas chromatograph–mass spectrometer (Hewlett-Packard 5971A; Hewlett-Packard Co., Palo Alto, CA, USA) and used as precursor pool enrichment for the calculations of the fractional synthesis rates (FSRs).
Calculations. FSRs were calculated as previously described (Guillet et al. 2004c). FSRs of mixed proteins and protein fractions (actin, myosin, mitochondrial proteins) were calculated using the following equation:
FSR= (Ei × 100)/(EP × t) (1) where Ei represents the enrichment as atom percentage excess of [13C] derived from valine from proteins at time
t (minus basal enrichment); EP is the mean enrichment
in the precursor pool (tissue fluidL-13C-valine); t is the incorporation time in day. Data are expressed as per cent per day.
Plasma lipids and hormones
Total cholesterol, triglycerides (TGs), HDL-cholesterol (HDL-C), non-esterified fatty acids (NEFAs) concentrations were determined by using Konelab20 (Thermo Electron Corporation) and Konelab system reagents (Thermo Fisher Scientific, Vantaa, Finland). Plasma insulin, leptin and adiponectin concentrations were measured using an ELISA kit (Millipore Corporate Headquarters, Billerica, MA, USA).
Histochemical analysis
The method was adapted from Goodpaster et al. (2000). Lipid content was determined by light microscopy on 10-μm-thick transverse sections of muscles prepared in a cryostat. Lipid staining was performed using Sudan black dye that stains neutral lipid with a black tint. Cryosections were rinsed in 70% ethanol for 10 s and immersed in a working solution of Sudan black (Sudan black B powder (Sigma-Aldrich, Saint-Quentin Fallavier, France) diluted in 70% ethanol until saturation, kept stirred for 1 h and incubated at 56◦C for 1.5 h just before using. Slides were rinsed in demineralized water, 70% ethanol, and again in demineralized water before being immersed in Mayer haematoxylin solution (Diapath, Martinengo, Italy) for 5 min. Slides were rinsed with water and covered with a coverslip using Faramount (Dako, Glostrup, Denmark) as an aqueous mounting medium before microscopy. An Olympus light microscope was used to examine the stained muscle sections using a 40× objective and bright field settings. Images were digitally captured using an Olympus optica DP50-CV camera. Six contiguous fields of view within the muscle section were quantitatively analysed for lipid or mitochondria content in a blinded manner. The area occupied by lipid or mitochondria staining in at least 15 contiguous fibres per field was measured with Image J software (http://rsbweb.nih.gov/ij/). Data were expressed as area (square centimeters) of staining per area of the image field. The lipid accumulation index (LAI) was calculated as: total area occupied by lipid droplets of
muscle fibre × 100/total cross-sectional area of muscle fibre. The LAI was calculated for each of six fields within the section, and a mean LAI was then calculated for each animal. Three to five rats per group were studied.
Statistical analysis
Values are presented as means± SEM. Statistical analyses were performed using Statview, version 5.0 (SAS Institute, Cary, NC, USA). Analysis of variance (ANOVA) was performed to test the effect of the experimental nutritional conditions on all parameters measured in this study. When a significant effect was detected, differences among individual means were assessed with Fisher’s protected least significant difference post hoc test to determine pair-wise differences. The level of significant difference was set at P< 0.05 for all statistical tests.
Results
Body weight, body composition, muscle mass and adipose tissue mass
Body weight was significantly higher in the HF16 group than in control group C (733± 13 vs. 648 ± 16 g,
P< 0.01). The difference began to be significant from
the first week of diet modification. After eight additional weeks of HFHSD, body weight was unchanged (HF24
vs. HF16: 770± 22 vs. 733 ± 13 g, P = NS) (Table 2).
Body weight increased significantly during the first 16 weeks of HFHSD, and then stabilized during the eight additional weeks. Fat mass was significantly higher (+33.6%) in the HF16 group than in control group C (235± 13 vs. 156 ± 9 g, P < 0.001), and continued to increase (+15%) during the eight additional weeks of HFHSD (HF24 vs. HF16: 276± 10 vs. 235 ± 13 g,
P< 0.01) (Table 2). Peri-epididymal and perirenal adipose
tissues were very significantly increased in HF16 group compared with C group (HF16 vs. C: 26.4± 1.3
vs. 15.7± 0.7 g, P < 0.001 (+68%) and 34.5 ± 2.0 vs.
12.6± 0.9 g, P < 0.001 (+174%), respectively). Only peri-renal adipose tissues continued to increase weakly in the HF24 group (HF24 vs. HF16: 44.6± 2.3 vs. 34.5 ± 2.0 g,
P< 0.001 (+29%)). Subcutaneous adipose tissue mass
was not increased in HF16 group compared with C group but was increased in HF24 group compared with HF16 (14.3± 1.2 vs. 9.3 ± 1.1 g, P < 0.01 (+35%)) (Table 2). Fat-free mass was unchanged between groups. Appendicular fat-free mass, calculated from DXA data and used to estimate muscle mass, was significantly increased by 13.8% in HF16 group compared with C group (HF16 vs. C: 87.0± 1.0 g vs. 75.0 ± 1.9 g, P < 0.001) but was significantly decrease by 8.6% in HF24 group
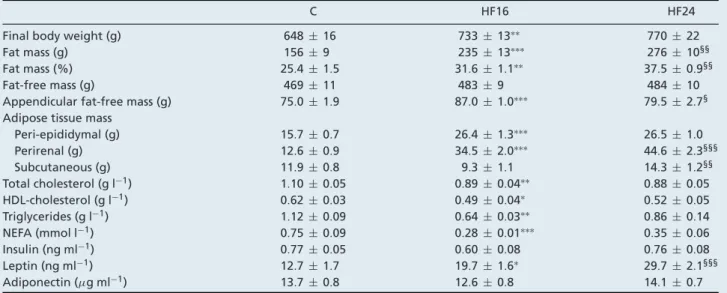
Table 2. Physiological and biological parameters in rats during 16 weeks of control diet (C) or 16 (HF16) or 24 weeks (HF24) of a high-fat, high-sucrose diet
C HF16 HF24
Final body weight (g) 648± 16 733± 13∗∗ 770± 22
Fat mass (g) 156± 9 235± 13∗∗∗ 276± 10§§
Fat mass (%) 25.4 ± 1.5 31.6 ± 1.1∗∗ 37.5 ± 0.9§§
Fat-free mass (g) 469± 11 483± 9 484± 10
Appendicular fat-free mass (g) 75.0 ± 1.9 87.0 ± 1.0∗∗∗ 79.5 ± 2.7§ Adipose tissue mass
Peri-epididymal (g) 15.7 ± 0.7 26.4 ± 1.3∗∗∗ 26.5 ± 1.0 Perirenal (g) 12.6 ± 0.9 34.5 ± 2.0∗∗∗ 44.6 ± 2.3§§§ Subcutaneous (g) 11.9 ± 0.8 9.3 ± 1.1 14.3 ± 1.2§§ Total cholesterol (g l−1) 1.10 ± 0.05 0.89 ± 0.04∗∗ 0.88 ± 0.05 HDL-cholesterol (g l−1) 0.62 ± 0.03 0.49 ± 0.04∗ 0.52 ± 0.05 Triglycerides (g l−1) 1.12 ± 0.09 0.64 ± 0.03∗∗ 0.86 ± 0.14 NEFA (mmol l−1) 0.75 ± 0.09 0.28 ± 0.01∗∗∗ 0.35 ± 0.06 Insulin (ng ml−1) 0.77 ± 0.05 0.60 ± 0.08 0.76 ± 0.08 Leptin (ng ml−1) 12.7 ± 1.7 19.7 ± 1.6∗ 29.7 ± 2.1§§§ Adiponectin (μg ml−1) 13.7 ± 0.8 12.6 ± 0.8 14.1 ± 0.7
Values are means± SEM. See Animals and experimental procedures for description of 3 groups.∗represent significant difference between HF16 and N16 groups:∗P< 0.05;∗∗P< 0.01;∗∗∗P< 0.001.§represent significant difference between HF24 and HF16 groups:§P< 0.05;§§P< 0.01;§§§P< 0.001. NEFA, non-esterified fatty acid.
compared with HF16 group (HF24 vs. HF16: 79.5± 2.7 g
vs. 87.0± 1.0 g, P < 0.05) (Table 2).
Blood parameters
In the fasting state, plasma lipid parameters of HF16 group were decreased compared with C group (total cholesterol: P< 0.01; HDL-C: P < 0.05; TG: P < 0.01; NEFA: P< 0.001) (Table 2). Within eight additional weeks of HFHSD, lipids parameters stabilized. For hormonal parameters, leptin was significantly higher in HF16 group than in control group (HF16 vs. C: 19.7± 1.6 vs. 12.7 ± 1.7 ng ml−1, P< 0.05) and increased dramatically in HF24 group (HF24 vs. HF16: 29.7± 2.1 vs. 19.7± 1.6 ng ml−1, P< 0.001). Insulin and adiponectin were unchanged with HFHSD (Table 2).
Skeletal muscle protein synthesis
In glycolytic tibialis anterior muscle, the FSR of mixed proteins (FSRpt) was not significantly different in HF16 group compared with controls, then was significantly reduced by 26% in HF24 group compared with HF16 group (HF24 vs. HF16: 3.7± 0.3 vs. 5.0 ± 0.2% day−1,
P< 0.01) (Fig. 1A). FSR of myofibrillar proteins (FSRa for
actin and FSRm for myosin) was significantly increased by 66% and 136%, respectively, in HF16 group compared with C (FSRa: 8.8± 0.5 vs. 5.3 ± 0.2% day−1, P< 0.001; FSRm: 5.9± 0.6 vs. 3.0 ± 0.5% day−1, P< 0.01), then stabilized between HF16 and HF24 (Fig. 1C and D). FSR of mitochondrial proteins (FSRmito) was significantly
increased by 20% in HF16 compared with C groups (FSRmito: 5.6± 0.2 vs. 4.5 ± 0.3% day−1, P< 0.05), then significantly decreased by 25% in HF24 group compared with HF16 (FSRmito: 4.2± 0.4 vs. 5.6 ± 0.2% day−1,
P< 0.01) (Fig. 1B). In the oxidative soleus muscle no
differences were observed between groups for all protein fractions (Fig. 1E to H).
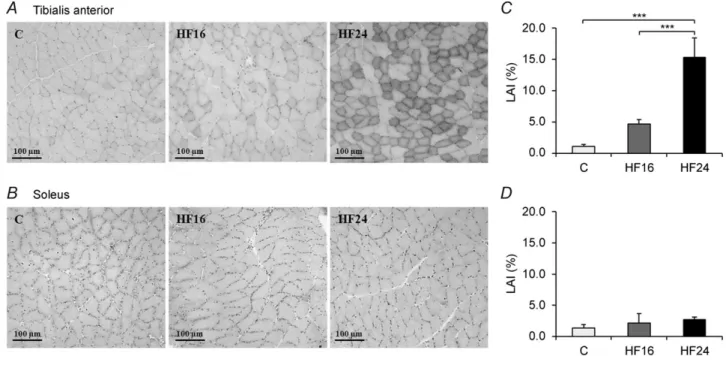
Muscle lipid content
Sudan black staining of tibialis anterior and soleus muscle fibres was carried out in C, HF16 and HF24 groups (Fig. 2A and B). In glycolytic tibialis anterior muscle, LAI was not significantly different between C and HF16 groups but LAI was 3-fold higher in HF24 group compared with HF16 group (15.4± 3.1 vs. 4.1 ± 0.6%, P < 0.001) (Fig. 2C). In oxidative soleus muscle, LAI was not significantly different between groups (Fig. 2D). We observed a not significant (P= 0.12) correlation between FSR and LAI (data not shown). These measurements were made on a limited number of rats and therefore the power of the statistical tests to assess correlations between FSR and LAI is too small to have any significant effect.
Discussion
In the present study, rats fed with the HFHSD for 16 weeks displayed significant increase in weight (+12%), fat mass (+33%) and visceral fat mass (perirenal and peri-epididymal fat mass) (∼2-fold increase) compared with controls. A gradual increase in body weight was
observed during the first 16 weeks of HFHSD, followed by a stabilization of the body weight from 16 to 24 weeks of HFHSD, suggesting a transition between two phases of obesity development. Body fat mass increased significantly during the first phase of obesity development (+33% for 16 weeks), then continued to increase, during a second phase (+15% for 8 weeks). Interestingly, visceral adipose tissues, i.e. perirenal and peri-epididymal adipose tissues, expanded dramatically during the first phase of
obesity developement (respectively+174% and +68%). However, their expansion was reduced or stopped in the second phase (perirenal adipose tissue: +29% between HF16 and HF24 groups; no change in peri-epididymal adipose tissue), despite a constant dietary intake. The start of the sub-cutaneous adipose tissue growth (+35% in 8 weeks) during the second phase of obesity development may compensate the absence of peri-epididymal adipose tissue growth, but not the reduced increase of visceral
Figure 1. Fractional synthesis rate (FSR) in tibialis anterior and soleus muscle measured by incorporation ofL-[13C]-valine
Total (A), mitochondrial (B), actin (C) and myosin (D) fractional synthesis rate in tibialis anterior muscle rats. Total (E), mitochondrial (F), actin (G) and myosin (H) fractional synthesis rate in soleus muscle rats. Values are mean± SEM. ∗P< 0.05;∗∗P< 0.01;∗∗∗P< 0.001.
adipose tissue. These findings suggest that the second phase of obesity development is associated with a failure of adipose tissue expandability, particularly a failure in visceral adipose tissue expandability. Indeed, adipose tissue expandability in response to positive energy balance has been considered traditionally as an adaptive process (Slawik & Vidal-Puig, 2007). However, recent evidence suggests that the expandability of adipose tissue is not an unlimited process and that a failure in adipose tissue expansion can precede the metabolic complications of established obesity (Slawik & Vidal-Puig, 2007; Virtue & Vidal-Puig, 2010). So, in our study, the slowing of adipose tissue gain may attest a reduced capacity for lipid storage of adipose tissue, implying that fat overconsumption induces a higher ectopic fat deposition in peripheral tissues such as in skeletal muscle.
With increased body weight and fat mass, it is often reported in obesity an increased or unchanged fat-free mass (Forbes & Welle, 1983; Hulens et al. 2001; Patterson
et al. 2002). From our data, it was crucial to define changes
not only in whole fat-free mass but also in muscle mass. Indeed, total fat-free mass of animals was unchanged at 16 and 24 weeks of HFHSD. However, analysis by DXA of appendicular fat-free mass has enabled identification of specific changes in muscle mass depending on the obesity development phase (Heymsfield et al. 1990; Kim et al. 2002). During the first phase of obesity development, we showed an increase in muscle mass (+13.8%) whereas after switching to the second phase, muscle mass decreased (−8.6%). This suggests that the onset of obesity might
be an anabolic stimulus to skeletal muscle, because of increased body weight and exposure to greater mechanical loads which may have a physical training effect and may promote anabolism together with hyperinsulinaemia. However, when obesity continues, chronic exposure to exogenous and endogenous lipid overload, probably due to the saturated storage capacity of adipose tissue, seemed to be harmful for muscle mass. So these observations highlight the importance of characterizing the changes occurring in skeletal muscle protein metabolism during the development of obesity.
Skeletal muscle protein mass results from the balance between protein synthesis and breakdown rate. In the present study, muscle gain during the first phase of obesity development was illustrated by an increase in muscle protein synthesis rate, particularly an increase in myofibrillar and mitochondrial protein synthesis rates, in tibialis anterior muscle. A decrease in total muscle mass during the second phase of obesity development was illustrated by a decreased rate of total muscle protein synthesis, particularly a decrease in mitochondrial protein synthesis rate, in the same muscle. However, the modifications observed for muscle protein synthesis rates in tibialis anterior were not combined with changes in muscle mass. Indeed, no difference in tibialis anterior weight was observed during the two phases of obesity (data not shown). Since we clearly observed an increase in lipid content within tibialis anterior, muscle weight by itself may have been misled by the weight of lipids within this muscle. Interestingly, the decline in mixed
Figure 2. Muscle lipid infiltration measured by Sudan black dye
An example of lipid staining in tibialis anterior (A) and soleus (B) muscles for the groups C, HF16 and HF24. Lipid quantification in tibialis anterior (C) and soleus (D) muscles.∗∗∗P< 0.001. LAI, lipid accumulation index.
protein muscle FSR could be partly explained by a decrease in mitochondrial protein synthesis. We have shown previously that mitochondrial protein synthesis was specifically affected during obesity (Guillet et al. 2009). Muscle mitochondrial alterations were often reported during obesity in association with lipid infiltration (Kaneko et al. 2011). It is not surprising therefore that the protein fraction primarily affected in this situation is the mitochondrial protein fraction. On the other hand, the decline in mixed protein muscle FSR could be also partly explained by a decrease in sarcoplasmic protein synthesis, since it might be differentially regulated (Boirie et al. 2001), but this parameter was not measured here. Thus, although no difference was noted in tibialis anterior weight between the two phases of obesity, the quality of tibialis anterior was impaired during the establishment of obesity as illustrated by modifications in muscle protein synthesis rates.
Impaired protein metabolism in skeletal muscle has already been observed in obesity but appeared different depending on the models used (Guillet et al. 2011). DIO studies showed muscle protein synthesis rate increased or unchanged (Estornell et al. 1995; Chanseaume et al. 2007), whereas obese humans or genetically obese animal models showed a decreased or unchanged muscle protein synthesis rate (Durschlag & Layman, 1983; Argiles et al. 1999; Fluckey et al. 2000, 2004; Nilsson et al. 2010; Katsanos & Mandarino, 2011). Indeed, after 4 weeks of a high fat diet, one study showed an increase in tibialis anterior FSR and no change in gastrocnemius FSR (Estornell et al. 1995). After 6 weeks of a high-fat, high-sucrose diet, another study showed an increase of total protein synthesis rate in muscles (Chanseaume et al. 2007). By contrast, in obese Zucker rats, total muscle protein synthesis rate was significantly decreased at 44 days (Durschlag & Layman, 1983) and 12 weeks of age (Argiles et al. 1999). At 4 months of age obese Zucker rats presented a significant decrease in myofibrillar protein synthesis rate and no change in total, cytosolic and mitochondrial protein synthesis rate (Nilsson et al. 2010). In obese humans, a reduction of protein synthesis rate in skeletal muscle has been reported in the post-absorptive state (Guillet et al. 2009). Thus, DIO studies, which are mostly realized over a relatively short time (4 to 6 weeks), showed muscle protein turnover alterations at the beginning of obesity onset (increase muscle protein turnover). By contrast, studies performed in obese humans or genetically obese animal models showed a decreased muscle protein turnover when obesity was established for a long time. Our results illustrate for the first time the sequential changes between the initial phase of obesity development, where we observe an anabolic impact of obesity, and a second phase where we observe an ‘anabolic resistance’ of muscles.
Previous reports have demonstrated that anabolic resistance exists in various conditions such as ageing (Volpi
et al. 2000; Guillet et al. 2004a,b; Cuthbertson et al. 2005)
or catabolic situations (Rennie, 2009). In the case of obesity, very few experiments in animals or in humans suggest such metabolic disturbances. We have shown pre-viously that anabolic factors simulating meal intake such as insulin and amino acids were not able to activate muscle protein synthesis, especially mitochondrial muscle protein synthesis, in obesity to the same extent as in non-obese subjects (Guillet et al. 2009). Only few studies in genetically obese animals have shown the same anabolic resistance (Dunn & Hartsook, 1980; Reeds et al. 1982; Shargill et al. 1984; Chan et al. 1985; Friedman et al. 1990; Weinstein
et al. 2001; Anderson et al. 2008) and further studies are
needed to better characterize this phenomenon.
After 16 and 24 weeks of HFHSD, we showed an alteration of protein synthesis in glycolytic tibialis anterior muscle but no changes in oxidative soleus muscle. So, only glycolytic muscle metabolism seems to be impaired during the first step of obesity. Consequently, protein metabolism response to obesity in skeletal muscle is fibre-type dependent. Soleus and tibialis anterior are composed of different types of fibres. Soleus muscle contains mostly type I fibres, which are rich in mitochondria and use fat for their metabolism. Tibialis anterior is composed mostly of type IIx fibres, which contain fewer mitochondria and use mainly a glycolytic metabolism. So soleus muscle is probably more able to manage an excessive influx of fatty acids at the beginning of obesity than tibialis anterior muscle which is first altered. Interestingly, muscle protein metabolism alterations might be different when obesity is present for a longer time. Indeed, in the study by Nilsson
et al. (2010), no change in total protein synthesis rate
was observed in the mixed muscle gastrocnemius in obese Zucker rats. However, Fluckey et al. (2004) showed in gastrocnemius of obese Zucker rats a decrease in protein synthesis in red fibres (oxidative fibres), and not in white fibres (glycolytic fibres) compared with lean controls. Thus, in this genetic model of obesity, oxidative fibre alteration in skeletal muscle is probably correlated with the decrease in type I fibres frequently reported during long-term obesity (Tanner et al. 2002).
In the present study, modifications in muscles suggest that prolonged obesity has a negative impact on skeletal muscle mass by arresting the initial ‘anabolic’ action of the diet-induced obesity, but the mechanisms under-lying these modifications still remain unknown. One mechanism to explain muscle protein synthesis changes during obesity may be muscle lipotoxicity induced by ectopic lipid deposition. Indeed, recent findings showed that the lack of adipose tissue expandability results in a net increase of lipid flux to non-adipose organs and an ectopic lipid accumulation in cells, such as hepatocytes, β-cells and myocytes (Virtue & Vidal-Puig, 2010). Intramyocellular lipid deposition was correlated with insulin resistance (Krssak et al. 1999; Perseghin
since lipid derivative species, such as diacylglycerol (DAG) and ceramides, induce insulin resistance (Schmitz-Peiffer
et al. 1999; Adams et al. 2004; Samuel et al. 2010;
Carobbio et al. 2011). Some intermediates of the insulin signalling pathway were implicated in the control of protein translation initiation (mTOR, p70S6K, 4EBP1 et eIF2B) (Bodine et al. 2001; Hay & Sonenberg, 2004). So, lipid accumulation in muscle could have an adverse effect on protein synthesis. In the present study we have shown that adipose tissue expandability was slowed after 16 weeks of HFHSD, but lipid infiltration dramatically increased between 16 and 24 weeks of HFHSD in tibialis anterior muscle (P< 0.001). Interestingly, after 24 weeks of HFHSD, the significant increase in lipid infiltration observed in tibialis anterior muscle was associated with protein metabolism impairment in the same muscle. We previously reported that post-absorptive muscle protein synthesis was negatively related to fat mass (Guillet et al. 2009). Excessive visceral adipose tissue is associated with increased delivery of free fatty acids (FFA), leading to increased plasma levels. A short-term elevation of plasma FFAs is able to reduce basal muscle protein synthesis by altering the activation of factors involved in the control of protein translation initiation (Lang, 2006). Consequently, a possible mechanism leading to protein synthesis reduction may be an alteration of insulin signalling by the lipid derivative species, resulting in reduced protein translation.
Lipid storage within the muscle seems to occur early and before the appearance of the markers of metabolic syndrome in this model. Indeed, we did not observe an increase in plasma triglycerides, NEFA and total cholesterol, as is often described in prolonged obesity (Pietilainen et al. 2007). High-fat diets have often been shown to cause dyslipidaemia in previous studies, but there has been a large variability in the intensity of changes, with an increase, no change or a decrease in plasma triglycerides, total cholesterol and NEFA according to studies (Sinitskaya et al. 2007; Sridhar
et al. 2008; Vinayagamoorthi et al. 2008; Zaman et al.
2011). The differences in nutritional interventions, such as diet composition and interventional duration, have complicated the comparisons of these studies. However, in our study, the small amount of dietary cholesterol in lard could be a possible explanation for the small reduction in plasma total cholesterol which is observed after a high-fat diet. It was shown that additional dietary fat, whatever its nature, had no effect on plasma cholesterol concentration in the absence of dietary cholesterol in a study conducted in hamsters (Sessions & Salter, 1994). We put forward the hypothesis that the reduction of basal NEFA and triglyceride concentrations could be explained by a higher adipose and ectopic tissue triglyceride storage, which capture a large amount of plasma NEFA (Benhizia
et al. 1994; Oosterveer et al. 2009) and an increase in
lipid uptake by skeletal muscles for oxidation (Slawik & Vidal-Puig, 2007).
In conclusion, muscle and adipose tissue mass, intra-myocellular lipids (IMCL) and muscle protein synthesis were differently affected according to the stage of obesity development. IMCL and muscle protein synthesis were also differently affected depending on muscle typology. The second phase of obesity development was associated with a reduction of adipose tissue expandability and an increase of IMCL in glycolytic muscle, which is concomitant with lower protein synthesis stimulation firstly observed with the high-fat, high-sucrose diet. These data suggest that IMCL accumulation is deleterious for the incorporation of amino acids in newly synthetized skeletal muscle proteins and could contribute to the loss of skeletal muscle mass and quality. Moreover, this process, especially if co-morbidities of obesity occur, could lead ultimately to sarcopenic obesity, which is defined by a combination of excess weight and reduced muscle mass or strength (Zamboni et al. 2008). It could be inter-esting to see if strategies used to treat obesity, for example caloric restriction and exercise, may reduce muscle lipid infiltration and change the specific protein metabolism modifications observed in skeletal muscle during obesity.
References
Adams JM 2nd, Pratipanawatr T, Berria R, Wang E, DeFronzo RA, Sullards MC & Mandarino LJ (2004). Ceramide content is increased in skeletal muscle from obese insulin-resistant humans. Diabetes 53, 25–31.
Adechian S, Giardina S, Remond D, Papet I, Buonocore D, Gaudichon C, Dardevet D, Marzatico F & Mosoni L (2009). Excessive energy intake does not modify fed-state tissue protein synthesis rates in adult rats. Obesity (Silver Spring)
17, 1348–1355.
Anderson SR, Gilge DA, Steiber AL & Previs SF (2008). Diet-induced obesity alters protein synthesis: tissue-specific effects in fasted versus fed mice. Metabolism 57, 347– 354.
Argiles JM, Busquets S, Alvarez B & Lopez-Soriano FJ (1999). Mechanism for the increased skeletal muscle protein degradation in the obese Zucker rat. J Nutr Biochem 10, 244–248.
Bassel-Duby R & Olson EN (2006). Signaling pathways in skeletal muscle remodeling. Annu Rev Biochem 75, 19–37.
Bastard JP, Maachi M, Lagathu C, Kim MJ, Caron M, Vidal H, Capeau J & Feve B (2006). Recent advances in the
relationship between obesity, inflammation, and insulin resistance. Eur Cytokine Netw 17, 4–12.
Benhizia F, Hainault I, Serougne C, Lagrange D, Hajduch E, Guichard C, Malewiak MI, Quignard-Boulange A, Lavau M & Griglio S (1994). Effects of a fish oil-lard diet on rat plasma lipoproteins, liver FAS, and lipolytic enzymes. Am J
Bodine SC, Stitt TN, Gonzalez M, Kline WO, Stover GL, Bauerlein R, Zlotchenko E, Scrimgeour A, Lawrence JC, Glass DJ & Yancopoulos GD (2001). Akt/mTOR pathway is a crucial regulator of skeletal muscle hypertrophy and can prevent muscle atrophy in vivo. Nat Cell Biol 3, 1014–1019. Boirie Y, Short KR, Ahlman B, Charlton M & Nair KS (2001). Tissue-specific regulation of mitochondrial and cytoplasmic protein synthesis rates by insulin. Diabetes 50, 2652–2658. Borst SE & Conover CF (2005). High-fat diet induces increased
tissue expression of TNF-alpha. Life Sci 77, 2156–2165. Bray GA (2004). Medical consequences of obesity. J Clin
Endocrinol Metab 89, 2583–2589.
Carobbio S, Rodriguez-Cuenca S & Vidal-Puig A (2011). Origins of metabolic complications in obesity: ectopic fat accumulation. The importance of the qualitative aspect of lipotoxicity. Curr Opin Clin Nutr Metab Care 14, 520–526. Castellino P, Luzi L, Simonson DC, Haymond M & DeFronzo
RA (1987). Effect of insulin and plasma amino acid concentrations on leucine metabolism in man. Role of substrate availability on estimates of whole body protein synthesis. J Clin Invest 80, 1784–1793.
Chan CP, Hansen RJ & Stern JS (1985). Protein turnover in insulin-treated, alloxan-diabetic lean and obese Zucker rats.
J Nutr 115, 959–969.
Chanseaume E, Giraudet C, Gryson C, Walrand S, Rousset P, Boirie Y & Morio B (2007). Enhanced muscle mixed and mitochondrial protein synthesis rates after a high-fat or high-sucrose diet. Obesity (Silver Spring) 15, 853–859. Cuthbertson D, Smith K, Babraj J, Leese G, Waddell T,
Atherton P, Wackerhage H, Taylor PM & Rennie MJ (2005). Anabolic signaling deficits underlie amino acid resistance of wasting, aging muscle. FASEB J 19, 422–424.
de Ferranti S & Mozaffarian D (2008). The perfect storm: obesity, adipocyte dysfunction, and metabolic consequences.
Clin Chem 54, 945–955.
Dunn MA & Hartsook EW (1980). Comparative amino acid and protein metabolism in obese and non-obese Zucker rats.
J Nutr 110, 1865–1879.
Durschlag RP & Layman DK (1983). Skeletal muscle growth in lean and obese Zucker rats. Growth 47, 282–291.
Estornell E, Cabo J & Barber T (1995). Protein synthesis is stimulated in nutritionally obese rats. J Nutr 125, 1309–1315.
Fluckey JD, Cortright RN, Tapscott E, Koves T, Smith L, Pohnert S & Dohm GL (2004). Active involvement of PKC for insulin-mediated rates of muscle protein synthesis in Zucker rats. Am J Physiol Endocrinol Metab 286, E753–E758. Fluckey JD, Pohnert SC, Boyd SG, Cortright RN, Trappe TA &
Dohm GL (2000). Insulin stimulation of muscle protein synthesis in obese Zucker rats is not via a rapamycin-sensitive pathway. Am J Physiol Endocrinol Metab 279, E182–187. Forbes GB & Welle SL (1983). Lean body mass in obesity. Int J
Obes (Lond) 7, 99–107.
Friedman JE, Lemon PW & Finkelstein JA (1990). Effect of exercise and obesity on skeletal muscle amino acid uptake.
J Appl Physiol 69, 1347–1352.
Goodpaster BH, Theriault R, Watkins SC & Kelley DE (2000). Intramuscular lipid content is increased in obesity and decreased by weight loss. Metabolism 49, 467–472.
Guillet C, Delcourt I, Rance M, Giraudet C, Walrand S, Bedu M, Duche P & Boirie Y (2009). Changes in basal and insulin and amino acid response of whole body and skeletal muscle proteins in obese men. J Clin Endocrinol Metab 94,
3044–3050.
Guillet C, Masgrau A & Boirie Y (2011). Is protein metabolism changed with obesity? Curr Opin Clin Nutr Metab Care 14, 89–92.
Guillet C, Prod’homme M, Balage M, Gachon P, Giraudet C, Morin L, Grizard J & Boirie Y (2004a). Impaired anabolic response of muscle protein synthesis is associated with S6K1 dysregulation in elderly humans. FASEB J 18, 1586– 1587.
Guillet C, Zangarelli A, Gachon P, Morio B, Giraudet C, Rousset P & Boirie Y (2004b). Whole body protein
breakdown is less inhibited by insulin, but still responsive to amino acid, in nondiabetic elderly subjects. J Clin Endocrinol
Metab 89, 6017–6024.
Guillet C, Zangarelli A, Mishellany A, Rousset P, Sornet C, Dardevet D & Boirie Y (2004c). Mitochondrial and sarcoplasmic proteins, but not myosin heavy chain, are sensitive to leucine supplementation in old rat skeletal muscle. Exp Gerontol 39, 745–751.
Hamrick MW, Pennington C, Newton D, Xie D & Isales C (2004). Leptin deficiency produces contrasting phenotypes in bones of the limb and spine. Bone 34, 376–383.
Haslam DW & James WP (2005). Obesity. Lancet 366, 1197–1209.
Hay N & Sonenberg N (2004). Upstream and downstream of mTOR. Genes Dev 18, 1926–1945.
Heymsfield SB, Smith R, Aulet M, Bensen B, Lichtman S, Wang J & Pierson RN Jr (1990). Appendicular skeletal muscle mass: measurement by dual-photon absorptiometry. Am J
Clin Nutr 52, 214–218.
Hulens M, Vansant G, Lysens R, Claessens AL, Muls E & Brumagne S (2001). Study of differences in peripheral muscle strength of lean versus obese women: an allometric approach. Int J Obes Relat Metab Disord 25, 676–
681.
Janssen I, Heymsfield SB, Wang ZM & Ross R (2000). Skeletal muscle mass and distribution in 468 men and women aged 18–88 yr. J Appl Physiol 89, 81–88.
Kaneko S, Iida RH, Suga T, Fukui T, Morito M & Yamane A (2011). Changes in triacylglycerol-accumulated fiber type, fiber type composition, and biogenesis in the mitochondria of the soleus muscle in obese rats. Anat Rec (Hoboken) 294, 1904–1912.
Katsanos CS & Mandarino LJ (2011). Protein metabolism in human obesity: a shift in focus from whole-body to skeletal muscle. Obesity (Silver Spring) 19, 469–475.
Kemp JG, Blazev R, Stephenson DG & Stephenson GM (2009). Morphological and biochemical alterations of skeletal muscles from the genetically obese (ob/ob) mouse. Int J Obes
(Lond) 33, 831–841.
Kim J, Wang Z, Heymsfield SB, Baumgartner RN & Gallagher D (2002). Total-body skeletal muscle mass: estimation by a new dual-energy X-ray absorptiometry method. Am J Clin
Krssak M, Falk Petersen K, Dresner A, DiPietro L, Vogel SM, Rothman DL, Roden M & Shulman GI (1999).
Intramyocellular lipid concentrations are correlated with insulin sensitivity in humans: a 1H NMR spectroscopy study. Diabetologia 42, 113–116.
Lang CH (2006). Elevated plasma free fatty acids decrease basal protein synthesis, but not the anabolic effect of leucine, in skeletal muscle. Am J Physiol Endocrinol Metab 291, E666–E674.
Lillioja S, Young AA, Culter CL, Ivy JL, Abbott WG, Zawadzki JK, Yki-Jarvinen H, Christin L, Secomb TW & Bogardus C (1987). Skeletal muscle capillary density and fiber type are possible determinants of in vivo insulin resistance in man.
J Clin Invest 80, 415–424.
Louard RJ, Fryburg DA, Gelfand RA & Barrett EJ (1992). Insulin sensitivity of protein and glucose metabolism in human forearm skeletal muscle. J Clin Invest 90, 2348–2354. Maffiuletti NA, Jubeau M, Munzinger U, Bizzini M, Agosti F,
De Col A, Lafortuna CL & Sartorio A (2007). Differences in quadriceps muscle strength and fatigue between lean and obese subjects. Eur J Appl Physiol 101, 51–59.
Moro C, Galgani JE, Luu L, Pasarica M, Mairal A, Bajpeyi S, Schmitz G, Langin D, Liebisch G & Smith SR (2009). Influence of gender, obesity, and muscle lipase activity on intramyocellular lipids in sedentary individuals. J Clin
Endocrinol Metab 94, 3440–3447.
Nilsson MI, Greene NP, Dobson JP, Wiggs MP, Gasier HG, Macias BR, Shimkus KL & Fluckey JD (2010). Insulin resistance syndrome blunts the mitochondrial anabolic response following resistance exercise. Am J Physiol
Endocrinol Metab 299, E466–E474.
Oosterveer MH, van Dijk TH, Tietge UJ, Boer T, Havinga R, Stellaard F, Groen AK, Kuipers F & Reijngoud DJ (2009). High fat feeding induces hepatic fatty acid elongation in mice. PloS One 4, e6066.
Patterson BW, Horowitz JF, Wu G, Watford M, Coppack SW & Klein S (2002). Regional muscle and adipose tissue amino acid metabolism in lean and obese women. Am J Physiol
Endocrinol Metab 282, E931–E936.
Perseghin G, Scifo P, De Cobelli F, Pagliato E, Battezzati A, Arcelloni C, Vanzulli A, Testolin G, Pozza G, Del Maschio A & Luzi L (1999). Intramyocellular triglyceride content is a determinant of in vivo insulin resistance in humans: a 1H-13C nuclear magnetic resonance spectroscopy assessment in offspring of type 2 diabetic parents. Diabetes
48, 1600–1606.
Pietilainen KH, Sysi-Aho M, Rissanen A, Seppanen-Laakso T, Yki-Jarvinen H, Kaprio J & Oresic M (2007). Acquired obesity is associated with changes in the serum lipidomic profile independent of genetic effects – a monozygotic twin study. PloS One 2, e218.
Reeds PJ, Haggarty P, Wahle KW & Fletcher JM (1982). Tissue and whole-body protein synthesis in immature Zucker rats and their relationship to protein deposition. Biochem J 204, 393–398.
Rennie MJ (2009). Anabolic resistance in critically ill patients.
Crit Care Med 37, S398–S399.
Samuel VT, Petersen KF & Shulman GI (2010). Lipid-induced insulin resistance: unravelling the mechanism. Lancet 375, 2267–2277.
Schmitz-Peiffer C, Craig DL & Biden TJ (1999). Ceramide generation is sufficient to account for the inhibition of the insulin-stimulated PKB pathway in C2C12 skeletal muscle cells pretreated with palmitate. J Biol Chem 274,
24202–24210.
Sessions VA & Salter AM (1994). The effects of different dietary fats and cholesterol on serum lipoprotein concentrations in hamsters. Biochim Biophys Acta 1211, 207–214.
Shargill NS, Ohshima K, Bray GA & Chan TM (1984). Muscle protein turnover in the perfused hindquarters of lean and genetically obese-diabetic (db/db) mice. Diabetes 33, 1160–1164.
Simoneau JA, Colberg SR, Thaete FL & Kelley DE (1995). Skeletal muscle glycolytic and oxidative enzyme capacities are determinants of insulin sensitivity and muscle composition in obese women. FASEB J 9, 273–278. Sinitskaya N, Gourmelen S, Schuster-Klein C,
Guardiola-Lemaitre B, Pevet P & Challet E (2007). Increasing the fat-to-carbohydrate ratio in a high-fat diet prevents the development of obesity but not a prediabetic state in rats. Clin Sci (Lond) 113, 417–425.
Slawik M & Vidal-Puig AJ (2007). Adipose tissue expandability and the metabolic syndrome. Genes Nutr 2, 41–45.
Sridhar MG, Vinayagamoorthi R, Arul Suyambunathan V, Bobby Z & Selvaraj N (2008). Bitter gourd (Momordica
charantia) improves insulin sensitivity by increasing skeletal
muscle insulin-stimulated IRS-1 tyrosine phosphorylation in high-fat-fed rats. Br J Nutr 99, 806–812.
Tanner CJ, Barakat HA, Dohm GL, Pories WJ, MacDonald KG, Cunningham PR, Swanson MS & Houmard JA (2002). Muscle fiber type is associated with obesity and weight loss.
Am J Physiol Endocrinol Metab 282, E1191–E1196.
Vinayagamoorthi R, Bobby Z & Sridhar MG (2008). Antioxidants preserve redox balance and inhibit
c-Jun-N-terminal kinase pathway while improving insulin signaling in fat-fed rats: evidence for the role of oxidative stress on IRS-1 serine phosphorylation and insulin resistance. J Endocrinol 197, 287–296.
Virkamaki A, Korsheninnikova E, Seppala-Lindroos A, Vehkavaara S, Goto T, Halavaara J, Hakkinen AM & Yki-Jarvinen H (2001). Intramyocellular lipid is associated with resistance to in vivo insulin actions on glucose uptake, antilipolysis, and early insulin signaling pathways in human skeletal muscle. Diabetes 50, 2337–2343.
Virtue S & Vidal-Puig A (2010). Adipose tissue expandability, lipotoxicity and the Metabolic Syndrome – an allostatic perspective. Biochim Biophys Acta 1801, 338–
349.
Volpi E, Mittendorfer B, Rasmussen BB & Wolfe RR (2000). The response of muscle protein anabolism to combined hyperaminoacidemia and glucose-induced hyperinsulinemia is impaired in the elderly. J Clin Endocrinol Metab 85, 4481–4490.
Weinstein RB, Tritschler HJ & Henriksen EJ (2001). Antioxidant alpha-lipoic acid and protein turnover in insulin-resistant rat muscle. Free RadicBiol Med 30, 383–388. Zaman MQ, Leray V, Le Bloc’h J, Thorin C, Ouguerram K &
Nguyen P (2011). Lipid profile and insulin sensitivity in rats fed with high-fat or high-fructose diets. Br J Nutr 106, S206–S210.
Zamboni M, Mazzali G, Fantin F, Rossi A & Di Francesco V (2008). Sarcopenic obesity: a new category of obesity in the elderly. Nutr Metab Cardiovasc Dis 18, 388–395.
Zangarelli A, Chanseaume E, Morio B, Brugere C, Mosoni L, Rousset P, Giraudet C, Patrac V, Gachon P, Boirie Y & Walrand S (2006). Synergistic effects of caloric restriction with maintained protein intake on skeletal muscle performance in 21-month-old rats: a
mitochondria-mediated pathway. FASEB J 20, 2439–2450. Zangarelli A, Walrand S, Guillet C, Gachon P, Rousset P,
Giraudet C, Picard B & Boirie Y (2004). Centrifugation-based isolation of myosin for measurement of its synthesis rate in small muscle samples. Anal Biochem 327, 55–60.
Authors contributions
S.W., L.M., D.C., Y.B. and C.G. were responsible for conception and design of the experiments. A.M., A.M.-D., H.M., A-M.B.,
S.W., C.Gi., C.M., M.G., L.M., D.C. and C.Gu. made essential contributions to experimental preparations and data analyses. A.M., A.M.-D., S.W., Y.B. and C.Gu. played a crucial role in data interpretation, discussion and writing. All authors approved the final version of the manuscript.
Acknowledgements
The authors thank all members of the Human Nutrition Laboratory of Clermont-Ferrand, the animal facilities and the mass spectrometry core facility of INRA of Clermont-Ferrand/Theix, the department of anatomo-pathology of the CHU of Clermont-Ferrand and the Fondation Coeur et Art`ere that supports this project. The authors have no conflict of interest to declare.
![Figure 1. Fractional synthesis rate (FSR) in tibialis anterior and soleus muscle measured by incorporation of L -[ 13 C]-valine](https://thumb-eu.123doks.com/thumbv2/123doknet/14022322.457496/6.892.128.754.281.993/figure-fractional-synthesis-tibialis-anterior-soleus-measured-incorporation.webp)