Publisher’s version / Version de l'éditeur:
Vous avez des questions? Nous pouvons vous aider. Pour communiquer directement avec un auteur, consultez la première page de la revue dans laquelle son article a été publié afin de trouver ses coordonnées. Si vous n’arrivez pas à les repérer, communiquez avec nous à [email protected].
Questions? Contact the NRC Publications Archive team at
[email protected]. If you wish to email the authors directly, please see the first page of the publication for their contact information.
https://publications-cnrc.canada.ca/fra/droits
L’accès à ce site Web et l’utilisation de son contenu sont assujettis aux conditions présentées dans le site LISEZ CES CONDITIONS ATTENTIVEMENT AVANT D’UTILISER CE SITE WEB.
[Proceedings of ICOE 2018 Normandie], 2018-06-14
READ THESE TERMS AND CONDITIONS CAREFULLY BEFORE USING THIS WEBSITE. https://nrc-publications.canada.ca/eng/copyright
NRC Publications Archive Record / Notice des Archives des publications du CNRC :
https://nrc-publications.canada.ca/eng/view/object/?id=e44686e3-4c56-4de3-a152-302fa80904f0
https://publications-cnrc.canada.ca/fra/voir/objet/?id=e44686e3-4c56-4de3-a152-302fa80904f0
NRC Publications Archive
Archives des publications du CNRC
This publication could be one of several versions: author’s original, accepted manuscript or the publisher’s version. / La version de cette publication peut être l’une des suivantes : la version prépublication de l’auteur, la version acceptée du manuscrit ou la version de l’éditeur.
Access and use of this website and the material on it are subject to the Terms and Conditions set forth at
Assessment of debris mitigation systems for tidal and river turbines
Cornett, Andrew; Provan, Mitchel; Bear, Michael
Assessment of Debris Mitigation Systems
for Tidal and River Turbines
Andrew Cornett*, Mitchel Provan*, Michael Bear** * Ocean, Coastal & River Engineering, National Research Council Canada
**
New Energy Corp.
Abstract- The potential for dangerous interactions with
floating debris is a leading consideration when evaluating potential sites for deployment of hydrokinetic power systems, yet to date, relatively little research effort has been directed towards developing and proving effective devices and systems for protecting turbines from floating debris. This paper presents and discusses results from a series of 1/10 scale model experiments conducted by the National Research Council, Canada, working in collaboration with New Energy Corp, in which the effectiveness of six different debris barriers was assessed in steady flows up to 3 m/s. This research contributes important new knowledge concerning the performance of debris mitigation systems for use with floating hydrokinetic turbines deployed in rivers, estuaries and coastal waters.
Keywords- debris, debris barrier, river turbine, tidal turbine.
I. INTRODUCTION
Hydrokinetic turbine systems deployed in rivers, estuaries or coastal waters are exposed to many hazards that can degrade their operational performance and viability. Harmful interactions with debris, either floating or submerged, are one such hazard that can have serious and costly consequences. Tyler [6] reports that the potential for dangerous interactions with floating debris is a leading consideration when evaluating potential sites for deployment of hydrokinetic power systems. The probability of encountering debris, and the type of debris encountered, varies widely from one place to another and depends on the characteristics of the deployment site and the details of the turbine system. Turbines suspended from floating platforms are vulnerable to impacts by debris floating at or near the surface (see Figure 1), while bottom-mounted systems are clearly more vulnerable to neutrally buoyant debris moving at greater depths. The likelihood that interaction with debris will produce damage or degrade turbine performance is in large part dependent on whether the turbine system has been engineered with debris mitigation in mind. To be considered successful, debris mitigation devices or systems must prevent harmful debris interactions with the turbine rotor
and/or its support structure without diminishing the speed of the flow incident to the turbine rotor.
Figure 1 : Pile up of surface debris at a floating EnCurrent
hydrokinetic turbine deployed at Eagle, Alaska (source: [2])
Woody debris such as logs and branches uprooted and washed downstream during floods and storms are probably the most common type of hazardous debris at many sites. Other types of debris might include nets, trawls and ropes lost during commercial fishery operations as well as flotsam and jetsam thrown overboard from ships or even ice floes or neutrally buoyant sediment-laden ice blocks conveyed downriver and into estuaries and coastal waters during spring floods. Tyler [6] describes some of the mechanisms responsible for the presence of woody debris in rivers and also reviews several types of debris mitigation devices developed to protect engineered structures (but not turbines) in rivers. Toniolo [5] studied the effect of floating debris diversion devices on the hydrodynamic conditions in a river. Johnson et al. [2,3] report on research focused on characterizing river debris and investigating strategies to mitigate the impact of debris on hydrokinetic turbines. A floating V-shaped debris barrier fitted with a rotating cylinder was constructed and tested on the Tanana River near Nenana, Alaska. Klaptocz [4] reports some success with a floating debris mitigation barrier installed during deployment and testing of a floating hydrokinetic power system developed by MAVI Innovations at a site in coastal British Columbia, Canada.
Ensuring that turbine systems can survive repeated encounters with debris is a key requirement for the success and proliferation of hydrokinetic turbine systems in general, and is hence an important area of engineering research. Despite this importance, there has been relatively little research into developing and proving effective devices and systems for protecting hydrokinetic turbines against harmful interactions with floating debris.
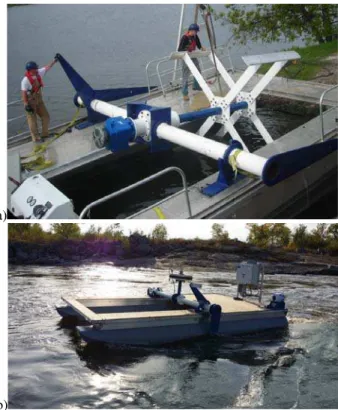
New Energy Corp. develops and markets a series of smaller (up to 250kW) vertical axis 4-bladed hydrokinetic turbines and associated electronic equipment. The larger units are often installed below a twin-hulled floating platform at sites where flow speeds regularly exceed 2 m/s (see Figure 2). Interactions with floating debris have caused problems in several previous New Energy deployments (see for example Figure 1), and developing an effective debris mitigation system is recognized as a priority for New Energy in particular and the broader tidal and river turbine industry in general.
a)
b)
Figure 2 : New Energy vertical axis turbine: a) before deployment;
b) operating in a fast-flowing river.
In 2017 the Ocean, Coastal and River Engineering Research Centre (OCRE) of the Canada’s National Research Council (NRC) initiated an applied research study to assess and improve the performance of debris mitigation systems for use in protecting hydrokinetic turbine systems. This paper presents and discusses the results from a series of 1/10 scale model tests recently completed by NRC as part of this effort. The experiments were conducted by NRC working in collaboration with New Energy Corp.
II. EXPERIMENTS
A series of model experiments at 1/10 scale have been conducted in steady flows to assess the performance of six different debris barrier designs. The experiments were conducted in a 2 m wide by 95 m long by up to 3 m deep wave-current flume located on the NRC research campus in Ottawa, Canada, in which a range of steady flow speeds up to 1 m/s can be generated. Standard Froude scaling principles were applied to relate conditions and values in the physical model to the corresponding conditions and values at full scale.
The experimental setup was designed to replicate typical conditions in a fast-flowing river where smaller hydrokinetic turbines, such as the systems developed by New Energy, are typically deployed. The water depth for these experiments was set to 0.5 m (5 m at full scale), and the model debris barriers were tested in flow speeds up 0.95 m/s (3 m/s at full scale).
A. Model Turbine
A faithful scaled replica of New Energy’s EVG-005 floating platform and EnviroGen vertical-axis 4-bladed turbine (see Figure 2) was fabricated for use in this study. The prototype floating platform is 4.6 m long by 2.9 m wide and comprises a pair of tubular hulls joined together by a rigid work platform. The turbine rotor and PTO system are mounted at opposite ends of a 1.6 m long drive shaft that is itself supported by a pivot arm mounted transversely across the center of the floating platform. A large hole in the forward part of the work platform allows the turbine rotor to be raised and lowered into the water between the two platform hulls. The prototype turbine rotor has a diameter of 1.4 m and blade length of 76 cm. The 1/10 scale model of the EVG-005 system is shown in Figure 3. In these experiments the turbine rotor was stationary (non-rotating).
Figure 3 : 1/10 scale model of the EVG-005 turbine and floating
B. Model Debris
Several types and sizes of natural woody debris were prepared for use in the study to represent at scale the range of piece sizes and shapes that might be encountered in nature, from large trees to smaller branches. Cornett et al [1] found that creating model debris from real tree branches provides a more realistic simulation of conditions in nature. For added realism, the model debris pieces used in this study were created from real tree branches complete with knots and bends, and not from smooth, straight wooden dowel. The properties of the three different classes of model debris (named small, medium and large) prepared for use in the study are summarized in Table 1 Each piece of debris was painted to make them more visible and make it easier to track their trajectory. A small “X” made of wood was attached to one end of approximately half of the “large” debris pieces to simulate the presence of a root wad, see Figure 4.
Table 1: Summary of model debris properties
Figure 4 : Roughly half of the larger debris pieces were fitted with
artificial root wads.
C. Model Debris Barriers
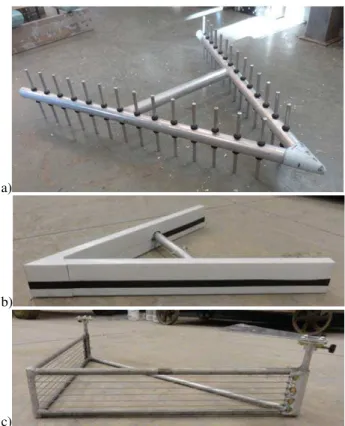
One-tenth scale models of three different debris barrier designs were fabricated for use in the study, see Figure 5. The first two barrier designs are meant to float on the surface some distance upstream of the turbine and deflect incoming debris around the floating platform and the rotor, while minimizing the attenuation of flow velocities at the rotor as much as possible. The third barrier was designed to be mounted at the bow of the floating platform.
Barrier 1A is a floating A-frame fitted with vertical tines extending above and below the free surface. The main A-frame legs were each 60cm long (6 m at full scale) and the angle between them was 50°. The vertical tines were 12.5 cm long and spaced 4 cm apart. The debris barrier was independently moored to the bottom of the flume by a single
mooring line, and positioned a short distance ahead (upstream) of the model turbine. The barrier was also tethered to the floating platform so that the platform would follow the barrier whenever it moved laterally in the flow. Barrier 2A is similar to Barrier 1A, except that the two rows of tines were replaced by a pair of solid plates. This design was based on successful testing completed previously by the Alaska Hydrokinetic Energy Research Center [2,3]. Like Barrier 1A, Barrier 2A was independently moored to flume bottom by a single line and positioned a short distance upstream of the turbine. Barrier 2A was also tethered to the floating platform so that the platform would follow the barrier whenever it moved laterally in the flow.
Barrier 3A featured a V-shaped “fence” comprised of slender steel cables supported on a slender triangular 3D frame mounted directly onto the bow of the floating platform. Each leg of the fence was 27 cm long and the angle between the two legs was 90°. The steel cables were arranged horizontally and spaced 8 mm apart.
Following an initial round of testing and performance assessment with debris, each of model debris barriers was removed from the flume, modified in an attempt to improve its performance, and then re-installed and re-tested a second time. The three refined barrier designs are identified herein as barriers 1B, 2B, and 3B.
a)
b)
c)
Figure 5 : 1/10 Scale models of 3 debris barriers: a) Barrier 1A,
A-frame with tines; b) Barrier 2A, A-A-frame with solid plates; c) Barrier 3A, V-frame with cables
Debris class FS Diameter (m) FS Length (m) MS Diameter (m) MS Length (m) Colour
Small 0.01‐0.05 0.9‐1.1 0.001‐0.005 0.09‐0.11 Orange Medium 0.1‐0.2 4‐6 0.01‐0.02 0.4‐0.6 Purple/Yellow
Three current meters were deployed in the flume to measure flow velocities during the study. One was installed on the flume centreline, 5m upstream of the model turbine, while the other two were deployed on the flume centreline, a short distance downstream of the model turbine.
D. Test Program and Procedure
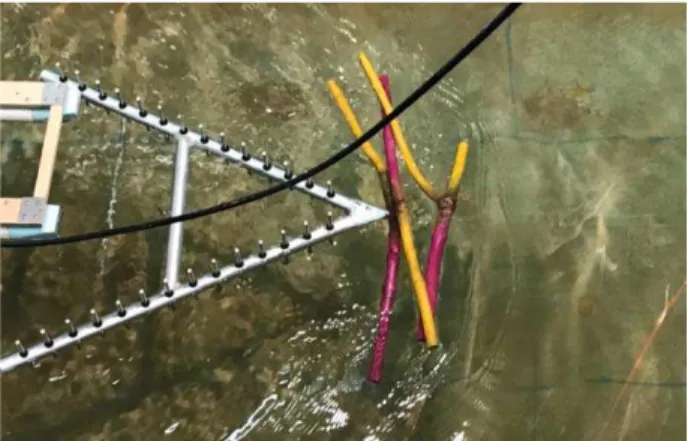
During the first test series, flow speeds corresponding to 1, 2 and 3 m/s at full scale were tuned and verified for use in the study without any turbine model or debris barrier. In the next test series, the flow speeds with the floating platform and turbine alone (no debris barrier) were measured to establish the velocity deficit immediately downstream of the model turbine for each flow speed. Following this, six different series of tests were conducted in which the performance of one of the six different debris barrier designs (3 original designs + 3 modified designs) was investigated. In each of these test series, flow velocities were first measured upstream and downstream of the turbine. Next, single pieces of debris were added to the flow upstream of the model turbine and their interaction with the barrier-turbine system was observed, see Figure 6. The behaviour of all three classes/sizes of debris was studied multiple times. Next, a small debris raft comprised of 5-10 debris pieces was added to the flow upstream of the turbine and its behaviour observed as it moved downstream. This test was repeated at least five times. Once all debris testing was completed for the 1 m/s flow speed, the speed was increased and the testing was repeated for the 2 m/s and 3 m/s flow speeds.
Figure 6 : Single piece of large debris making contact with debris
Barrier 2A.
III. RESULTS AND DISCUSSION
A. Barriers 1A and 1B
Barrier 1A was generally effective for smaller debris at low flow speeds (1 m/s), but medium sized debris tended to snag on the mooring line at the apex of the A-frame. Once the first piece of debris became snagged, subsequent incoming pieces tended to accumulate at the apex forming a debris raft, see Figure 7. Some of the larger debris pieces rode up on top of the barrier and were ensnared by the vertical tines.
At higher flow speeds (2 m/s and above) portions of barrier 1A were dragged below the surface which greatly reduced its effectiveness.
Barrier 1A was subsequently modified to try to improve its performance. Barrier 1B was created by moving the mooring line connection further aft, removing the tines protruding above the waterline, and adding additional flotation near the A-frame apex to increase buoyancy. While barrier 1B generally performed better than barrier 1A, it was often ineffective at higher flow speeds and with larger debris sizes. In 1 m/s and 2 m/s flows, some small, medium and large sized debris pieces slipped below the nose/apex of the A-frame and became snagged on the mooring connection. The barrier was generally effective in deflecting debris pieces that contacted one the barrier legs, but some of the pieces contacting the barrier nose/apex become snagged and pinned in place. Subsequent pieces would accumulate, forming a debris raft. Barrier 1C was unstable in 3 m/s flows, with the nose/apex oscillating vertically, sometimes submerged, other times emergent. As such, it was unable to reliably deflect debris in 3 m/s flows.
Figure 7 : Raft of medium debris pinned at the nose of Barrier 1A
B. Barriers 2A and 2B
Barrier 2A was stable in 1 m/s flow and highly effective at deflecting smaller debris pieces away from the floating platform and turbine at this flow speed. However, the presence of small irregularities on the surface of the natural debris caused several medium and large size pieces to become snagged on the barrier’s sharp upstream nose/apex. One large piece of debris even became snagged at the centre of one of the barrier legs, suggesting that for the 1 m/s flow conditions, flow speeds adjacent to the barrier were insufficient to overcome the frictional force between the barrier leg and debris piece. Large debris pieces fitted with a root wad were more likely to become snagged on the upstream nose of the barrier than were similar pieces without a root wad.
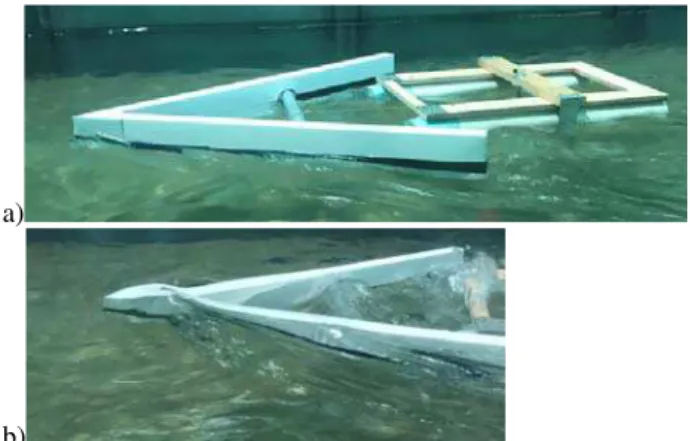
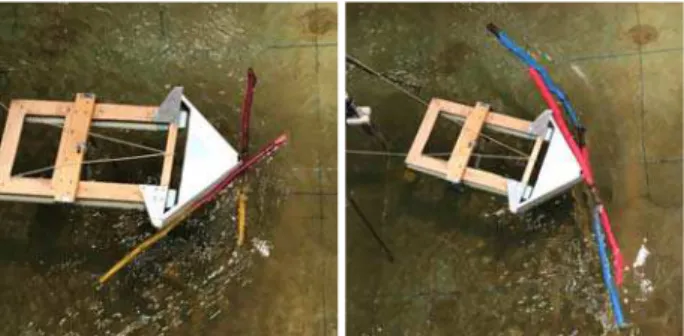
Increasing the flow speed to 2 m/s caused the nose of barrier 2A to pitch downward slightly (see Figure 8a); however, it remained highly effecting at deflecting smaller debris pieces. Testing with the medium sized debris pieces resulted in one of two outcomes. If the debris piece approached the barrier off-centre, avoiding collision with the nose, the debris was successfully diverted around the turbine and travelled harmlessly downstream. However, if the debris pieces struck the barrier nose they often became snagged on the barrier’s mooring line. The behaviour of large debris pieces was similar. These results suggested that the effectiveness of barrier 2A could be improved by modifying the mooring arrangement.
At the 3 m/s flow speed, barrier 2A pitched further forwards such that the upstream nose became fully submerged (see Figure 8b). Testing revealed that debris pieces of all sizes approaching the nose of the barrier tended to ride up over top of the submerged nose without being deflected. Once past the barrier, the debris pieces often struck the floating platform or the turbine rotor. These results suggested that the effectiveness of barrier 2A might be improved by reducing the tendency to pitch forwards (nose down) at higher flow speeds.
a)
b)
Figure 8 : Barrier 2A in: a) 2 m/s flow; and b) 3 m/s flow.
Barrier 2A was subsequently modified to try to improve its performance. Barrier 2B was created by relocating the mooring line connection further aft, adding flotation near the barrier nose to increase buoyancy, reducing the angle between the two legs from 50° to 40°, and adding a rotating deflector bar protruding ahead of the upstream barrier nose, see Figure 9.
Figure 9 : Model Barrier 2B with rotating deflector bar.
Many of the deficiencies observed with barrier 2A noted previously were corrected with barrier 2B. The upstream nose no longer became submerged at high flow speeds and debris pieces were less inclined to snag on the barrier nose or against the mooring line. Single debris pieces contacting the deflector bar tended to pivot around the bar and then travel downstream alongside one of the barrier legs and away from the turbine. Because the nose remained emergent at all flow speeds, debris pieces were also less likely to pass over top of the barrier. Even though the performance of barrier 2B was superior to that of barrier 2A, a few debris pieces managed to pass under the inclined deflector bar and become trapped in the space between the bar and barrier nose. In addition, some large debris pieces fitted with root wads snagged on the deflector bar. It is postulated that some of these deficiencies could be rectified by increasing the length of the deflector bar, and/or modifying the angle of the deflector bar relative to the waterline; however, these additional refinements could not tested due to a shortage of time.
C. Barriers 3A and 3B
Initial testing with barrier design 3A at 1 m/s flow speed revealed that when debris pieces of all sizes approached near the center of the barrier, the pieces often become trapped against the cable fence. A raft of debris tended to form as more debris pieces arrived and became trapped. Debris pieces approaching off-centre away from the barrier nose were more likely to be deflected away from the floating platform and pass harmlessly downstream. Barrier 3A became submerged at higher flows (2 m/s and above) and was ineffective at deflecting debris in these conditions. Barrier 3A was subsequently modified to try to improve its performance. Barrier 3B was created by replacing the cables with two solid pieces of sheet metal and adding flotation near the barrier nose to increase buoyancy. The 90° angle between the two legs of the barrier was retained.
In 1 m/s flows, barrier 3B was generally effective in deflecting and clearing smaller debris, but medium and larger debris pieces often became pinned against either the barrier nose/apex or one of the barrier legs, see Figure 10. Debris rafts tended to form on the upstream face of the barrier as additional debris pieces were added to the flow. In 2 m/s flows, the barrier pitched forwards (nose down) and the barrier nose became submerged, allowing smaller debris pieces to pass over top of the barrier and continue downstream. Medium and large debris pieces often became pinned against the barrier nose or one of the barrier legs, as observed in slower flows. In 3 m/s flows, all of barrier 3B became submerged and it was ineffective at deflecting or clearing debris in this condition.
Figure 10 : Medium and large debris pinned against barrier 3B.
IV. CONCLUSION
Over 250 model tests at 1/10 scale have been conducted to assess the performance of six different debris barrier designs in flow speeds up to 3 m/s. Of the six barrier designs tested, barrier 2B (A-frame with solid walls and rotating nose bar) was the most effective at protecting the floating platform and turbine rotor from waterborne debris. Barrier 2B deflected and cleared virtually all small and medium sized debris pieces in flow speeds up to 2 m/s, and some debris pieces in 3 m/s flows. Additional refinements to further improve the performance of Barrier 2B will be explored in future testing.
This research contributes important new knowledge and information concerning the performance of debris mitigation systems for use with floating hydrokinetic turbines deployed in rivers, estuaries and coastal waters.
ACKNOWLEDGMENT
The authors gratefully acknowledge funding received from the National Research Council, Canada and New Energy Corp.
REFERENCES
[1] Cornett, Knox, Menninger, Lux, Provan (2017) Assessment of Debris Issues Impacting Design of a Flood Diversion Project in a Large Scale Physical Model. Proc. 2017 IAHR Congress, Kuala Lumpur, Malaysia.
[2] Johnson, Schmid, Kasper, Seitz, Duvoy (2014) Protection of In-River Hydrokinetic Power-Generating Devices from Surface Debris in Alaskan Rivers, Report by Alaska Center for Energy and Power.
[3] Johnson, Kasper, Schmid, Duvoy, Kulchitsky, Mueller-Stoffels, Konefal, Seitz (2015) Surface Debris Characterization and Mitigation Strategies and Their Impact on the Operation of River Energy Conversion Devices on the Tanana River at Nenana, Alaska. Report by the Alaska Center for Energy and Power.
[4] Klaptocz (2017) Delivering Remote Community Solutions, Presentation at the 2017 Annual Conference of Marine Renewables Canada, 8 November 2017, Ottawa, Canada.
[5] Toniolo (2014) The effects of surface debris diversion devices on river hydrokinetic conditions and implications for in-stream hydrokinetic development.
Water 014 6(8), 2164-2174.
[6] Tyler (2011) River Debris: Causes, Impacts and Mitigation Techniques. Report by the Alaska Center for Energy and Power.
AUTHORS
First Author – Andrew Cornett, PhD, PEng, National
Research Council Canada, [email protected].
Second Author – Mitchel Provan, MASc, PEng, National
Research Council Canada, [email protected].
Third Author – Michael Bear, New Energy Corp.,
Correspondence Author – Andrew Cornett, National
![Figure 1 : Pile up of surface debris at a floating EnCurrent hydrokinetic turbine deployed at Eagle, Alaska (source: [2])](https://thumb-eu.123doks.com/thumbv2/123doknet/14043088.459210/2.918.484.828.412.600/figure-surface-floating-encurrent-hydrokinetic-turbine-deployed-alaska.webp)