HAL Id: inserm-01147297
https://www.hal.inserm.fr/inserm-01147297
Submitted on 30 Apr 2015
HAL is a multi-disciplinary open access
archive for the deposit and dissemination of
sci-entific research documents, whether they are
pub-lished or not. The documents may come from
teaching and research institutions in France or
abroad, or from public or private research centers.
L’archive ouverte pluridisciplinaire HAL, est
destinée au dépôt et à la diffusion de documents
scientifiques de niveau recherche, publiés ou non,
émanant des établissements d’enseignement et de
recherche français ou étrangers, des laboratoires
publics ou privés.
Validating a widely used measure of frailty: are all
sub-components necessary? Evidence from the
Whitehall II cohort study.
Kim Bouillon, Severine Sabia, Markus Jokela, Catharine Gale, Archana
Singh-Manoux, Martin Shipley, Mika Kivimäki, G David Batty
To cite this version:
Kim Bouillon, Severine Sabia, Markus Jokela, Catharine Gale, Archana Singh-Manoux, et al..
Vali-dating a widely used measure of frailty: are all sub-components necessary? Evidence from the
White-hall II cohort study.. AGE, Springer Verlag, 2013, 35 (4), pp.1457-65. �10.1007/s11357-012-9446-2�.
�inserm-01147297�
Validating a widely used measure of frailty: are all
sub-components necessary? Evidence from the Whitehall II
cohort study
Kim Bouillon&Severine Sabia&Markus Jokela& Catharine R. Gale&Archana Singh-Manoux& Martin J. Shipley&Mika Kivimäki&
G. David Batty
Received: 14 March 2012 / Accepted: 10 June 2012 / Published online: 8 July 2012 # The Author(s) 2012. This article is published with open access at Springerlink.com
Abstract There is growing interest in the measure-ment of frailty in older age. The most widely used measure (Fried) characterizes this syndrome using five components: exhaustion, physical activity, walking speed, grip strength, and weight loss. These compo-nents overlap, raising the possibility of using fewer, and therefore making the device more time- and cost-efficient. The analytic sample was 5,169 individuals (1,419 women) from the British Whitehall II cohort study, aged 55 to 79 years in 2007–2009. Hospitaliza-tion data were accessed through English naHospitaliza-tional records (mean follow-up 15.2 months). Age- and
sex-adjusted Cox models showed that all components were significantly associated with hospitalization, the hazard ratios (HR) ranging from 1.18 (95 % confi-dence interval00.98, 1.41) for grip strength to 1.60 (1.35, 1.90) for usual walking speed. Some attenuation of these effects was apparent following mutual adjust-ment for frailty components, but the rank order of the strength of association remained unchanged. We ob-served a dose–response relationship between the num-b e r o f f r a i l t y c o m p o n e n t s a n d t h e r i s k f o r hospitalization [1 component—HR 01.10 (0.96, 1.26); 2—HR01.52 (1.26, 1.83); 3–5—HR02.41
Electronic supplementary material The online version of this article (doi:10.1007/s11357-012-9446-2) contains
supplementary material, which is available to authorized users. K. Bouillon (*)
:
S. Sabia:
M. Jokela:
A. Singh-Manoux
:
M. J. Shipley:
M. Kivimäki:
G. D. BattyDepartment of Epidemiology and Public Health, University College London,
1-19 Torrington Place, London WC1E 6BT, UK e-mail: kim.bouillon.09@ucl.ac.uk M. Jokela
Institute of Behavioural Sciences, University of Helsinki, Helsinki, Finland
C. R. Gale
MRC Lifecourse Epidemiology Unit, University of Southampton, Southampton, UK
C. R. Gale
:
G. D. BattyCentre for Cognitive Ageing and Cognitive Epidemiology, University of Edinburgh,
Edinburgh, UK A. Singh-Manoux
INSERM U1018, Centre for Research in Epidemiology & Population Health,
Villejuif, France A. Singh-Manoux
Centre de Gérontologie, Hôpital Ste Périne, AP-HP, Paris, France
M. Kivimäki
Finnish Institute of Occupational Health, Helsinki, Finland
(1.84, 3.16), P trend <0.0001]. A concordance index used to evaluate the predictive power for hospital admissions of individual components and the full scale was modest in magnitude (range 0.57 to 0.58). Our results support the validity of the multi-component frailty measure, but the predictive performance of the measure is poor.
Keywords Frail elderly . Frailty . Validation . Prediction . Cohort study . Hospitalization
Introduction
Frailty is a clinically recognized geriatric syndrome characterized by age-related declines in functional reserves across an array of physiologic systems (Fried et al.2001). In older adults, it is associated with multiple adverse health outcomes such as falls, fracture, disabil-ity, hospitalization, and mortality (Cawthon et al.2007; Fried et al.2001). There is evidence that frailty may be prevented (Boyd et al.2009; Tan et al.2009) and per-haps even reversed with appropriate intervention (Faber et al. 2006; Kenny et al. 2010; Peterson et al. 2007; Srinivas-Shankar et al.2010).
Recent systematic literature reviews identified more than 20 frailty measures (de Vries et al.2011; Sternberg et al.2011), among which that developed by Fried and colleagues (Fried et al.2001) is the most widely utilized. Comprising five components—weight loss, exhaustion, low physical activity, slow walking speed at usual pace, and low grip strength—this scale has been validated against subsequent health outcomes in a series of studies drawn from a range of diverse populations (Al Snih et al.2009; Avila-Funes et al.2008; Bandeen-Roche et al.
2006; Cawthon et al.2007; Ensrud et al.2007; Fairhall et al. 2011; Kiely et al.2009; Kulminski et al. 2008; Rochat et al. 2010; Romero-Ortuno et al. 2010; Seematter-Bagnoud et al. 2010; Wong et al. 2010; Woods et al.2005).
While it is assumed that the measurement of frailty needs to include multiple components, these inevitably overlap. Using fewer components would be more time-and cost-efficient. Although studies using the Fried frailty scale have generally shown that the greater the number of frailty components used the higher the risk of a given adverse health outcome (Avila-Funes et al. 2008; Bandeen-Roche et al.2006; Cawthon et al.2007; Ensrud et al.2008; Fried et al.2001; Kulminski et al.2008), it
remains unclear whether all components of the scale contribute to associations with health outcomes or wheth-er some of them are redundant. Accordingly, for the first time to our knowledge, we compared the prediction accuracy of multi-component measures of frailty for total hospitalizations with a single-component measure.
Materials and methods Study sample
The Whitehall II study is an ongoing, cohort study in which 10,308 (67 % men) London-based British civil servants aged 35–55 years were recruited in 1985 (Marmot and Brunner 2005). The first examination (phase 1), which took place during 1985–1988, com-prised a clinical examination and self-administered questionnaire. Subsequent phases of data collection have alternated between postal questionnaire alone [phases 2 (1988–1990), 4 (1995–1996), 6 (2001) and 8 (2006)], and postal questionnaire accompanied by a clinical examination [phases 3 (1991–1993), 5 (1997– 1999), 7 (2002–2004) and 9 (2007–2009)].
For the current analyses, we used data drawn from phase 9 when frailty was first measured; this therefore represents our “baseline” for the present analyses. Of 10,308 study members at recruitment, 6,761 participated at phase 9, 2,588 were non-responders, 954 had died and the vital status of five was unknown. Of the 6,761 par-ticipants at phase 9, complete data for the frailty compo-nents and hospitalizations were available for 5,169 (74 % men). This constituted the study sample. The flow of participants through the study is depicted in Fig.1.
Ethical approval for the Whitehall II study was obtained from the University College London Medical School Committee on the ethics of human research.
Operationalization of frailty measure
The Fried frailty measure comprises the following components (Fried et al.2001):
1. Exhaustion: defined using two items drawn from the Center for Epidemiology Studies—Depression (CES-D) scale (Radloff1977):“I felt that everything I did was an effort in the last week” and “I could not get going in the last week”. If participants answered “occasionally or moderate amount of the time
(3–4 days)” or “most or all of the time (5–7 days)” to either of these items, they were categorized as exhausted. If they answered“rarely or none of the time (<1 day)” or “some or a little of the time (1–2 days)”, they were categorized as not exhausted. 2. Physical activity: based on a modified version of the Minnesota leisure-time physical activity question-naire (Folsom et al. 1985; Singh-Manoux et al.
2005) which ascertains the frequency and duration of participation in 20 different activities (e.g., run-ning, cycling, other sports, housework, and garden-ing activities). Total hours per week were calculated for each activity and a metabolic equivalent (MET) value was assigned to each based on an existing compendium (Ainsworth et al.1993). Energy ex-penditure (kcal/week) was calculated for each par-ticipant; low levels of physical activity were denoted by an expenditure of <383 kcal/week (men) and 270 (women) (Fried et al.2001). 3. Walking speed: based on the duration of walking a
distance of 8-ft (2.4 m) at usual pace. Established cut-offs are based on results for a 15-ft (4.6 m) walking test (Fried et al.2001). Accordingly, fol-lowing recomputation, participants were catego-rized as having slow walking speed when time to walk 8-ft was ≥3.73 s (for men with height ≤173 cm or women with height ≤159 cm) or ≥3.20 s (for men with height >173 cm or women with height >159 cm).
4. Grip strength: measured in kilograms using the Smedley hand grip dynamometer. Categorizations were stratified by gender and body mass index (BMI) (Fried et al. 2001). For men, low grip strength was≤29 kg (BMI ≤24 kg/m2),≤30 (BMI 24.1–28), and ≤32 (BMI >28). For women, low
grip strength was ≤17 (BMI ≤23), ≤17.3 (BMI 23.1–26), ≤18 (BMI 26.1–29), and ≤21 (BMI >29). 5. Weight loss: Prior definitions of weight loss in the context of frailty have defined it as being uninten-tional and 5 % or more over the previous year (Fried et al.2001). We did not have weight loss in the previous year, so we instead utilized a cut-off of 10 % in accordance with that in the Women’s Health Aging Study-I (Boyd et al.2005). A total frailty score was calculated by allocating a value of 1 to each of the above criteria, resulting in a range of 0 to 5. Participants were classified as frail if they had at least three out of five of the frailty compo-nents, as pre-frail if they had 1–2, and as non-frail if they had none of these components.
Outcome
Information on the first hospitalization was prospec-tively ascertained from phase 9 (October 10, 2007) to January 31, 2010 by linkage of study members to the Hospital Episode Statistics (HES), a data registry in-cluding information on all admissions to National Health Service hospitals in England (The NHS Infor-mation Centre for health and social care2011).
Statistical analysis
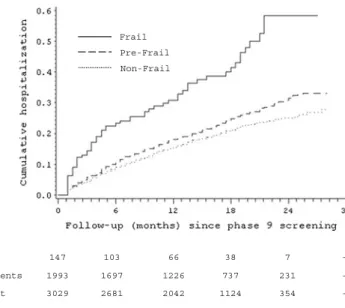
Incidence curves for hospitalization according to frailty status were produced using Kaplan–Meier plots (Kaplan and Meier 1958) and the log-rank test (Peto and Peto
1972). Having first ascertained that the proportional hazards assumptions had not been violated, hazard ratios (HR) and accompanying 95 % confidence intervals (CI)
Fig. 1 Flow of study partic-ipants through the Whitehall II study, UK, 1989–2010
for the associations of frailty (and its individual compo-nents) with all hospitalizations combined were computed using Cox proportional hazard regression models (Cox
1972). Given that there was no evidence that the relation between frailty and hospitalization was modified by gender or age (all P values for interaction >0.45), data were pooled and adjusted for age and gender.
We first examined whether individual frailty markers were associated with the risk of hospitaliza-tion. Second, in order to explore whether a single component was responsible for generating the associ-ation between the overall frailty scale and the risk of hospitalization, we examined the cumulative effect of frailty markers in the prediction of hospitalization by creating a frailty score ranging from 0 (no frailty) to 5. We then studied the effect of number and combina-tions of frailty components on the risk of hospitaliza-tion in two separate models. We also conducted a subgroup analysis among study participants who were negative for a given frailty component to estimate cumulative effects (0 to 4) of other frailty components in the prediction of adverse health outcomes. In all analyses, the reference group was that with no appar-ent frailty.
To evaluate the predictive power for each individual component and the full frailty scale, we calculated Har-rell’s C concordance statistic (Harrell, Jr. et al. 1996), which is equivalent to the area under the curve statistic for receiver-operating characteristic plots but allows the calculation of concordance in each survival model. It estimates the concordance between the predicted failure order of a pair of subjects and the observed order. We split the analytic sample into“derivation” and “valida-tion” datasets of equal size after stratification by age and sex. We then fitted age- and sex-adjusted models in the derivation dataset and evaluated the performance of the models in the validation dataset (Newson2010).
Descriptive analyses and Cox proportional hazards models were performed using SAS version 9.1. Cal-culations of Harrell’s C concordance statistic were performed using Stata version 10.0.
Results
Study participants and missing data
Compared with participants alive at phase 9 but exclud-ed (owing to unknown vital status, non-participation,
missing data on the frailty scale, and living outside of England) (n04,153), people in the analytic sample (n0 5,169) were on average 0.7 years younger, less likely to be female (27.5 % versus 39.7 %), and of low socioeco-nomic status (3.9 % versus 12.4 %).
In Table1, we report the baseline characteristics of study members according to hospitalization. Of the 5,169 participants, 22.3 % had at least one hospitali-zation episode during the follow-up (range 0.03 to 28.13 months; mean015.17). In comparison with non-hospitalized participants, hospitalized participants were more likely to be older, positive for each frailty component, and classified as frail or pre-frail. Association between frailty and future risk of hospitalization
Kaplan–Meier curves (Fig.2) show that the cumula-tive hospitalization rate was higher among the frail group compared with their non-frail counterparts (P value for difference <0.0001). In age- and sex-adjusted analyses, with the non-frail group as the referent, the frail group had an elevated hazard ratio for hospitalization of 2.40 [95 % confidence interval
Table 1 Baseline characteristics of the 5,169 study participants according to hospitalization during follow-up, Whitehall II study, UK, 2007–2010
Hospitalization P valuea
n (%)
No Yes
N 4,019 1,150
Age in years [mean (SD)] 65.4 (5.8) 67.2 (6.0) <0.0001 Women 1,104 (27.5) 315 (27.4) 0.96 Frailty components
Exhaustion 402 (10.0) 152 (13.2) 0.002 Low physical activity 875 (21.8) 301 (26.2) 0.002 Slow walking speed 340 (8.5) 163 (14.2) <0.0001 Low grip strength 373 (9.3) 139 (12.1) 0.005 Weight loss 135 (3.4) 54 (4.7) 0.03 Frailty status <0.0001 Non-frail 2,415 (60.1) 614 (53.4) Pre-frail 1,517 (37.8) 476 (41.4) Frail 87 (2.1) 60 (5.2) a
P value for heterogeneity except for frailty status where P value is for trend
(CI)01.83, 3.14] while for the pre-frail group it was 1.20 (95 % CI=1.06, 1.35).
Association between single components of frailty and future risk of hospitalization
Table 2 illustrates the results of the association be-tween individual frailty components and the risk of
hospitalization. All five components were significant-ly associated with hospitalization, with the age- and sex-adjusted hazard ratios ranging from 1.18 (95 % CI00.98, 1.41) for grip strength to 1.60 (95 % CI01.35, 1.90) for walking speed. Some attenuation was apparent following adjustment for other compo-nents, but the rank order of the strength of association remained unchanged. -354 1124 2042 2681 3029 Non-frail: 0 component -231 737 1226 1697 1993 Pre-frail: 1-2 components -7 38 66 103 147 Frail: 3-5 components Numbers at risk Frail Pre-Frail Non-Frail
Fig. 2 Kaplan–Meier curves showing the proba-bility of future hospitaliza-tion by frailty status, Whitehall II study, UK, 2007–2010
Table 2 Hazard ratios (95 % confidence interval) for the as-sociation of individual frailty components with hospitalization (n05,169), Whitehall II study, UK, 2007–2010
a
Adjustment for sex, age, ex-haustion, physical activity, walking speed, grip strength, and weight loss
Hospitalization HR [95 % CI] HR [95 % CI] N (%) Sex- and age-adjusted Fully adjusteda No Yes
Exhaustion
No 3,617 (90.0) 998 (86.8) 1 [Ref] 1
Yes 402 (10.0) 152 (13.2) 1.38 [1.17, 1.64] 1.30 [1.10, 1.55] Low physical activity
No 3,144 (78.2) 849 (73.8) 1 1
Yes 875 (21.8) 301 (26.2) 1.26 [1.10, 1.44] 1.19 [1.04, 1.36] Slow walking speed
No 3,679 (91.5) 987 (85.8) 1 1
Yes 340 (8.5) 163 (14.2) 1.60 [1.35, 1.90] 1.52 [1.28, 1.80] Low grip strength
No 3,646 (90.7) 1,011 (87.9) 1 1
Yes 373 (9.3) 139 (12.1) 1.18 [0.98, 1.41] 1.07 [0.89, 1.28] Weight loss
No 3,884 (96.6) 1,096 (95.3) 1 1
Cumulative effect of frailty markers and the risk of hospitalization
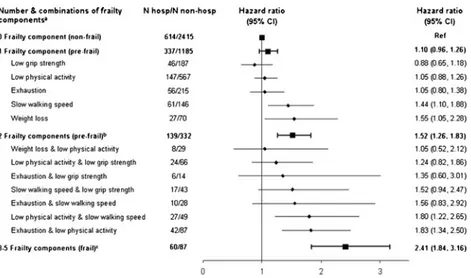
Figure 3 shows a dose–response relationship
be-tween the risk of hospitalization and the number frailty components: the hazard ratios for hospitali-zation ranged from 1.10 (95 % CI00.96, 1.26) (any single frailty component) to 2.41 (95 % CI01.84, 3.16) (3–5 frailty components). Figure 3
also displays hazard ratios and their 95 % CIs for hospitalization according to different combinations of indicators included in the frailty scale when the scores were less than 3. Among study members with one frailty component only, the strength and the rank of association of each separate frailty component was slightly different from those reported in Table 2 where this estimation was carried out among the study participants with a frailty score of one or more. When we examined the possible combinations of two items from the frailty scale, there were very few study members with weight loss; therefore, three combinations were not represented. Two (low physical activity and slow walking speed; exhaustion and low phys-ical activity) of a possible 10 combinations of those with two frailty indicators had very similar and strong associations (hazard ratios ranging from 1.80 to 1.83) with hospitalization.
In Table 3, we present the results of the asso-ciation between the number of frailty components with the risk for hospitalization stratified by the presence of individual frailty components. Within each stratum, we still observed dose–response associations between the frailty score and the risk for hospitalization.
Predictive power of single- and multi-component measures for hospitalization
Harrell’s C concordance statistic for individual frailty components and the full frailty scale varied very little: 0.57 (95 % CI00.55, 0.60) for grip strength and 0.58 (95 % CI00.56, 0.61) for exhaustion and the full frailty scale. The difference of Harrell’s concordance indices between pairs of individual components and the full scale was not statistically significant at conventional levels (P values >0.06; seeOnline appendix).
Discussion
The main objective of this study was to examine whether the five components included in the Fried frailty scale were equally related to the risk of hospi-talization or whether one single component, or a com-bination, had the same utility as the full scale.
Fig. 3 Hazard ratios (95 % confidence interval) for the associ-ation of combinassoci-ations of frailty components with later hospital-ization, Whitehall II study, UK, 2007–2010.aResults from two models: one with different combinations included in the model (diamonds); the other one with number of frailty components included in the model (squares). All analyses were adjusted for
age at baseline and sex. The reference group was those with no frailty component.bThree combinations were not reported ow-ing to too few hospitalizations: weight loss and slow walkow-ing speed (n00), weight loss and exhaustion (n02), and weight loss and low grip strength (n03).cOwing to low numbers, partic-ipants with three to five frailty components were collapsed
Although the dose–response relationship between the number of frailty components and the risk of adverse health outcomes (Avila-Funes et al. 2008; Bandeen-Roche et al.2006; Cawthon et al.2007; Ensrud et al.
2008; Fried et al.2001; Kulminski et al.2008) is well known, our results add some novel findings to this literature. First, we show that all five frailty compo-nents—exhaustion, low physical activity, slow walking speed, low grip strength, and weight loss—are indepen-dently associated with hospitalization with none of them being redundant. Thus, these analyses support the
hypothesis that several components are required to mea-sure frailty (Fried et al. 2001; Rockwood2005). Our results are consistent with those from a previous study (Rothman et al.2008) where the authors found that slow walking speed was the strongest, and low grip strength the weakest, predictors of hospitalization.
Second, we formally tested the predictive performance of the individual frailty components compared with the full frailty scale. Harrell’s C concordance statistic varied between 0.57 and 0.58 (0.50 indicates that the prediction does not differ from chance), suggesting that neither the
Table 3 Hazard ratios (95 % confidence interval) for the association of number of frailty components with hospitalization, stratified by individual components, Whitehall II study, UK, 2007–2010
N hosp N non-hosp HR [95 % CI] N hosp N non-hosp HR [95 % CI] Exhaustion0 no 998 3,617 Exhaustion0 yes 152 402
0 614 2,415 1 [Ref] 0 56 215 1 [Ref]
1 281 970 1.11 [0.96, 1.28] 1 60 136 1.62 [1.12, 2.33] 2 79 196 1.40 [1.10, 1.77] 2 24 39 2.30 [1.41, 3.74] 3–4 24 36 2.09 [1.39, 3.16] 3–4 12 12 3.72 [1.97, 7.01] P value for trend 0.0001 P value for trend <0.0001 Low physical activity0 no 849 3,144 Low physical activity0 yes 301 875 0 614 2,415 1 [Ref] 0 147 567 1 [Ref] 1 190 618 1.14 [0.96, 1.34] 1 101 231 1.52 [1.17, 1.96] 2 38 101 1.40 [1.01, 1.96] 2 41 64 2.25 [1.58, 3.21] 3–4 7 10 2.22 [1.05, 4.69] 3–4 12 13 3.61 [2.00, 6.55] P value for trend 0.005 P value for trend <0.0001 Slow walking speed0 no 987 3,679 Slow walking speed0 yes 163 340 0 614 2,415 1 [Ref] 0 61 146 1 [Ref] 1 276 1,039 1.05 [0.91, 1.21] 1 54 124 1.13 [0.78, 1.63] 2 85 208 1.47 [1.17, 1.85] 2 36 57 1.52 [1.00, 2.30] 3–4 12 17 2.58 [1.46, 4.57] 3–4 12 13 2.46 [1.32, 4.58] P value for trend 0.0004 P value for trend 0.004
Low grip strength0 no 1,011 3,646 Low grip strength0 yes 139 373 0 614 2,415 1 [Ref] 0 46 187 1 [Ref] 1 291 998 1.15 [1.00, 1.32] 1 50 128 1.58 [1.06, 2.36] 2 89 204 1.61 [1.29, 2.02] 2 33 49 2.56 [1.63, 4.01] 3–4 17 29 2.48 [1.52, 4.03] 3–4 10 9 4.93 [2.47, 9.84] P value for trend <0.0001 P value for trend <0.0001 Weight loss0 no 1,096 3,884 Weight loss0 yes 54 135
0 614 2,415 1 [Ref] 0 27 70 1 [Ref]
1 310 1,115 1.08 [0.94, 1.23] 1 13 45 0.69 [0.35, 1.35] 2 126 287 1.59 [1.31, 1.92] 2 10 13 2.09 [0.99, 4.39] 3–4 46 67 2.33 [1.72, 3.16] 3–4 4 7 1.54 [0.53, 4.49] P value for trend <0.0001 P value for trend 0.19
components nor the full scale were adequate prediction tools for hospitalization in the clinical settings. This probably indicates that frailty and its components capture only a limited range of the conditions leading to hospi-talization. Third, the absence of difference in predictive performance between individual components and the full scale suggest that measuring only one component of frailty enables an equally precise prediction of hospitali-zation as the full scale; other analyses conducted in this study did not support this conclusion. Importantly, we found that within the group of individuals with a frailty component those who additionally had other components were up to 4.9 times more likely to experience hospital-ization at follow-up compared with those with no addi-tional frailty components. Thus, the frailty measure seemed to stratify risk even within the group of individ-uals with an individual frailty component.
The main strength of our study resides in using an objective and national database (British National Health Service) to derive our outcome. Therefore, it is unlikely to be subject to reporting bias. A limitation, shared with many studies in this field of research, is a departure from the original frailty scale. This was particularly the case with weight loss because weight in the previous year was not available in our study. As many studies on frailty, including ours, are analyses of existing cohorts primarily set up for other purposes, assessment of frailty components tends to differ be-tween them. Nonetheless, effort should be made to use a standardized definition in order to allow direct com-parisons of results between different populations. Fur-thermore, because our study sample consisted predominantly of white collar workers aged from 55 to 79 years (mean age065.8), this may limit the gen-eralizability of our findings.
In conclusion, our results indicate that a composite measure of frailty proposed by Fried is related to future risk of hospitalization but shows poor perfor-mance as a predictive tool. Much previous work in this domain is based on elderly individuals. That the frailty scale and its individual components are prospectively associated with hospitalization in our cohort, where participants were aged 55–79 years at baseline, sug-gests that the scale could be used to reliably monitor frailty status of adults in middle and early old age.
Acknowledgments All authors contributed to conception and design, and to analysis and interpretation of data, or wrote the first draft of the article and revised it critically for important
intellectual content. All approve the final version to be published.
We thank all participating men and women in the Whitehall II Study; all participating Civil Service departments and their welfare, personnel, and establishment officers; the Occupational Health and Safety Agency; and the Council of Civil Service Unions. The Whitehall II Study team comprises research scien-tists, statisticians, study coordinators, nurses, data managers, administrative assistants, and data entry staff, who make the study possible.
Fundings This work was supported by grants from the Medical Research Council, UK; Economic and Social Research Council, UK; British Heart Foundation, UK; Health and Safety Executive, UK; Department of Health, UK; BUPA Foundation, UK; National Heart Lung and Blood Institute (R01HL036310), US; NIH: Na-tional Institute on Aging (R01AG013196; R01AG034454), US. GDB is a Wellcome Trust Fellow. MS is supported by the British Heart Foundation and MK is supported by the Academy of Fin-land, Finland.
Open Access This article is distributed under the terms of the Creative Commons Attribution License which permits any use, distribution, and reproduction in any medium, provided the original author(s) and the source are credited.
References
Ainsworth BE, Haskell WL, Leon AS, Jacobs DR Jr, Montoye HJ, Sallis JF, Paffenbarger RS Jr (1993) Compendium of physical activities: classification of energy costs of human physical activities. Med Sci Sports Exerc 25:71–80 Al Snih S, Graham JE, Ray LA, Samper-Ternent R, Markides
KS, Ottenbacher KJ (2009) Frailty and incidence of activ-ities of daily living disability among older Mexican Amer-icans. J Rehabil Med 41:892–897
Avila-Funes JA, Helmer C, Amieva H, Barberger-Gateau P, Le Goff M, Ritchie K, Portet F, Carriere I, Tavernier B, Gutierrez-Robledo LM, Dartigues JF (2008) Frailty among community-dwelling elderly people in France: the three-city study. J Gerontol A Biol Sci Med Sci 63:1089–1096 Bandeen-Roche K, Xue QL, Ferrucci L, Walston J, Guralnik
JM, Chaves P, Zeger SL, Fried LP (2006) Phenotype of frailty: characterization in the women's health and aging studies. J Gerontol A Biol Sci Med Sci 61:262–266 Boyd CM, Xue QL, Simpson CF, Guralnik JM, Fried LP (2005)
Frailty, hospitalization, and progression of disability in a cohort of disabled older women. Am J Med 118:1225–1231 Boyd CM, Ricks M, Fried LP, Guralnik JM, Xue QL, Xia J, Bandeen-Roche K (2009) Functional decline and recovery of activities of daily living in hospitalized, disabled older women: the Women's Health and Aging Study I. J Am Geriatr Soc 57:1757–1766
Cawthon PM, Marshall LM, Michael Y, Dam TT, Ensrud KE, Barrett-Connor E, Orwoll ES, Osteoporotic Fractures in Men Research Group (2007) Frailty in older men: preva-lence, progression, and relationship with mortality. J Am Geriatr Soc 55:1216–1223
Cox DR (1972) Regression models and life-tables. J R Stat Soc Ser B (Methodol) 34:187–220
de Vries NM, Staal JB, van Ravensberg CD, Hobbelen JS, Olde Rikkert MG, Nijhuis-van der Sanden MW (2011) Outcome instruments to measure frailty: a systematic review. [Re-view]. Ageing Res Rev 10:104–114
Ensrud KE, Ewing SK, Taylor BC, Fink HA, Stone KL, Cauley JA, Tracy JK, Hochberg MC, Rodondi N, Cawthon PM, for the Study of Osteoporotic Fractures Research Group (2007) Frailty and risk of falls, fracture, and mortality in older women: the study of osteoporotic fractures. J Geron-tol A Biol Sci Med Sci 62:744–751
Ensrud KE, Ewing SK, Taylor BC, Fink HA, Cawthon PM, Stone KL, Hillier TA, Cauley JA, Hochberg MC, Rodondi N, Tracy JK, Cummings SR (2008) Comparison of 2 frailty indexes for prediction of falls, disability, fractures, and death in older women. Arch Intern Med 168:382–389 Faber MJ, Bosscher RJ, Chin APM, van Wieringen PC (2006)
Effects of exercise programs on falls and mobility in frail and pre-frail older adults: a multicenter randomized con-trolled trial. Arch Phys Med Rehabil 87:885–896 Fairhall N, Sherrington C, Kurrle SE, Lord SR, Cameron ID
(2011) ICF participation restriction is common in frail, community-dwelling older people: an observational cross-sectional study. Physiotherapy 97:26–32
Folsom AR, Caspersen CJ, Taylor HL, Jacobs DR Jr, Luepker RV, Gomez-Marin O, Gillum RF, Blackburn H (1985) Leisure time physical activity and its relationship to coro-nary risk factors in a population-based sample. The Min-nesota Heart Survey. Am J Epidemiol 121:570–579 Fried LP, Tangen CM, Walston J, Newman AB, Hirsch C,
Gottdiener J, Seeman T, Tracy R, Kop WJ, Burke G, McBurnie MA, Cardiovascular Health Study Collaborative Research Group (2001) Frailty in older adults: evidence for a phenotype. J Gerontol A Biol Sci Med Sci 56:M146–M156 Harrell FE Jr, Lee KL, Mark DB (1996) Multivariable prognos-tic models: issues in developing models, evaluating assumptions and adequacy, and measuring and reducing errors. Stat Med 15:361–387
Kaplan EL, Meier P (1958) Nonparametric estimation from incomplete observations. J Am Stat Assoc 53:457–481 Kenny AM, Boxer RS, Kleppinger A, Brindisi J, Feinn R,
Burleson JA (2010) Dehydroepiandrosterone combined with exercise improves muscle strength and physical func-tion in frail older women. J Am Geriatr Soc 58:1707–1714 Kiely DK, Cupples LA, Lipsitz LA (2009) Validation and comparison of two frailty indexes: the MOBILIZE Boston study. J Am Geriatr Soc 57:1532–1539
Kulminski AM, Ukraintseva SV, Kulminskaya IV, Arbeev KG, Land K, Yashin AI (2008) Cumulative deficits better char-acterize susceptibility to death in elderly people than phe-notypic frailty: lessons from the Cardiovascular Health Study. J Am Geriatr Soc 56:898–903
Marmot M, Brunner E (2005) Cohort Profile: the Whitehall II study. Int J Epidemiol 34:251–256
Newson RB (2010) Comparing the predictive power of survival models using Harrell's c or Sommers' D. Stata J 10:339–358 Peterson MJ, Sloane R, Cohen HJ, Crowley GM, Pieper CF, Morey MC (2007) Effect of telephone exercise counseling
on frailty in older veterans: project LIFE. Am J Mens Health 1:326–334
Peto R, Peto J (1972) Asymptotically efficient rank invariant test procedures. J R Stat Soc Ser A (Gen) 135:185–207 Radloff LS (1977) The CES-D Scale. Appl Psychol Meas
1:385–401
Rochat S, Cumming RG, Blyth F, Creasey H, Handelsman D, Le Couteur DG, Naganathan V, Sambrook PN, Seibel MJ, Waite L (2010) Frailty and use of health and community services by community-dwelling older men: the Concord Health and Ageing in Men Project. Age Ageing 39:228– 233
Rockwood K (2005) What would make a definition of frailty successful? Age Ageing 34:432–434
Romero-Ortuno R, Walsh CD, Lawlor BA, Kenny RA (2010) A frailty instrument for primary care: findings from the Sur-vey of Health, Ageing and Retirement in Europe (SHARE). BMC Geriatr 10:57
Rothman MD, Leo-Summers L, Gill TM (2008) Prognostic significance of potential frailty criteria. J Am Geriatr Soc 56:2211–2216
Seematter-Bagnoud L, Santos-Eggimann B, Rochat S, Martin E, Karmaniola A, Aminian K, Piot-Ziegler C, Bula CJ (2010) Vulnerability in high-functioning persons aged 65 to 70 years: the importance of the fear factor. Aging Clin Exp Res 22:212–218
Singh-Manoux A, Hillsdon M, Brunner E, Marmot M (2005) Effects of physical activity on cognitive functioning in middle age: evidence from the Whitehall II prospective cohort study. Am J Public Health 95:2252–2258 Srinivas-Shankar U, Roberts SA, Connolly MJ, O'Connell MD,
Adams JE, Oldham JA, Wu FC (2010) Effects of testoster-one on muscle strength, physical function, body composi-tion, and quality of life in intermediate-frail and frail elderly men: a randomized, double-blind, placebo-controlled study. J Clin Endocrinol Metab 95:639–650 Sternberg SA, Wershof SA, Karunananthan S, Bergman H,
Clarfield AM (2011) The identification of frailty: a system-atic literature review. [Review]. J Am Geriatr Soc 59:2129–2138
Tan EJ, Rebok GW, Yu Q, Frangakis CE, Carlson MC, Wang T, Ricks M, Tanner EK, McGill S, Fried LP (2009) The long-term relationship between high-intensity volunteering and physical activity in older African American women. J Gerontol B Psychol Sci Soc Sci 64:304–311
The NHS Information Centre for health and social care (2011) Hospital Episode Statistics (HES) http://www.hesonli ne.nhs.uk. Accessed 25 January 2011
Wong CH, Weiss D, Sourial N, Karunananthan S, Quail JM, Wolfson C, Bergman H (2010) Frailty and its association with disability and comorbidity in a community-dwelling sample of seniors in Montreal: a cross-sectional study. Aging Clin Exp Res 22:54–62
Woods NF, LaCroix AZ, Gray SL, Aragaki A, Cochrane BB, Brunner RL, Masaki K, Murray A, Newman AB, Women’s Health Initiative (2005) Frailty: emergence and consequen-ces in women aged 65 and older in the Women's Health Initiative Observational Study. J Am Geriatr Soc 53:1321– 1330