HAL Id: hal-01587559
https://hal.archives-ouvertes.fr/hal-01587559
Submitted on 17 Sep 2020
HAL is a multi-disciplinary open access
archive for the deposit and dissemination of
sci-entific research documents, whether they are
pub-lished or not. The documents may come from
teaching and research institutions in France or
abroad, or from public or private research centers.
L’archive ouverte pluridisciplinaire HAL, est
destinée au dépôt et à la diffusion de documents
scientifiques de niveau recherche, publiés ou non,
émanant des établissements d’enseignement et de
recherche français ou étrangers, des laboratoires
publics ou privés.
Intensification of tropical Pacific biological productivity
due to volcanic eruptions
Megumi O. Chikamoto, Axel Timmermann, Masakazu Yoshimori, Flavio
Lehner, Audine Laurian, Ayako Abe-Ouchi, Anne Mouchet, Fortunat Joos,
Christoph C. Raible, Kim M. Cobb
To cite this version:
Megumi O. Chikamoto, Axel Timmermann, Masakazu Yoshimori, Flavio Lehner, Audine Laurian, et
al.. Intensification of tropical Pacific biological productivity due to volcanic eruptions. Geophysical
Research Letters, American Geophysical Union, 2016, 43 (3), pp.1184 - 1192. �10.1002/2015GL067359�.
�hal-01587559�
Intensification of tropical Pacific biological productivity
due to volcanic eruptions
Megumi O. Chikamoto1, Axel Timmermann1, Masakazu Yoshimori2,3, Flavio Lehner4,5, Audine Laurian1, Ayako Abe-Ouchi3,6, Anne Mouchet7,8, Fortunat Joos4,
Christoph C. Raible4, and Kim M. Cobb9
1International Pacific Research Center, University of Hawaii at Manoa, Honolulu, Hawaii, USA,2Faculty of Environmental
Earth Science, Hokkaido University, Sapporo, Japan,3Atmosphere and Ocean Research Institute, University of Tokyo, Kashiwa, Japan,4Climate and Environmental Physics, Physics Institute and Oeschger Centre for Climate Change Research,
University of Bern, Bern, Switzerland,5National Center for Atmospheric Research, Boulder, Colorado, USA,6Japan Agency
for Marine-Earth Science and Technology, Yokohama, Japan,7Laboratoire des Sciences du Climat et de l’Environnement,
IPSL-CEA-CNRS-UVSQ, Gif-sur-Yvette, France,8Astrophysics and Geophysics Institute, University of Liege, Liege, Belgium, 9Earth and Atmospheric Sciences, Georgia Institute of Technology, Atlanta, Georgia, USA
Abstract
Major volcanic eruptions generate widespread ocean cooling, which reduces upper ocean stratification. This effect has the potential to increase nutrient delivery into the euphotic zone and boost biological productivity. Using externally forced last millennium simulations of three climate/Earth System models (Model for Interdisciplinary Research On Climate (MIROC), Community Earth System Model (CESM), and LOch-Vecode-Ecbilt-CLio-agIsm Model (LOVECLIM)), we test the hypothesis that large volcanic eruptions intensify nutrient-driven export production. It is found that strong volcanic radiative forcing enhances the likelihood of eastern Pacific El Niño-like warming in CESM and LOVECLIM. This leads to an initial reduction of nutrients and export production in the eastern equatorial Pacific. However, this initial response reverses after about 3 years in association with La Niña cooling. The resulting delayed enhancement of biological production resembles the multiyear response in MIROC. The model simulations show that volcanic impacts on tropical Pacific dynamics and biogeochemistry persist for several years, thus providing a new source for potential multiyear ecosystem predictability.1. Introduction
Several explosive volcanic eruptions occurred during the last millennium [Crowley, 2000; Gao et al., 2008]. Associated emissions of sulfate aerosols increased Earth’s planetary albedo and decreased surface tempera-tures and ocean heat content on timescales of years to several decades [Church et al., 2005; Jungclaus et al., 2010; Harris and Highwood, 2011]. Earth System models simulate a fast response ((1 year)) of the terres-trial biosphere to volcanic eruptions [Brovkin et al., 2010; Tjiputra and Otterå, 2011; Frölicher et al., 2013]. The volcanic ash deposition has also been linked to short-term regional ocean fertilization and enhanced marine productivity [Duggen et al., 2010; Hamme et al., 2010].
In addition to the direct effects of volcanic eruptions on terrestrial and marine ecosystems, volcano-related ocean dynamical and thermodynamical changes may affect ocean biogeochemical cycles via impacts on ocean stratification, mixing, and upper ocean circulation [Mignot et al., 2011]. These processes can affect nutri-ent delivery to the euphotic zone and thus biological productivity. This may lead to a persistnutri-ent response that can last up to two decades [Frölicher et al., 2011]. Furthermore, the emergence of El Niño events, which can be triggered by volcanic eruptions [Adams et al., 2003; McGregor et al., 2010], can generate long-term shifts in marine productivity [Séférian et al., 2014] and in the ocean carbon cycle [Keller et al., 2015]. Such a long-term response may also contribute to enhanced multiyear predictability of nutrients and lower trophic-level vari-ations [Séférian et al., 2014; Chikamoto et al., 2015]. This potential predictability may link to the important societal issue of long-term prediction of fish abundance.
To investigate the effect of volcanic eruptions on marine productivity, we focus on one of the most productive regions on our planet, the tropical Pacific. The climatic and biogeochemical responses to volcanic eruptions in climate models may depend on ocean initial conditions [Timmreck et al., 2009; Ohba et al., 2013],
RESEARCH LETTER
10.1002/2015GL067359
Key Points:
• Major volcanic eruptions can impact multiyear biological production in the tropical Pacific
• Long-term ocean response to volcanic forcing is obtained in three Earth System models Supporting Information: • Supporting Information S1 Correspondence to: M. O. Chikamoto, megumich@hawaii.edu Citation:
Chikamoto, M. O., A. Timmermann, M. Yoshimori, F. Lehner, A. Laurian, A. Abe-Ouchi, A. Mouchet, F. Joos, C. C. Raible, and K. M. Cobb (2016), Intensification of tropical Pacific biological productivity due to volcanic eruptions, Geophys. Res. Lett., 43, 1184–1192, doi:10.1002/2015GL067359.
Received 9 DEC 2015 Accepted 13 JAN 2016
Accepted article online 15 JAN 2016 Published online 1 FEB 2016
©2016. American Geophysical Union. All Rights Reserved.
Geophysical Research Letters
10.1002/2015GL067359
the representation of marine ecosystems, or the parameterization of atmospheric aerosol effects [Timmreck, 2012]. To determine the forced signal and address resulting uncertainties in ecosystem responses to vol-canic eruptions, we use a suite of last millennium simulations conducted with three different climate/Earth System models.
2. Model Experiments
The climate models used here are the coupled climate model MIROC [K-1 Model Developers, 2004] in combina-tion with an off-line biogeochemical tracer model [Chikamoto et al., 2012], the Community Earth System Model (CESM) [Hurrell et al., 2013], and the fully coupled atmospheric-sea-ice-vegetation-biogeochemistry model LOVECLIM [Goosse et al., 2010]. More details on the model setup are provided in the supporting information. The last millennium simulation conducted with MIROC (LM-MIROC) [Yiou et al., 2012] uses time-varying exter-nal forcings due to orbital changes [Berger, 1978], atmospheric greenhouse gases following the protocol of the Paleoclimate and Model Intercomparison Project 3, PMIP3 (https://wiki.lsce.ipsl.fr/pmip3/doku.php/ pmip3:design:lm:final) [Schmidt et al., 2011], and total solar irradiance and volcanic radiation changes (Text S1 and Table S1 in the supporting information). To quantify marine biogeochemical responses to these external forcings, we use an off-line three-dimensional marine biogeochemical model [Chikamoto et al., 2012] forced by monthly LM-MIROC climate output fields from 850 Common Era (C.E.) to 1850 C.E. The last millennium sim-ulation conducted with CESM (LM-CESM) [Lehner et al., 2015] follows the protocols of PMIP3 [Schmidt et al., 2011] and includes changes in aerosol optical depth due to volcanic forcing [Gao et al., 2008] (Figure S1a), land use changes [Pongratz et al., 2008], and fossil fuel emissions (post 1750 C.E., following Andres et al. [2012]) (Table S1). The LOVECLIM last millennium simulation (LM-LOVEC) applies the total solar irradiance changes [Muscheler et al., 2007] (Figure S1b) and changes due to volcanic eruptions [Crowley, 2000] (Figure S1a) as external radiative forcing and land use changes after 1850 C.E. [Houghton, 2003]. To better separate forced sig-nals from internal climate noise, we conducted a 10-member ensemble with LM-LOVEC. The analysis focuses on the period 850 C.E. to 1850 C.E.
3. Results
The range of simulated low-frequency variability in Northern Hemisphere mean surface temperature in LM-MIROC, LM-CESM, and LM-LOVEC is within the range of the proxy reconstructions (gray shading from Figure 5.8 in IPCC AR5 [Masson-Delmotte et al., 2013]) (Figure S1c). The short-term large temperature drops are due to the volcanic eruptions (Figure S1a). Compared to the reconstruction, the temperature anomalies dur-ing strong volcanic eruptions are overestimated in LM-MIROC and LM-CESM. This mismatch can be due either to systematic model errors associated with the radiative effects of volcanic aerosols [Timmreck et al., 2009;
Timmreck, 2012] or to a potential underestimation of short-term cooling events as inferred from tree-ring
proxy records combining different types of trees [Mann et al., 2012]. The issue of potential proxy biases during volcanic eruptions still remains controversial [Anchukaitis et al., 2013; Sigl et al., 2014; Stoffel et al., 2015]. To determine the ocean response to volcanic eruptions, we first focus on the ∼1258 C.E. eruption (at Samalas). In 1258 C.E., the simulated atmospheric 2 m Northern Hemisphere temperatures dropped by 2.2, 3.0, and 0.6 ∘C in LM-MIROC, LM-CESM, and LM-LOVEC, respectively (Figure S1c). The 1258 C.E. Northern Hemisphere cooling was estimated to be ∼ 2.0∘C in a recent paleoclimate reconstruction [Mann et al., 2012]. According to our model experiments, the 1258 C.E. eruption led to a global mean sea surface temperature (SST) reduc-tion of 1.4 ∘C in LM-MIROC, 2.2 ∘C in LM-CESM, and 0.3 ∘C in LM-LOVEC, corresponding to short-term SST sensitivities of 0.07, 0.07, and 0.03 K/(W m−2), respectively (not shown). For moderate-large volcanic forcing
(< −3 W m−2), the trends of SST reduction in LM-MIROC and LM-CESM are similar to previous observational
and model estimates [Rayner et al., 2003; Church et al., 2005; Stenchikov et al., 2009] (Figure S2). We conclude that these two models reasonably reproduce the temperature amplitude in response to volcanic eruptions, whereas the LOVECLIM sensitivity is too low [Plattner et al., 2008].
To identify the response of the tropical Pacific to major volcanic forcing, we calculate the composites of temperature anomalies averaged over the euphotic zone (defined here as depth from 0 to 150 m where photosynthesis is set to occur in CESM) for major volcanic eruptions (<−8 W m−2for CESM and MIROC and
< −5 W m−2for LOVECLIM) during the period 850–1850 C.E. (Figure 1). Using these thresholds as criteria
for major volcanic forcing, our composite is based on the eruptions in 1258 C.E. (at Samalas), 1452 C.E. (or 1453 C.E., at Kuwae), and 1815 C.E. (or 1816 C.E., at Tambora) for all three models and additional four cases
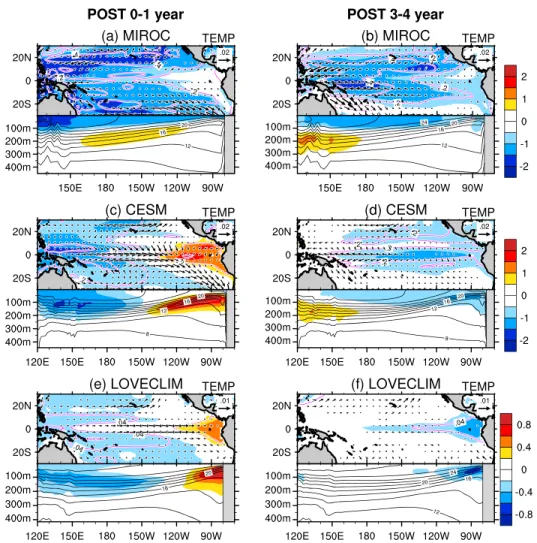
Figure 1. Composite maps and zonal-depth sections of temperature anomalies in (a and b) MIROC, (c and d) CESM, and
(e and f ) LOVECLIM. Maps show the anomalies of euphotic-zone temperature (∘C, shaded), wind stress on the ocean
(N m−1, arrows) and euphotic-zone density (g cm−3, magenta contours). Zonal-depth sections show the temperature
anomalies (∘C, shaded) and the 1000 year mean temperature (∘C, black contours) averaged between 10∘S and 10∘N.
Anomalies are relative to the 1000 year mean. Composite is selected in cases of annual volcanic forcing smaller than
−8 W m−2in MIROC and CESM or than−5 W m−2in LOVECLIM. Contour intervals are (magenta) 0.2 g m−3in MIROC
and CESM and 0.04 g m−3in LOVECLIM and (black) 2∘C. Zero contours are omitted.
in 1275, 1600, 1641, and 1762 C.E. for CESM. The composites are obtained from the average of the responses for 0–1 or 3–4 years in the selected strong volcanic eruptions, which document the fast response of the upper ocean dynamics and biota to the major volcanic eruptions. The anomalies are calculated relative to the 1000 year mean (850–1850 C.E.). Additionally, we show changes of seawater density averaged in the euphotic zone as an indicator for upper ocean stratification. Positive upper ocean density anomalies are associated with reduced stratification (not shown).
The strong volcanic forcing affects simulated tropical Pacific temperatures considerably. The LM-MIROC sim-ulates a strong cooling in the western tropical Pacific and a weaker cooling in the eastern tropical Pacific (Figure 1a). In this model we find an overall increase in upper ocean density and thus a reduction of stratifica-tion for years 0–4 after the erupstratifica-tion. The vertical profile of temperature anomalies shows a more pronounced cooling in the western equatorial Pacific (Figures 1a and 1b), which suggests that the change in thermocline depth is small at the eastern equatorial Pacific. In LM-CESM and LM-LOVEC, warming is prominent in the east-ern equatorial Pacific Ocean in the first 2 years following the eruptions (Figures 1c and 1e), although cooling occurs widely in the tropical and subtropical regions. The eastern equatorial Pacific warming, which is associ-ated with the increased upper ocean stratification, reduces the Walker Circulation and the equatorial surface trade winds. In CESM and LOVECLIM, the eastern equatorial Pacific thermocline deepens for the first 0– 2 years after the eruption and shoals in years 3 and 4. In these two models, El Niño conditions reverse to weak La Niña
Geophysical Research Letters
10.1002/2015GL067359
Figure 2. Same as Figure 1 but for euphotic-zone (a–d) nitrate and (e and f ) phosphate concentration (mmol m−3,
shaded) and export production (molC m−2yr−1, contours). Contour levels are (magenta) 0.3, 1, 2 in MIROC and CESM
and 0.15, 0.5 mmol m−2yr−1in LOVECLIM, and (black) 5 mmol m−3. The phosphate anomaly in LOVECLIM is multiplied
by 16 (Redfield stoichiometric ratio of N:P) for the comparison with the nitrate anomaly in MIROC and CESM.
conditions in years 3–4 (Figures 1d and 1f ), which in turn decreases upper ocean stratification and enhances vertical mixing (Figures 1d and 1f ). Note that the response in LM-LOVEC is much weaker than in LM-CESM (Figure 1).
In scatterplots of volcanic forcing and the tropical Pacific SST change (Figure S2), in LM-LOVEC the regression slope is considerably smaller compared to LM-MIROC and LM-CESM. The standard deviation of 10 ensem-bles shows relatively small spread of temperature responses to the strongest volcanic eruption in LOVECLIM; hence, the weaker SST response in LOVECLIM robustly reflects the model’s weak sensitivity to volcanic forc-ing. Moreover, for the same global surface cooling, LOVECLIM has a weaker tropical SST response compared to the other Earth System models (Figure S3).
The simulated initial El Niño-like warming in LM-LOVEC and LM-CESM is consistent with proxy evidence showing an increased El Niño probability after strong volcanic eruptions [Adams et al., 2003; McGregor et al., 2010]. This is also consistent with the initial El Niño-like sea surface height response found in a 122 member multimodel ensemble analyzed in Maher et al. [2015] that suggests preferred dynamical El Niño conditions (superimposed on an overall radiative cooling) after volcanic eruptions that occurred between 1850 and 2006. As discussed in McGregor and Timmermann [2011], an initial cooling can be quickly followed by El Niño conditions. This further complicates the detailed comparison between model and proxy data. Moreover, the response may strongly depend on the ocean initial conditions that exist during the onset of the volcanic forcing [Self et al., 1997; Ohba et al., 2013].
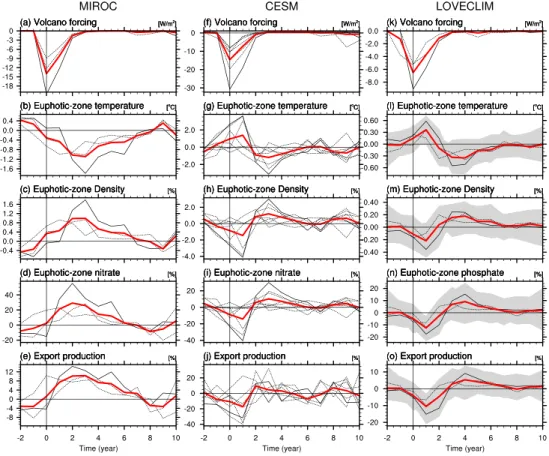
Figure 3. Time series of annual mean volcanic forcing (W m−2), euphotic-zone temperature anomaly (∘C), and the fractions (%) of euphotic-zone density, euphotic-zone nitrate and phosphate, and net primary production respect to the 1000 year mean in (a–e) MIROC, (f–j) CESM, and (k–o) LOVECLIM. Data are the area-averaged variables in the eastern
equatorial Pacific (140∘W–80∘W and 5∘S–5∘N). Black dotted lines are the time series in cases of larger annual volcanic
eruption, and black solid lines are the time series in cases of the 1258 C.E. volcanic eruption. Red lines indicate the
composite average of all dotted, and solid lines shaded in Figures 3l–3o is the spread of±1𝜎of 10 ensembles.
Through changes in upper ocean stratification, the volcanic eruptions affect nutrient delivery to the euphotic zone. In LM-MIROC, the nitrate concentration in the euphotic zone increases in the eastern equatorial Pacific. This enhanced nutrient delivery lasts for at least 4 years after the eruption (Figures 2a and 2b). Since the anomalous surface winds and upwelling are small in the eastern equatorial Pacific (Figures 1a and 1b) and the signal of enhanced production is small in the eastern equatorial Pacific (contours in Figures 2a and 2b), the euphotic zone nutrient anomalies can be explained in terms of the mean upwelling of an anomalous ver-tical nutrient gradient. LM-CESM shows a very different behavior. The nitrate concentration first decreases in the eastern equatorial Pacific after the eruption due to suppressed upwelling (Figures 1c and 2c) and then increases after 3–4 years in association with enhanced upwelling in the equatorial upwelling regions (Figures 1d and 2d). That is consistent with the nutrient response to altered upwelling patterns in this region, shown in the 1997–1998 El Niño/La Niña status [Strutton et al., 2008]. The nutrient change can be seen along the mean nutricline depth (Figures 2c and 2d). Typically, surface mixing at the subtropical ocean deepens the nutricline depth through the penetration of nutrient-rich water to the subsurface, while the subsurface stratification in turn shoals the nutricline depth by reducing nutrient supply to the subsurface [Cermeño et al., 2008]. This suggests that the subsurface nutrient change is related to both ocean dynamics and surface mixing change. As in LM-CESM, LM-LOVEC shows qualitatively similar changes in phosphate concentrations (Figures 2e and 2f ), but the corresponding anomalies are induced by changes in subsurface water density and mixing (contours in Figures 1e and 1f ).
The changes in nutrient concentrations trigger changes in primary and export production. LM-MIROC shows an increase in export production (EP) over the tropical Pacific (Figure 2b), typically for enhanced productivity under the La Niña condition [Behrenfeld et al., 2006; Schneider et al., 2008]. In LM-CESM, EP decreases during the first 2 years due to nutrient deficiency (Figure 2c) but increases subsequently, especially in the western
Geophysical Research Letters
10.1002/2015GL067359
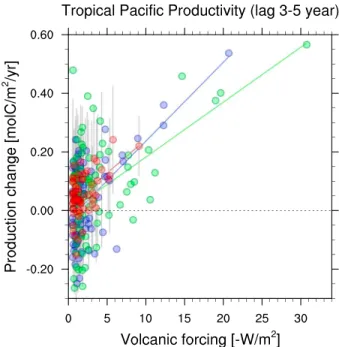
Figure 4. Scatterplots of volcanic forcing (−W m−2) and the anomaly of export production (molC m−2yr−1) with
3–5 years mean lag from the 1000 year mean (area mean of 120∘E–80∘W, 5∘S–5∘N) in MIROC (blue circles), CESM
(green circles), and LOVECLIM ensemble mean (red circles). Grey lines are standard deviation of 10 ensemble members in LOVECLIM. Blue, green, and red lines are the regression between the volcanic forcing and EP change in each model.
equatorial Pacific (Figure 2d). In this region where silicate may be a limiting factor for diatom photosynthesis [see also Chikamoto et al., 2015], the rather large changes in productivity are due to the increase in silicate con-centration (not shown). In LM-LOVEC, EP also decreases during posteruption years, 0–1 years and increases during years 3–4 in response to the phosphate redistribution.
One of the goals of this study is to investigate how long the response of tropical ocean biogeochemistry to volcanic radiative forcing may last. A more detailed view on the temporal evolution in ocean physics and productivity is provided by strong volcano composite time series, showing temperature and nutrient con-centration averaged over the euphotic zone (hereafter called euphotic-zone temperature and euphotic-zone nutrient concentration), ocean stratification and EP. The composite is based on the selected major volcanic eruptions described above (Figure 3).
The euphotic-zone temperature response in the eastern equatorial Pacific lasts for almost a decade in LM-MIROC (Figure 3b) and for up to 5 years in LM-CESM (Figure 3g) and LM-LOVEC (Figure 3l), consistent with the multimodel results of long-term oceanic cooling after the Krakatoa eruption in 1883 C.E. [Gleckler et al., 2006]. In LM-MIROC, the tropical cooling generates a surface-water density increase (Figure 3c) and reduced stratification, which leads to a long-lasting response (up to 8 years) of euphotic-zone nitrate concentrations and EP in the eastern tropical Pacific (Figures 3d and 3e). After the termination of posteruption El Niño-like con-ditions in LM-CESM and LM-LOVEC, the nutrient concentrations and EP in these models increase, with robust signals persisting for up to 7 years. It is interesting to note that the LM-CESM simulation features a long-term EP increase also in the western tropical Pacific (Figure 2d). The western-side response is also captured by the El Niño-driven anomaly of primary production in a CESM simulation [Keller et al., 2015]. Therefore, the large biological sensitivity at the western tropical Pacific may reflect the characteristics of the mean biological pattern in CESM.
To further characterize the large-scale productivity response to volcanic eruptions, we analyze the produc-tivity of the entire tropical Pacific 3–5 years after the volcanic event, stratified according to the amplitude of the applied volcanic forcing (Figure 4). For weaker volcanic forcing (between −2 and −5 W m−2), the delayed
EP changes are not very pronounced and can be either positive or negative. However, for stronger eruptions (< −5 W m−2), we see an emerging relationship between the tropical Pacific EP response and the amplitude
of the eruption. Even though the amplitude of simulated EP response is model dependent, all three models show an EP increase in the tropical Pacific due to large volcanic eruptions.
4. Discussion and Conclusions
Transient climate responses to volcanic eruptions are analyzed for the period from 850 to 1850 C.E. using the three climate/Earth System models MIROC, CESM, and LOVECLIM. We start on with the hypothesis that oceanic cooling increases the nutrient transport to the surface via increased upper ocean mixing, which may boost primary and export production. However, the simulated initial response in the tropical Pacific is very different among the three models. LOVECLIM and CESM simulate an initial El Niño-like warming with a corresponding equatorial trade wind weakening, whereas MIROC simulates a long-term cooling in response to strong vol-canic radiative forcing. Proxy evidence shows an enhanced probability of El Niño events to occur after strong volcanic eruptions [Adams et al., 2003; McGregor et al., 2010]. But processes involved are more complex; vol-canic radiative forcing may change the phase of the El Niño Southern Oscillation (ENSO) cycle, by promoting La Niña-like cooling initially and El Niño-like warming for the following two seasons through the ocean heat discharge mechanism [McGregor and Timmermann, 2011]. Such a seasonal variability cannot be confirmed from the presented annual mean analysis in three models. Also, the Pinatubo eruption is an unlikely candidate for an El Niño trigger, because the eruption occurred after the initial El Niño development [Self et al., 1997;
Thomas et al., 2009].
From the modeling study of Maher et al. [2015], it is suggested that volcanic forcing causes on average an ini-tial El Niño-like response, with weakened zonal SST gradients in the tropical Pacific. However, this response is partly offset by an overall zonal mean cooling of the tropical Pacific. In their study the multiyear response strongly resembles a La Niña situation. This mechanism supports the findings presented here for the LM-CESM and LM-LOVEC simulations. For the MIROC composite we find that volcanic forcing peaks at a time of weak eastern Pacific cooling (Figure 3b), whereas the CESM composite members are biased more toward weak El Niño initial conditions in the eruption year (Figure 3g). The climate sensitivity to volcanic forcing may fur-ther depend on the phase of the seasonal cycle and whefur-ther the tropical climate system is already primed for an El Niño or a La Niña state [Ohba et al., 2013].
ENSO-state dependent volcanic sensitivities have also been discussed in the context of CO2changes [Frölicher
et al., 2013]. According to this study, the CO2response to volcanic forcing is considerably larger when a volcanic eruption occurs in boreal winter or during El Niño conditions as compared to the boreal summer season of a La Niña initial state [Frölicher et al., 2013]. Such effects can also influence the biogeochemical responses discussed in our study.
In spite of very different initial trajectories, our study demonstrates that the simulated long-term (2–6 years) response of the tropical Pacific to a sharp reduction in shortwave radiation is quite similar among the three models. It is characterized by surface cooling, reduced stratification, and enhanced eastern tropical Pacific primary productivity. The anomalies for export production range from 10 % of the long-term mean in CESM and LOVECLIM to up to 50% in MIROC.
In the eastern equatorial Pacific, in response to strong volcanic eruptions, surface cooling and enhanced solubility tend to decrease ocean outgassing (positive ocean carbon uptake anomaly) and the atmospheric carbon dioxide concentration (pCO2), whereas more upwelling of carbon-rich water and thus less efficient by
nutrient utilization contribute to increase outgassing. A positive oceanic carbon uptake anomaly after major volcanic eruptions is consistently simulated by CESM [Lehner et al., 2015], MIROC, and LOVECLIM. However, the contributions of the carbon uptake in the eastern tropical Pacific to atmospheric pCO2are relatively small (few ppmv). The atmospheric pCO2is also influenced by the air-sea CO2 flux outside the tropical Pacific,
terrestrial carbon uptake, and possible feedbacks on the climate state.
All three models used here exhibit multiyear persistence of anomalies in biological productivity following strong volcanic forcing. The long-term memory can be identified even after the volcanic forcing has subsided (Figure 3). Long-term (up to 5 years) posteruption anomalies of upper tropical Pacific ocean temperature and export production of organic carbon anomalies were also documented in a recent study [Frölicher et al., 2011], which may be related to the mechanisms of slow ocean dynamical and ecosystem adjustment to short-term climatic forcing [Séférian et al., 2014; Swingedouw et al., 2015; Chikamoto et al., 2015]. We propose that this new source of potential physical and biogeochemical predictability needs to be considered in ongoing decadal prediction efforts.
Geophysical Research Letters
10.1002/2015GL067359
References
Adams, J. B., M. E. Mann, and C. M. Ammann (2003), Proxy evidence for an El Niño-like response to volcanic forcing, Nature, 426(6964), 274–278, doi:10.1038/nature02101.
Anchukaitis, K. J., et al. (2013), Tree-ring-reconstructed summer temperatures from northwestern North America during the last nine centuries*, J. Clim., 26(10), 3001–3012, doi:10.1175/JCLI-D-11-00139.1.
Andres, R. J., et al. (2012), A synthesis of carbon dioxide emissions from fossil-fuel combustion, Biogeosciences, 9, 1845–1871, doi:10.5194/bg-9-1845-2012.
Behrenfeld, M. J., et al. (2006), Climate-driven trends in contemporary ocean productivity, Nature, 444(7120), 752–755, doi:10.1038/nature05317.
Berger, A. (1978), Long-term variations of daily insolation and Quaternary climatic changes, J. Atmos. Sci., 35(12), 2362–2367, doi:10.1175/1520-0469(1978)035<2362:LTVODI>2.0.CO;2.
Brovkin, V., S. J. Lorenz, J. Jungclaus, T. Raddatz, C. Timmreck, C. H. Reick, J. Segschneider, and K. Six (2010), Sensitivity of a coupled climate-carbon cycle model to large volcanic eruptions during the last millennium, Tellus B, 62(5), 674–681, doi:10.1111/j.1600-0889.2010.00471.x.
Cermeño, P., S. Dutkiewicz, R. P. Harris, M. Follows, O. Schofield, and P. G. Falkowski (2008), The role of nutricline depth in regulating the ocean carbon cycle, Proc. Natl. Acad. Sci., 105(51), 20,344–20,349, doi:10.1073/pnas.0811302106.
Chikamoto, M. O., A. Abe-Ouchi, A. Oka, R. Ohgaito, and A. Timmermann (2012), Quantifying the ocean’s role in glacial CO2reductions, Clim. Past, 8(2), 545–563, doi:10.5194/cp-8-545-2012.
Chikamoto, M. O., A. Timmermann, Y. Chikamoto, H. Tokinaga, and N. Harada (2015), Mechanisms and predictability of multiyear ecosystem variability in the North Pacific, Global Biogeochem. Cycles, 29, 2001–2019, doi:10.1002/2015GB005096.
Church, J. A., N. J. White, and J. M. Arblaster (2005), Significant decadal-scale impact of volcanic eruptions on sea level and ocean heat content, Nature, 438(7064), 74–77, doi:10.1038/nature04237.
Crowley, T. J. (2000), Causes of climate change over the past 1000 years, Science, 289(5477), 270–277, doi:10.1126/science.289.5477.270. Duggen, S., N. Olgun, P. Croot, L. J. Hoffmann, H. Dietze, P. Delmelle, and C. Teschner (2010), The role of airborne volcanic ash for the surface
ocean biogeochemical iron-cycle: A review, Biogeosciences, 7(3), 827–844, doi:10.5194/bg-7-827-2010.
Frölicher, T., F. Joos, and C. Raible (2011), Sensitivity of atmospheric CO2and climate to explosive volcanic eruptions, Biogeosciences, 8(8), 2317–2339, doi:10.5194/bg-8-2317-2011.
Frölicher, T. L., F. Joos, C. C. Raible, and J. L. Sarmiento (2013), Atmospheric CO2response to volcanic eruptions: The role of ENSO, season, and variability, Global Biogeochem. Cycles, 27(1), 239–251, doi:10.1002/gbc.20028.
Gao, C., A. Robock, and C. Ammann (2008), Volcanic forcing of climate over the past 1500 years: An improved ice core-based index for climate models, J. Geophys. Res., 113, D23111, doi:10.1029/2008JD010239.
Gleckler, P., T. Wigley, B. Santer, J. Gregory, K. AchutaRao, and K. Taylor (2006), Volcanoes and climate: Krakatoa’s signature persists in the ocean, Nature, 439(7077), 675, doi:10.1038/439675a.
Goosse, H., et al. (2010), Description of the Earth system model of intermediate complexity LOVECLIM version 1.2, Geosci. Model Dev., 3(2), 603–633, doi:10.5194/gmd-3-603-2010.
Hamme, R. C., et al. (2010), Volcanic ash fuels anomalous plankton bloom in subarctic northeast Pacific, Geophys. Res. Lett., 37, L19604, doi:10.1029/2010GL044629.
Harris, B. M., and E. Highwood (2011), A simple relationship between volcanic sulfate aerosol optical depth and surface temperature change simulated in an atmosphere-ocean general circulation model, J. Geophys. Res., 116, D05109, doi:10.1029/2010JD014581.
Houghton, R. A. (2003), Revised estimates of the annual net flux of carbon to the atmosphere from changes in land use and land management 1850–2000, Tellus B, 55(2), 378–390, doi:10.1034/j.1600-0889.2003.01450.x.
Hurrell, J. W., et al. (2013), The community Earth System model: A framework for collaborative research, Bull. Am. Meteorol. Soc., 94(9), 1339–1360, doi:10.1175/BAMS-D-12-00121.1.
Jungclaus, J., et al. (2010), Climate and carbon-cycle variability over the last millennium, Clim. Past, 6, 723–737, doi:10.5194/cp-6-723-2010. K-1 Model Developers (2004), K-1 coupled model (MIROC) description, K-1 Tech. Rep. No. 1, edited by H. Hasumi and S. Emori, 34 pp., Center
for Clim. Syst. Res., Univ. of Tokyo.
Keller, K. M., F. Joos, F. Lehner, and C. C. Raible (2015), Detecting changes in marine responses to ENSO from 850 to 2100 CE: Insights from the ocean carbon cycle, Geophys. Res. Lett., 42, 518–525, doi:10.1002/2014GL062398.
Lehner, F., F. Joos, C. C. Raible, J. Mignot, A. Born, K. M. Keller, and T. F. Stocker (2015), Climate and carbon cycle dynamics in a CESM simulation from 850 to 2100 CE, Earth Syst. Dyn., 6(2), 411–434, doi:10.5194/esd-6-411-2015.
Maher, N., S. McGregor, M. H. England, and A. S. Gupta (2015), Effects of volcanism on tropical variability, Geophys. Res. Lett., 42, 6024–6033, doi:10.1002/2015GL064751.
Mann, M. E., J. D. Fuentes, and S. Rutherford (2012), Underestimation of volcanic cooling in tree-ring-based reconstructions of hemispheric temperatures, Nat. Geosci., 5, 202–205, doi:10.1038/ngeo1394.
Masson-Delmotte, V., et al. (2013), Information from paleoclimate archives, in Climate Change 2013: The Physical Science Basis. Contribution of Working Group I to the Fifth Assessment Report of the Intergovernmental Panel on Climate Change, edited by T. F. Stocker et al., pp. 383–464, Cambridge Univ. Press, Cambridge, U. K.
McGregor, S., and A. Timmermann (2011), The effect of explosive tropical volcanism on ENSO, J. Clim., 24(8), 2178–2191, doi:10.1175/2010JCLI3990.1.
McGregor, S., A. Timmermann, and O. Timm (2010), A unified proxy for ENSO and PDO variability since 1650, Clim. Past, 6(1), 1–17, doi:10.5194/cp-6-1-2010.
Mignot, J., M. Khodri, C. Frankignoul, and J. Servonnat (2011), Volcanic impact on the Atlantic Ocean over the last millennium, Clim. Past, 7(4), 1439–1455, doi:10.5194/cp-7-1439-2011.
Muscheler, R., F. Joos, J. Beer, S. A. Müller, M. Vonmoos, and I. Snowball (2007), Solar activity during the last 1000 yr inferred from radionuclide records, Quat. Sci. Rev., 26, 82–97, doi:10.1016/j.quascirev.2006.07.012.
Ohba, M., H. Shiogama, T. Yokohata, and M. Watanabe (2013), Impact of strong tropical volcanic eruptions on ENSO simulated in a coupled GCM, J. Clim., 26(14), 5169–5182, doi:10.1175/JCLI-D-12-00471.1.
Plattner, G.-K., et al. (2008), Long-term climate commitments projected with climate-carbon cycle models, J. Clim., 21(12), 2721–2751, doi:10.1175/2007JCLI1905.1.
Pongratz, J., C. Reick, T. Raddatz, and M. Claussen (2008), A reconstruction of global agricultural areas and land cover for the last millennium, Global Biogeochem. Cycles, 22, GB3018, doi:10.1029/2007GB003153.
Acknowledgments
This work was supported by the JAMSTEC-IPRC Collaborative Studies (JICS) project. Outputs of the last millennium simulations in the MIROC and LOVECLIM model can be obtained from Megumi O. Chikamoto (megumich@hawaii.edu) and the NCAR CESM from C. C. Raible (raible@climate.unibe.ch). The external forcing data for the last millennium simulations in this paper are properly cited and referred to in the table in the supporting information. The MIROC simulation was carried out on the Earth Simulator at JAMSTEC, Yokohama (Japan). F.L. is supported by an Early Postdoc Mobility fellowship from the Swiss National Science Foundation (SNSF). F.J. and C.C.R. acknowledge support by the Swiss National Science Foundation, the Swiss National Supercomputing Centre (CSCS), and by the European Project CARBOCHANGE (264879), which received funding from the European Commission’s Seventh Framework Programme (FP7/2007-2013).
Rayner, N., D. E. Parker, E. Horton, C. Folland, L. Alexander, D. Rowell, E. Kent, and A. Kaplan (2003), Global analyses of sea surface temperature, sea ice, and night marine air temperature since the late nineteenth century, J. Geophys. Res., 108(D14), 4407, doi:10.1029/2002JD002670.
Schmidt, G., et al. (2011), Climate forcing reconstructions for use in PMIP simulations of the last millennium (v1. 0), Geosci. Model Dev., 4(1), 33–45, doi:10.5194/gmd-4-33-2011.
Schneider, B., et al. (2008), Climate-induced interannual variability of marine primary and export production in three global coupled climate carbon cycle models, Biogeosciences, 5, 597–614, doi:10.5194/bg-5-597-2008.
Séférian, R., L. Bopp, M. Gehlen, D. Swingedouw, J. Mignot, E. Guilyardi, and J. Servonnat (2014), Multiyear predictability of tropical marine productivity, Proc. Natl. Acad. Sci., 111(32), 11,646–11,651, doi:10.1073/pnas.1315855111.
Self, S., M. Rampino, J. Zhao, and M. Katz (1997), Volcanic aerosol perturbations and strong El Nino events: No general correlation, Geophys. Res. Lett., 24(10), 1247–1250, doi:10.1029/97GL01127.
Sigl, M., et al. (2014), Insights from Antarctica on volcanic forcing during the Common Era, Nat. Clim. Change, 4(8), 693–697, doi:10.1038/nclimate2293.
Stenchikov, G., T. L. Delworth, V. Ramaswamy, R. J. Stouffer, A. Wittenberg, and F. Zeng (2009), Volcanic signals in oceans, J. Geophys. Res., 114, D16104, doi:10.1029/2008JD011673.
Stoffel, M., et al. (2015), Estimates of volcanic-induced cooling in the Northern Hemisphere over the past 1,500 years, Nat. Geosci., 8, 784–788, doi:10.1038/ngeo2526.
Strutton, P. G., W. Evans, and F. P. Chavez (2008), Equatorial Pacific chemical and biological variability, 1997–2003, Global Biogeochem. Cycles, 22, GB2001, doi:10.1029/2007GB003045.
Swingedouw, D., P. Ortega, J. Mignot, E. Guilyardi, V. Masson-Delmotte, P. G. Butler, M. Khodri, and R. Séférian (2015), Bidecadal north atlantic ocean circulation variability controlled by timing of volcanic eruptions, Nat. Commun., 6(6545), doi:10.1038/ncomms7545.
Thomas, M., M. Giorgetta, C. Timmreck, H.-F. Graf, and G. Stenchikov (2009), Simulation of the climate impact of Mt. Pinatubo eruption using ECHAM5-Part 2: Sensitivity to the phase of the QBO and ENSO, Atmos. Chem. Phys., 9(9), 3001–3009, doi:10.5194/acp-9-3001-2009. Timmreck, C. (2012), Modeling the climatic effects of large explosive volcanic eruptions, WIR Clim. Change, 3(6), 545–564,
doi:10.1002/wcc.192.
Timmreck, C., S. J. Lorenz, T. J. Crowley, S. Kinne, T. J. Raddatz, M. A. Thomas, and J. H. Jungclaus (2009), Limited temperature response to the very large AD 1258 volcanic eruption, Geophys. Res. Lett., 36, L21708, doi:10.1029/2009GL040083.
Tjiputra, J., and O. Otterå (2011), Role of volcanic forcing on future global carbon cycle, Earth Syst. Dyn., 2(1), 53–67, doi:10.5194/esd-2-53-2011.
Yiou, P., J. Servonnat, M. Yoshimori, D. Swingedouw, M. Khodri, and A. Abe-Ouchi (2012), Stability of weather regimes during the last millennium from climate simulations, Geophys. Res. Lett., 39, L08703, doi:10.1029/2012GL051310.

![IL lm~ ]])ffi@ liT~](data:image/gif;base64,R0lGODlhAQABAIAAAP///wAAACH5BAEAAAAALAAAAAABAAEAAAICRAEAOw==)