HAL Id: hal-00301557
https://hal.archives-ouvertes.fr/hal-00301557
Submitted on 1 Jan 2001
HAL is a multi-disciplinary open access
archive for the deposit and dissemination of
sci-entific research documents, whether they are
pub-lished or not. The documents may come from
teaching and research institutions in France or
abroad, or from public or private research centers.
L’archive ouverte pluridisciplinaire HAL, est
destinée au dépôt et à la diffusion de documents
scientifiques de niveau recherche, publiés ou non,
émanant des établissements d’enseignement et de
recherche français ou étrangers, des laboratoires
publics ou privés.
Hydrogeochemical precursors of strong earthquakes in
Kamchatka: further analysis
P. F. Biagi, R. Piccolo, A. Ermini, Y. Fujinawa, S. P. Kingsley, Y. M.
Khatkevich, E. I. Gordeev
To cite this version:
P. F. Biagi, R. Piccolo, A. Ermini, Y. Fujinawa, S. P. Kingsley, et al.. Hydrogeochemical precursors
of strong earthquakes in Kamchatka: further analysis. Natural Hazards and Earth System Science,
Copernicus Publications on behalf of the European Geosciences Union, 2001, 1 (1/2), pp.9-14.
�hal-00301557�
and Earth
System Sciences
Hydrogeochemical precursors of strong earthquakes in Kamchatka:
further analysis
P. F. Biagi1, R. Piccolo1, A. Ermini2, Y. Fujinawa3, S. P. Kingsley4, Y. M. Khatkevich5, and E. I. Gordeev5
1Dept. of Physics, University of Bari, 70126 Bari, Italy
2Dept. of Physics and Energy Science and Technology, University of Roma “Tor Vergata”, 00133 Rome, Italy 3National Research Institute for Earth Science and Disaster Prevention, Tsukuba, 305-0006, Japan
4Sheffield Centre for Earth Observation Science, University of Sheffield, Hicks Building, Sheffield S3 7RH, UK 5Experimental and Methodical Seismological Dept., Geophysical Service Russian Academy of Science,
Petropavlovsk-Kamchatsky 683006, Russia
Received: 27 April 2001 – Revised: 13 July 2001 – Accepted: 18 July 2001
Abstract. For many years, ion and gas content data have
been collected from the groundwater of three deep wells in the southern area of the Kamchatka peninsula, Russia. In the last ten years, five earthquakes with M > 6.5 have occurred within 250 km of the wells. In a previous study, we inves-tigated the possibility that the hydrogeochemical time series contained precursors. The technique used was to assume that each signal with an amplitude of three times the standard de-viation is an irregularity and we then defined anomalies as irregularities occurring simultaneously in the data for more than one parameter at each well. Using this method, we iden-tified 11 anomalies with 8 of them being possible successes and 3 being failures as earthquake precursors. Precursors were obtained for all five earthquakes that we considered. In this paper, we allow for the cross-correlation found between the gas data sets and in some cases, between the ion data sets. No cross-correlation has been found between gas and ion content data. Any correlation undermines the idea that an anomaly might be identified from irregularities appearing simultaneously on different parameters at each site. To refine the technique, we re-examine the hydrogeochemical data and define as anomalies those irregularities occurring simultane-ously only in the data of two or more uncorrelated parame-ters. We then restricted the analysis to the cases of just the gas content data and the ion content data. In the first case, we found 6 successes and 2 failures, and in the second case, we found only 3 successes. In the first case, the precursors ap-pear only for three of the five earthquakes we considered, and in the second case, only for two, but these are the earthquakes nearest to the wells. Interestingly, it shows that when a strict set of rules for defining an anomaly is used, the method pro-duces only successes and when less restrictive rules are used, earthquakes further from the well are implicated, but at the
Correspondence to: P. F. Biagi (biagi@fisica.uniba.it)
cost of false alarms being introduced.
1 Introduction
The Kamchatka peninsula is located in the far east of Rus-sia and is characterised by frequent and strong seismic activ-ity (with magnitudes up to 8.6). For many years, the Geo-physical Service of Kamchatka has been collecting hydro-geochemical parameters in the form of the most common ions and gases in the groundwater of some deep wells and springs in the south area of the Kamchatka peninsula, where the capital city Petropavlovsk is located. The mean sam-pling frequency was three days and some analyses of the data collected have been reported in the literature (Khatke-vich, 1994; Kopylova et al., 1994; Bella et al., 1998; Kings-ley et al., 1999). In the last ten years, five earthquakes with
M >6.5 have occurred at distances of less than 250 km from Petropavlovsk. Some key parameters of these earthquakes are listed in Table 1 and the location of the epicentres is in-dicated in the map of Fig. 1. In order to investigate whether any of these earthquakes had precursors, the hydrogeochem-ical data collected from three wells (labelled as W2, W3, and
W4in Fig. 1) have been analysed in a previous study
(Kings-ley et al., in press). The distances of the three wells from the five earthquakes mentioned above are indicated in Table 1. In Table 1, we indicated in the column labelled Wmthe distance
of the five epicentres from the point located at the centre of the well network. Here, we present a further analysis of the hydrogeochemical data.
2 Results
In the previous study (Kingsley et al., in press), continuous data sets having one value per day were derived from the raw
10 P. F. Biagi et al.: Hydrogeochemical precursors of strong earthquakes in Kamchatka
Fig. 1. Map showing the location of the five strongest earth-quakes (full circle) which occurred within a radius of 250 km from Petropavlovsk city during the period January 1988–March 1998. The three wells where the hydrogeochemicals are collected are in-dicated as W2, W3and W4.
data by linear interpolation. A high-pass filter was then ap-plied to the hydrogeochemical raw data plots in order to re-move longer components connected to slow temporal effects. The data also contain effectively noise created by short-term effects associated with variations due to a single measure-ment and these were removed by applying a low pass FFT with a smoothing window of ten days. Finally, we calculated the standard deviation σ over the entire sample for each data set. In our analysis, we considered each signal over the 3σ level to be an irregularity worthy of further investigation, and we assumed the existence of irregularities appearing simul-taneously on two parameters or more at each well to be an anomaly. With a low mean sampling frequency of three days, it is necessary to define what is meant by simultaneous and we have taken a temporal window of 7 days as the maximum time difference allowed. The motivating force behind the adoption of this data analysis strategy comes from IASPEI (International Association of Seismology and Physics of the Earth’s Interior), whose Subcommission on earthquake pre-diction published guidelines in 1991 for potential precursor candidates (Wyss, 1991; Wyss and Booth, 1997). One of the main criteria is that the definition of an anomaly should be clearly fixed and the anomaly should be simultaneously
Table 1. Key parameters of the five earthquakes considered in this
study
Date Magnitude Focal depth (km) Distance (km)
W2 W3 W4 Wm 2 Mar 1992 7.1 32 117 129 95 114 8 Jun 1993 7.3 40 247 185 247 226 13 Nov 1993 7.0 50 168 118 162 150 1 Jan 1996 6.9 10 96 152 81 110 21 Jun 1996 7.1 2 246 202 235 228
observed on more than one instrument, or at more than one site. With the technique developed so far, the next problem is to decide how long the temporal window should be for a hydrogeochemical anomaly to be considered as a precur-sor associated with a subsequent earthquake. Clearly, a very long window allows for almost any anomaly to be claimed as a precursor and very short windows preclude any precur-sors. We have chosen a window of 158 days for this maxi-mum time interval for reasons explained in detail in Kings-ley et al. (in press) and connected to the time interval be-tween earthquakes. The results of this analysis are presented in Figs. 2, 3, and 4, where the successes (precursors) are in-dicated by numbers 1 through 8 and the failures by f1, f2, f3. Out of the five earthquakes considered large enough to pro-duce precursors, we found precursors in all five cases. The largest premonitory time we found in this analysis was 92 days.
At this point, possible cross-correlations between the gas and ion data sets were considered. Any such correlation could undermine the IASPEI criterion, which requires inde-pendence between observations that are being claimed as si-multaneous thus indicating an anomaly. To investigate the possible cross-correlation effects in our data, coefficients were obtained using the Statgraphic Software packet and the results are listed in Tables 2, 3 and 4. From these tables it can be seen that values greater than 0.5 exist at W2both between
some ions and between some gases, whereas at W3and W4,
values over 0.5 only exist between some gases. There are no wells where a cross-correlation appears between gas and ion content data.
In order to take into account possible correlations in the data, we re-examined our data and defined anomalies to be those irregularities that occurred simultaneously only in the data of two or more uncorrelated parameters. In this con-text, uncorrelated parameters were taken to mean those char-acterised by cross-correlation coefficients less than 0.5 and using this rule, at W2(Fig. 2, Table 2), anomaly 4 is
elim-inated and at W3 (Fig. 3, Table 3), anomalies f1 and 6 are
eliminated. We are left with precursors remaining for only three of the five earthquakes considered; these are 13 Novem-ber 1993, 2 March 1992 and 1 January 1996. In an attemp to stay within the spirit of the IASPEI guidelines as well as the definitions, we restricted the analysis even further and defined anomalies as only those irregularities occurring
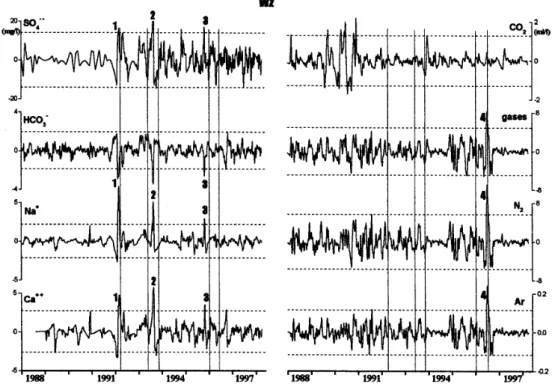
si-Fig. 2. Filtered and smoothed time-series of ion and gas content at W2from 1 January 1988 to 31 March 1998. In the plots, 1–4 represent
the successes; the horizontal dotted lines represent the 3σ level. The vertical lines represent the occurrence of the five earthquakes of Fig. 1.
Table 2. Cross-correlation coefficients at W2
Ca++ Na+ HCO−3 SO−−4 0.65 0.60 0.46 1 SO−−4 −0.61 −0.60 1 0.46 HCO−3 0.80 1 −0.60 0.60 Na+ 1 0.80 −0.61 0.65 Ca++ Ar N2 Total CO2 0.25 0.59 0.44 1 CO2 0.93 0.94 1 0.44 Total 0.97 1 0.94 0.59 N2 1 0.97 0.93 0.25 Ar Ca++ Na+ HCO−3 SO−−4 −0.07 0.08 0.1 0.01 CO2 0.07 0.11 −0.09 0.21 Total 0.13 0.15 0.13 0.22 N2 0.12 0.16 0.14 0.24 Ar
multaneously in the gas content and ion content data. In this framework, at W2(Fig. 2), no anomalies remain; at W3
(Fig. 3), only anomalies 5 and 7 are left and at W4(Fig. 4),
the anomaly 8 remains. The end result of this rigorous pro-cess is that only three anomalies remain and they are all suc-cesses. These precursors are related to only two of the five earthquakes and these are the ones that occurred on 2 March
1992 and 1 January 1996. Finally, the largest premonitory time we found in this analysis was 76 days.
3 Discussion
In the previous study (Kingsley et al., in press), 11 anoma-lies were identified using gas and ion data sets and of these, 8 could be considered precursors, and 3 seemed to be fail-ures. At that stage, we could say that examination of our data sets indicated that there was a 73% probability that any one hydrogeochemical anomaly was an earthquake precur-sor. At W2, we had 4 anomalies and 4 successes; at W3,
we had 6 anomalies but with 3 failures and 3 successes; at W4, we had just 1 anomaly which was a success. Out of the
five earthquakes considered large enough to produce precur-sors, we found precursors in all cases. This seemed like an good result but given the IASPEI recommendations and our concern over possible cross-correlations in the data, it was considered timely to revisit the data and re-analyse it. In the initial analysis using uncorrelated parameters, we identify 8 anomalies of which 6 could be considered precursors, and 2 seem to be failures. With the current analysis, we can claim that in our data sets, there is a 75% probability that any one hydrogeochemical anomaly is an earthquake precursor. At W2, we have 3 anomalies, all of which are successes; at W3,
we have 4 anomalies with 2 failures and 2 successes and at W4, we have only 1 anomaly which is a success. Out of the
five earthquakes considered large enough to produce precur-sors, the precursors appear in only three cases: these are the
12 P. F. Biagi et al.: Hydrogeochemical precursors of strong earthquakes in Kamchatka
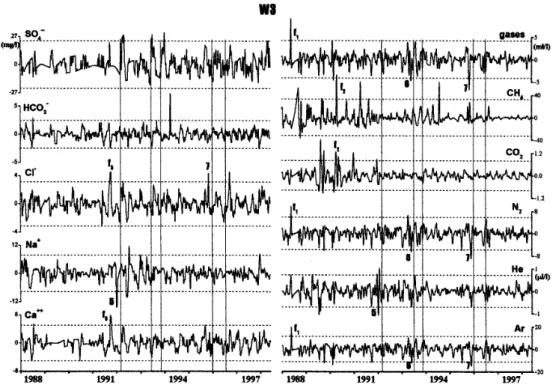
Fig. 3. Filtered and smoothed time-series of ion and gas content at W3from 1 January 1988 to 31 March 1998. In the plots, f1–f3 represent
the failures and 5–7 represent the successes; the horizontal dotted lines represent the 3σ level and the vertical lines the occurrence of the five earthquakes of Fig. 1.
Table 3. Cross-correlation coefficients at W3
Cl− Ca++ Na+ HCO−3 SO−−4 0.29 0.21 0.12 0.05 1 SO−−4 −0.12 0.15 −0.12 1 0.05 HCO−3 0.23 0.26 1 −0.12 0.12 Na+ 0.47 1 0.26 0.15 0.21 Ca++ 1 0.47 0.23 −0.12 0.29 Cl− N2 He Ar CH4 CO2 Total 0.63 0.33 0.60 −0.04 0.20 1 Total 0.11 −0.20 0.14 0.08 1 0.20 CO2 0.04 0.06 0.15 1 0.08 −0.04 CH4 0.93 0.32 1 0.15 0.14 0.60 Ar 0.34 1 0.32 0.06 −0.20 0.33 He 1 0.34 0.93 0.04 0.11 0.63 N2 Cl− Ca++ Na+ HCO−3 SO−−4 −0.15 −0.15 0.11 0.12 0.13 Total 0.13 0.12 −0.10 0.10 0.11 CO2 0.10 0.15 0.10 0.09 0.07 CH4 −0.12 −0.10 −0.15 −0.03 0.15 Ar −0.12 −0.12 −0.15 0.09 0.24 He −015 −0.08 −0.18 −0.05 0.16 N2
13 November 1993 earthquake, the 2 March 1992 and the 1 January 1996 earthquakes. Examination of Table 1 reveals that the three earthquakes identified are those nearest to the wells (mean distance ≤ 150 km).
In the more detailed analysis (gas and ion content data), we identify 3 anomalies and they are all successes. Therfore, the probability that any one hydrogeochemical anomaly is an earthquake precursor appears to be 100%. At W2, we do not
have an anomaly; at W3and W4, we have 2 successes and 1
success, respectively. These successes are related only to two of the five earthquakes we considered, i.e. the 2 March 1992 earthquake and the 1 January 1996 earthquake. Looking at Table 1, it is possible to see that these earthquakes are the nearest to the wells (mean distance < 115 km).
The largest premonitory time decreases from 92 days in the analysis of the previous study (Kingsley et al., in press) to 76 days in the present, more detailed analysis (gas and ion content data). The results presented here indicate that the use of a more restrictive criteria for defining the anoma-lies decreases the probability of failures as earthquake pre-cursors from 27% to 25% down to 0% but at same time, it reduces the “sensitive” distance from the measurement sites of the forthcoming earthquake from 228 km to 114 km (Ta-ble 1) and it reduces the largest premonitory time from 92 days to 76 days. Therefore, a strict set of rules for defining an anomaly (analogous to a high threshold in detection the-ory) produces only successes. However, when the threshold is lowered, earthquakes further from the well are implicated but also failures are introduced, as might be expected from
Fig. 4. Filtered and smoothed time-series of ion and gas content at W4from 1 January 1992 to 31 March 1998. In the plots 8, represents a success; the horizontal dotted lines represent the 3σ level. The vertical lines represent the occurrence of the five earthquakes of Fig. 1.
Table 4. Cross-correlation coefficients at W4
Cl− Ca++ Na+ HCO−3 SO−−4 0.08 0.07 0.04 0.06 1 SO−−4 0.05 0.08 0.07 1 0.06 HCO−3 0.18 0.09 1 0.07 0.04 Na+ 0.05 1 0.09 0.08 0.07 Ca++ 1 0.05 0.18 0.05 0.08 Cl− N2 Ar CH4 CO2 Total 0.34 0.12 0.52 0.23 1 Total 0.22 0.05 0.28 1 0.23 CO2 0.33 −0.10 1 0.28 0.52 CH4 0.21 1 −0.10 0.05 0.12 Ar 1 0.21 0.33 0.22 0.34 N2 Cl− Ca++ Na+ HCO−3 SO−−4 0.08 0.04 0.11 −0.05 0.04 Total 0.12 0.06 0.18 0.03 0.03 CO2 0.03 0.04 0.05 −0.07 0.03 CH4 0.06 0.06 0.05 −0.04 −0.06 Ar 0.07 0.08 0.05 −0.08 −0.05 N2
detection theory. The failures might either be random vari-ations in the parameters measured or real effects, but due to some local meteorological or geostructural process. Such lo-cal processes are very difficult to identify.
4 Conclusions
Previously, using rules for defining the anomalies that were not too restrictive, we identified possible precursors in the data, but some failures as well. We have shown that there was a small possibility that the precursors we revealed were unrelated to the subsequent earthquake. Here, we have used a stricter set of rules for defining an anomaly and have shown that it is possible to develop a data processing method that has only successes and furthermore, these successes turn out to be related to the nearest earthquakes and the premonitory time is shorter. This is an important result because if the anomalies were unrelated to the earthquakes, then the statis-tics should not change in such a convenient way. Therefore we believe that we have much stronger evidence that the pre-cursors revealed were real premonitory signals.
References
Bella, F., Biagi, P. F., Caputo, M., Cozzi, E., Della Monica, G., Ermini, A., Gordeev, E. I., Khatkevich, Y. M., Martinelli, G., Plastino, W., Scandone, R., Sgrigna, V., and Zilpimiani, D.: Hy-drogeochemical anomalies in Kamchatka (Russia), Physics and Chemistry of the Earth, 23, 921–926, 1998.
Khatkevich, Y. M.: On intermediate-term prediction of earthquakes felt in the town of Petropavlovsk-Kamchatsky, Volc. and Seis-mology, 1, 63–67, 1994.
Kingsley, S. P., Anderson C. W., Biagi P. F., Derlien P. J., Ermini A., Gordeev E. I., and Khatkevich Y. M.: Analysis of Argon concen-tration anomalies in underground water in Kamchatka (Russia), Il Nuovo Cimento C, 22, 407–413, 1999.
14 P. F. Biagi et al.: Hydrogeochemical precursors of strong earthquakes in Kamchatka
Kingsley S. P., Biagi P. F., Ermini A., Khatkevich Y. M., and Gordeev E. I.: Hydrogeochemical precursors of strong earth-quakes: a realistic possibility in Kamchatka, Physics and Chem-istry of the Earth, in press, 2001.
Kopylova, G. N., Sugroleov V. M., and Khatkevich Y. M.: Vari-ations in the regime of springs and hydrological boreholes in
the Petropavlovsk polygon (Kamchatka) related to earthquakes, Volc. and Seismology, 2, 53–70, 1994.
Wyss M.: Evaluation of proposed earthquake precursors, AGU Washington D. C., USA, 1991.
Wyss, M. and Booth D. C.: The IASPEI procedure for the evalu-ation of earthquake precursors, Geophys. J. Int., 131, 423–424, 1997.