HAL Id: hal-01271378
https://hal.archives-ouvertes.fr/hal-01271378
Submitted on 5 Apr 2016
HAL is a multi-disciplinary open access
archive for the deposit and dissemination of
sci-entific research documents, whether they are
pub-lished or not. The documents may come from
teaching and research institutions in France or
abroad, or from public or private research centers.
L’archive ouverte pluridisciplinaire HAL, est
destinée au dépôt et à la diffusion de documents
scientifiques de niveau recherche, publiés ou non,
émanant des établissements d’enseignement et de
recherche français ou étrangers, des laboratoires
publics ou privés.
between Two Classes of Ligand-Gated Ion Channels
Michel-Boris Emerit, Camille Baranowski, Jorge Diaz, Audrey Martinez, Julie
Areias, Jeanine Alterio, Justine Masson, Eric Boué-Grabot, Michelle Darmon
To cite this version:
Michel-Boris Emerit, Camille Baranowski, Jorge Diaz, Audrey Martinez, Julie Areias, et al.. A New
Mechanism of Receptor Targeting by Interaction between Two Classes of Ligand-Gated Ion Channels.
Journal of Neuroscience, Society for Neuroscience, 2016, pp.1256-1470.
�10.1523/JNEUROSCI.2390-15.2016�. �hal-01271378�
Cellular/Molecular
A New Mechanism of Receptor Targeting by Interaction
between Two Classes of Ligand-Gated Ion Channels
Michel Boris Emerit,
1,2Camille Baranowski,
1,2Jorge Diaz,
1,2Audrey Martinez,
3,4Julie Areias,
1,2Jeanine Alterio,
1,2Justine Masson,
1,2X
Eric Boue´-Grabot,
3,4and
X
Miche`le Darmon
1,21Centre de Psychiatrie et Neurosciences, INSERM UMR 894, 75013 Paris, France,2Universite´ Paris V, 75006 Paris, France,3Institut des Maladies
Neurode´ge´ne´ratives, CNRS UMR 5293, 33076 Bordeaux, France, and4Universite´ de Bordeaux, 33076 Bordeaux, France
The 5-HT
3receptors are serotonin-gated ion channels that physically couple with purinergic P2X2 receptors to trigger a functional
cross-inhibition leading to reciprocal channel occlusion. Although this functional receptor–receptor coupling seems to serve a
modula-tory role on both channels, this might not be its main physiological purpose. Using primary cultures of rat hippocampal neurons as a
quantitative model of polarized targeting, we show here a novel function for this interaction. In this model, 5-HT
3Areceptors did not
exhibit by themselves the capability of distal targeting in dendrites and axons but required the presence of P2X2R for their proper
subcellular localization. 5-HT
3AR distal targeting occurred with a delayed time course and exhibited a neuron phenotype dependency. In
the subpopulation of neurons expressing endogenous P2X2R, 5-HT
3AR distal neuritic localization correlated with P2X2R expression and
could be selectively inhibited by P2X2R RNA interference. Cotransfection of both receptors revealed a specific colocalization,
cotraffick-ing in common surface clusters, and the axonal reroutcotraffick-ing of 5-HT
3AR. The physical association between the two receptors was dependent
on the second intracellular loop of the 5-HT
3Asubunit, but not on the P2X2R C-terminal tail that triggers the functional cross-inhibition
with the 5-HT
3AR. Together, these data establish that 5-HT
3AR distal targeting in axons and dendrites primarily depends on P2X2R
expression. Because several P2XR have now been shown to functionally interact with several other members of the 4-TMD family of
receptor channels, we propose to reconsider the real functional role for this receptor family, as trafficking partner proteins dynamically
involved in other receptors targeting.
Key words: 5-HT
3receptor; ligand-gated ion channels; P2X2 receptor; receptor trafficking; receptor–receptor interactions; serotonin
Introduction
Receptor–receptor interactions have become an increasing field
of investigations, unveiling a new level of complexity in receptor
regulation. However, recent studies suggest that such
interac-tions might go beyond classical functional cross talk mechanisms
and extend to the modulation of receptor trafficking, surface
expression, and positioning within the plasma membrane (
Jo et
al., 2011
;
Shrivastava et al., 2011
;
Pougnet et al., 2014
). 5-HT
3and
Received June 22, 2015; revised Oct. 28, 2015; accepted Nov. 20, 2015.
Author contributions: M.B.E. designed research; M.B.E., C.B., J.D., and J. Alterio performed research; M.B.E., A.M., E.B.-G., and M.D. contributed unpublished reagents/analytic tools; M.B.E., J. Areias, and J.M. analyzed data; M.B.E. wrote the paper.
This work was supported by INSERM and University Paris Descartes. Confocal imaging was performed at the Plateforme Imagerie Cellulaire PICPEN (Centre de Psychiatrie et Neurosciences). C.B. received fellowships from INSERM during performance of this work. We thank Dr. Connolly (University of Dundee, Dundee, Scotland) for providing the plasmid encoding the human HA-h5-HT3Asubunit, Dr. Rassendren (CNRS UMR 5203, Universite´ de
Montpellier, Montpellier, France) for providing the plasmid encoding the P2X2b-YFP variant, and Dr. Jacques Laschet (INSERM U1129) for performing the statistical analyses.
The authors declare no competing financial interests.
Correspondence should be addressed to Dr. Michel Boris Emerit, INSERM U894, 2ter rue d’Ale´sia, 75014 Paris, France. E-mail:michel-boris.emerit@inserm.fr.
DOI:10.1523/JNEUROSCI.2390-15.2016
Copyright © 2016 the authors 0270-6474/16/361456-15$15.00/0
Significance Statement
So far, receptor targeting mechanisms were found to involve intracellular partner proteins or supramolecular complexes that
couple receptors to cytoskeletal elements and recruit them into cargo vesicles. In this paper, we describe a new trafficking
mechanism for the neuronal serotonin 5-HT
3Aionotropic channel receptor, in which the role of routing partner is endowed by a
functionally interacting purinergic receptor: the P2X2 receptor. This work not only unveils the mechanism by which 5-HT
3receptors can reach their axonal localization required for the control of neurotransmitter release, but also suggests that, in
addition to their modulatory role, the family of P2X receptors could have a previously undescribed functional role of trafficking
partner proteins dynamically involved in the targeting of other receptors.
P2X2 receptors are two functionally interacting receptors
belong-ing to two different classes of ligand-gated ion channels, of the
three major classes present in mammals: the cys-loop receptors,
the ionotropic P2X receptors, and the glutamate receptors (
Col-lingridge et al., 2009
). 5-HT
3receptors are serotonin-gated
chan-nels mediating fast excitatory transmission in the CNS and
periphery (
Sugita et al., 1992
) and neurotransmitter release (
van
Hooft and Vijverberg, 2000
). Since the cloning of the canonical
5-HT
3Ahomomeric form (
Maricq et al., 1991
), their diversity of
functions has found a molecular basis with the discovery of
ad-ditional subunits (
Davies et al., 1999
;
Niesler et al., 2003
) that
coassemble with the 3A subunit to modulate their
electrophysi-ological properties (
Davies et al., 1999
;
Jensen et al., 2008
;
Hol-brook et al., 2009
). In the CNS, 5-HT
3receptors are mainly
neuronal and are present both postynaptically on GABAergic
hippocampal and cortical interneurons (
Tecott et al., 1993
;
Lee et
al., 2010
;
Vucurovic et al., 2010
) and presynaptically on nerve
terminals projecting from various peripheral ganglia (
Miquel et
al., 2002
;
Morales and Wang, 2002
;
Doucet et al., 2007
), but their
role in peripheral functions is also widespread, particularly in the
intestinal tract (
Glatzle et al., 2002
;
Holbrook et al., 2009
).
5-HT
3Asubunits have been found to depend on the protein
RIC-3 for their surface targeting in clonal cells (
Castillo et al.,
2005
;
Cheng et al., 2005
;
Walstab et al., 2010
). However, RIC-3
appears to act as a chaperone protein mainly involved in proper
receptor folding, common to 5-HT
3Aand nicotinic receptors
(
Castillo et al., 2005
;
Alexander et al., 2010
), and no data confirm
so far a relevant role of RIC-3 in 5-HT
3trafficking within
neu-rons. Thus, the molecular mechanisms of 5-HT
3receptor
target-ing in neurons remain largely unknown.
P2X2 receptors are one subtype of the seven known P2X
re-ceptors that can all form homomeric or heteromeric ATP-gated
channels widely distributed in CNS and periphery (
Saul et al.,
2013
). In the periphery, P2X2 mediate fast synaptic transmission
in the myenteric plexus (
Ren et al., 2003
) and were originally
expected to have a similar function in the brain. However, reports
of ATP-mediated fast synaptic transmission in the brain are
scarce, suggesting that P2X2 rather play a neuromodulatory role
at central synapses (
Khakh and North, 2012
). Indeed, because
P2X2 localize mainly in the periphery of excitatory glutamatergic
synapses and seem excluded from the postsynaptic density (
Ru-bio and Soto, 2001
;
Richler et al., 2011
), and because they are
present on the terminals of ganglionic (
Vulchanova et al., 1996
)
and hippocampal (
Khakh et al., 2003
) neurons, other functional
roles for these receptors were assumed (
Khakh et al., 2003
;
Vavra
et al., 2011
;
Khakh and North, 2012
).
P2X2 receptors have been found to interact physically and
func-tionally with several other receptors and ion channels, including
nicotinic (
Barajas-Lo´pez et al., 1998
;
Khakh et al., 2000
;
Khakh et al.,
2005
), GABA
C(
Boue´-Grabot et al., 2004b
) GABA
A(
Boue´-Grabot et
al., 2004a
), and 5-HT
3receptors (
Barajas-Lo´pez et al., 2002
;
Boue´-Grabot et al., 2003
). These subunit-specific interactions result in a
cross-inhibition induced by reciprocal channel occlusion that
in-volves direct protein–protein contact (
Boue´-Grabot et al., 2003
;
Khakh et al., 2005
). However, more recent work has found that P2X
receptors could also influence GABA
Areceptor dynamics (
Jo et al.,
2011
;
Shrivastava et al., 2011
) and surface expression of AMPA
re-ceptors (
Pougnet et al., 2014
), opening new insights into P2X
recep-tor functionality. In this study, we have addressed a completely new
functional role for P2X2 receptors, as trafficking partners for the
axonal and dendritic localizations of 5-HT
3receptors in
hippocam-pal neurons.
Materials and Methods
Animals
Female gestating Sprague Dawley rats (Charles River Breeding Center)
were maintained under controlled environmental conditions (21⫾ 1°C,
60% relative humidity, 12 h/12 h light/dark cycle), with food and water available ad libitum until killed for embryo removal. Experiments were performed in agreement with the institutional guidelines for use of ani-mals and their care, in compliance with national and international laws and policies (Council directives no. 87-848, October 19, 1987, Ministe`re de l’Agriculture et de la Foreˆt, Service Ve´te´rinaire de la Sante´ et de la Protection Animale, permissions nos. 75-976 to M.B.E., 75-805 to J.M., 75-974 to M.D.).
Antibodies
The following primary antibodies were used: mouse monoclonal anti-HA antibody (Sigma; 1:1000), rabbit anti-HA antibody (Sigma, Abcam, Cell Signaling Technology, 1:1000), mouse monoclonal anti-Flag M2 antibody (Sigma, 1:2000), mouse monoclonal anti-myc (Roche, 1:500), rabbit anti-myc (Millipore, 1:500), mouse anti-GFP antibody (GE Healthcare, 1:1000), rabbit anti-GFP antibody (Millipore Bioscience Research Reagents, 1:1000), mouse monoclonal anti-␣-tubulin antibody (Abcam, 1:2000), rabbit anti-tubulin antibody (Novus Biologicals, 1:1000), rabbit anti-MAP2 antibody (Millipore Bioscience Research Re-agents, 1:1000), rabbit anti-P2X2R antibody (Alomone Labs, 1:300), guinea pig anti-P2X2R antibody (Millipore, 1:300), mouse monoclonal
anti-dsRed antibody (Clontech, 1:1000), rabbit anti-5-HT3Aantibody
(1:1000) (Doucet et al., 2000), and goat anti-5-HT3Bantibody (1:1000) (Doucet et al., 2007). The secondary antibodies used were AlexaFluor-488 and -594-conjugated antibodies from Invitrogen (1:1000) and HRP-conjugated anti-rabbit and anti-mouse antibodies (Sigma, 1:10,000).
Plasmid constructs and site-directed mutagenesis
5-HT3A-HA was generated from a pRC-CMV plasmid described
previ-ously (Emerit et al., 2002) by extraction of the mouse 5-HT3Asequence with HindIII and BamHI and insertion into the pcDNA3 vector (Invit-rogen) between the HindII and EcoRI sites in two steps, with a cassette containing the HA epitope (YPYDVPDYA) separated by a Gly3 arm in C-terminal position before the stop codon. The human HA-tagged
5-HT3Asubunit (HA tag inserted between amino acids 5 and 6),
sub-cloned into the pGW1 plasmid (Boyd et al., 2003), was a generous gift of Dr. C. N. Connolly (Ninewells Medical School, University of Dundee, Dundee, Scotland). The mouse 5-HT3A-Flag plasmid was previously de-scribed (Emerit et al., 2002). The plasmids encoding rat 5-HT1A-eGFP (Carrel et al., 2008), sst2A-eGFP (Lelouvier et al., 2008), P2X2-YFP (Boue´-Grabot et al., 2003), P2X2b-YFP (Koshimizu et al., 2006), YFP-5-HT3A(Grailhe et al., 2004), and P2X4-FlagIN (Jo et al., 2011) have al-ready been used and described. P2X2, P2X2Tr, P2X3-Flag, P2X3-YFP,
myc-1 subcloned into pcDNA3, myc-tagged GluA1, or GluA2
sub-cloned into PrK5 vector were described previously (Boue´-Grabot et al.,
2000;2004a;Pougnet et al., 2014). Myc-NR2A was a gift from L. Groc
(Interdisciplinary Institute for Neuroscience, Bordeaux, France). HA-tagged P2X2 and P2X2Tr were generated by insertion of a sequence encoding the YPYDVPDYA epitope between amino acids D78 and K79 within the extracellular domain of P2X2 subunits using the QuikChange site-directed mutagenesis method (Agilent) with specific oligonucleo-tides. P2X2Tr corresponded to a deletion of the 98 last amino acids of the C-terminal domain of P2X2 (Boue´-Grabot et al., 2000). HA-tagged P2X2⌬C36 or P2X2⌬C57 was generated by insertion of a stop codon into the sequence of HA-P2X2 using the QuikChange mutagenesis method at specific position to delete the 36 or 57 last amino acids of HA-P2X2, respectively. 5-HT3A-IL23-HA and 5-HT3A-IL2␥2-HA chimeras were generated by substitution of the second intracellular loop (IL2) of the
5-HT3Asubunit with the homologous domain of GABAA3 or ␥2
sub-unit, respectively, using the QuikChange method and megaprimer strat-egy. The sequences corresponding to the IL2 of3 or ␥2 subunits were
first amplified by PCR from3 or ␥2 constructs using pfu polymerase
(Fermentas) and primers with flanking regions corresponding to
adja-cent 5-HT3Asequences. Each PCR product was then used as
5-HT3A-IL23-HA and 5-HT3A-IL2␥2-HA. All constructs were verified by sequencing.
Xenopus oocyte electrophysiology
Oocytes were removed from Xenopus laevis as previously described (Jo et al., 2011). The amount of cDNA for wild-type or mutated subunits was adjusted to reach similar levels of expression and avoid overexpression. After nuclear injection of cDNAs coding for wild-type or deleted HA-P2X2 (30 pg) as well as wild-type or chimeric HA-5-HT3subunits (100 – 300 pg), oocytes were incubated in Barth’s solution containing 1.8 mM
CaCl2and gentamycin (10 mg/ml, Sigma) at 19°C for 1–3 d before elec-trophysiological recordings were performed as previously described (Pougnet et al., 2014). Two-electrode voltage-clamp recordings were performed at room temperature using glass pipettes (1–2M⍀) filled with
3MKCl solution to ensure a reliable holding potential. Oocytes were
voltage-clamped at⫺60 mV, and the membrane currents were recorded
with an OC-725B amplifier (Warner Instruments) and digitized at 1 kHz on a Power PC Macintosh G4 using Axograph X software (Axograph). Oocytes were perfused at a flow rate of 10 –12 ml/min with Ringer’s solution, pH 7.4, containing the following (in mM): 115 NaCl, 3 NaOH, 2
KCl, 1.8 CaCl2, and 10 HEPES. Agonists were prepared at their final
concentrations in the perfusion solution and applied using a computer-driven valve system (Ala Scientific).
Neuronal cultures
Neuronal cultures were made as described previously (Carrel et al., 2008) with some modifications. Hippocampi of rat embryos were dissected at day 18. After trypsinization, tissue dissociation was achieved with a Pas-teur pipette. Cells were counted and plated on poly-D-lysine-coated 15-mm-diameter coverslips (Electron Microscopy Sciences), at a density of 200 –300 cells per square millimeter, in complete Neurobasal medium
supplemented with B27 (Invitrogen), containing 0.5 mMGlutaMAXI, 10
U/ml penicillin G, and 10 mg/ml streptomycin. Three hours after plating, the medium was replaced by a conditioned medium obtained by incu-bating glial cultures (70%– 80% confluency) for 24 h in the complete medium described above.
Glial cultures were prepared as follows: cortex of 4-d-old rat pups was dissected and fragmented into smaller pieces through a pipette. After trypsinization, tissue dissociation was achieved with a pasteur pipette. After several washes, the cells were plated into 150 cm2tissue culture flasks in DMEM GlutaMAXI (Invitrogen) supplemented with 1 g/L glu-cose, 10% FBS, 10 U/ml penicillin G, and 10 g/ml streptomycin. This primary culture was expanded every 7–10 d, and cultures between the first and the fourth passage were used to prepare the conditioned me-dium described above.
Transfection of neuronal cultures
Hippocampal neurons were transfected at 4 –5 to 15 DIV as follows: for
each coverslip, plasmid DNA (2.5g) was mixed with 50 l of
Neuro-basal medium without B27 supplement. After 15 min at room tempera-ture, 1.25l of Lipofectamine 2000 (Invitrogen) in 50 l of Neurobasal medium was added, and incubation continued for another 30 min. After
the addition of 150l of complete Neurobasal medium containing B27
supplement, the mix was applied onto the neuronal culture, and trans-fection lasted for 3 h at 37°C. After transtrans-fection, the medium in which the neurons were grown was put back on to the neurons for the expression period (usually 48 h). Typically, 5%–10% of neurons expressed the re-ceptors after transfection.
Inhibition of receptor expression
For silencing endogenous P2X2R expression, we tested three different siRNAs (Sigma, Invitrogen, and Thermo Scientific) directed against the rat subunit: siRNA(P2X2)-1 (ACCUGCCAUUCAGACGACGACU GUA), siRNA(P2X2)-2 (CAUCUUCAGGCUGGGUUUCAUUGUU), siRNA(P2X2)-3 (CACCAUCAUCAAUCUGGCCACUGCU), and con-trol siRNA (CCAGUACUUCGUACUCCAAUCGACA) (Carrel et al., 2008). An optimal protocol for the simultaneous inhibition of
endoge-nous P2X2R expression and 5-HT3AR expression at 7 DIV was set as
follows: for each coverslip, plasmid DNA (2.5g) was mixed with 25 l of Neurobasal medium without B27 supplement. After 15 min at room
temperature, 0.5l of Lipofectamine 2000 (Invitrogen) in 25 l of Neu-robasal medium was added, and incubation continued for another 30 min. Simultaneously and separately, 2l of siRNA (160 nMfinal
concen-tration) was mixed with 25l of Neurobasal medium without B27
sup-plement. After 15 min at room temperature, 0.5 l of RNAiMAX
(Invitrogen) in 25l of Neurobasal medium was added, and incubation
continued for another 30 min. Plasmid and RNA complexes were mixed,
and 150l of complete Neurobasal medium containing B27 supplement
was added. The mix was then applied onto the neuronal culture, and transfection lasted for 3 h at 37°C. After transfection, the medium in which the neurons were grown was put back on to the neurons for the expression period (usually 48 –72 h). Optimal results were obtained with siRNA(P2X2)-3.
Immunofluorescence
Cells on coverslips were washed with DPBS⫹(DPBS containing 0.1 mM
CaCl2and 0.1 mMMgCl2) at 37°C, then fixed with 3% PFA containing
4% sucrose (PFA/sucrose) at 37°C in DPBS⫹, and permeabilized with
0.1% Triton X-100 in DPBS (without CaCl2, MgCl2). After two washes (10 min) in DPBS, cells were incubated for 30 min in antibody buffer (3% BSA, 2% normal donkey serum, 2% normal goat serum, except when using goat primary antibodies, in DPBS). Incubation with primary anti-bodies was then performed in antibody buffer at room temperature (1 h). After two washes in DPBS, incubation with secondary antibodies pro-ceeded for 1 h. The coverslips were finally mounted in Fluoromount-G solution (Clinisciences) for immunofluorescence visualization using confocal microscopy.
Microscopy
Immunofluorescence images were generated using a Leica TCS SP5
AOBS laser scanning confocal microscope (25, 40, 63, or 100⫻
oil-immersion lenses). Contrast and brightness were chosen to ensure that all pixels were within the linear range. Images were the product of 12-fold line averages. In all cases, emission and excitation filters proper to each fluorophore were used sequentially, and the absence of cross talk between different channels was checked with selectively labeled preparations. Leica pictures (.lei) were saved as Tiff images, and plates were assembled using Adobe Photoshop CS2 (Adobe Systems). Background was lowered using Gaussian blur (radius 1 pixel), and contrast and brightness of im-ages displayed in figures were modified using Adobe Photoshop CS2 only for illustrations.
Quantification of dendrite fluorescence
Fluorescence profiles along dendrites and axons were generated using the Lucia 4.71 software (Nikon). For fluorescence profile comparisons, all neurons showing intact morphology with unambiguous visual identifi-cation of the axon were analyzed (one dendrite or axon per neuron). The variability of distribution in individual neurons was eliminated by using the cumulated fluorescence profiles obtained for 20 – 40 neurons in each group (Carrel et al., 2008). Usually, quantitative data were generated by extracting the area under each individual curve between the soma and 50 –100m for the totality of neurons analyzed and then normalized to the mean value of the control condition. Data analysis was performed
with Prism software (GraphPad). All results are reported as mean⫾
SEM. Statistical significance was assessed by using Student’s t test or one-way or two-way ANOVA with Bonferroni’s or Dunnett’s post hoc tests. The level of significance was set at p⬍ 0.05.
Colocalization analysis
Receptor–receptor colocalization was measured by using the JACoP pl-ugin of FIJI (ImageJ) software (Bolte and Cordelie`res, 2006). The manual threshold method was adapted to the quantification of fluorescence overlap onto the clustered components of receptor distributions within the dendritic trees. ROI were chosen to avoid the cell bodies and the intense intracellular fluorescence found in the center of the larger den-drites. The threshold was chosen in each case to select the clustered component of receptor distribution and to avoid inclusion of the diffuse component that could lead to random overlap noise. Mander’s M1 co-efficients (representing the proportions of clustered 5-HT3Areceptors
colocalized with clustered cotransfected receptors) were then used as the relevant parameters on which the statistical analyses were performed.
Immunohistochemistry
Tissue preparation. Rat pups ( postnatal life 1 week) and adult mice
were killed by decapitation. The brain of mice was rapidly removed and immediately frozen by immersion in isopentane cooled by dry ice
(⫺40°C). The whole body of rat pups was also frozen by immersion in
isopentane cooled by dry ice (⫺40°C). The frozen rat pups and brains
of mice were conserved at⫺75°C until cryostat sectioning. Sagittal
sections of whole body of pups and coronal sections of brains (12m
thick) were prepared on a cryostat (JUNG3000, Leica), thaw-mounted onto slides SuperFrost-Plus (Menzel-Glaser), and kept at ⫺75°C until use for immunohistochemistry.
Immunohistochemistry: double immunofluorescent staining for 5-HT3 and P2X2 receptors. Frozen sections were thawed to 4°C and fixed during
10 min with 2% PFA made up in 0.1MPB, pH 7.4 at 4°C or fixed with
methanol at⫺20°C for 15 min. After washing three times for 5 min each
with 50 mMPBS, the sections were immersed in 50 mMTris-buffered
saline, pH 7.5 (TBS) and then blocked with the blocking buffer (10% normal donkey serum, 0.1% BSA, 0.1% gelatin, 0.1% Tween 20, and 0.1% Triton X-100 in TBS) for 1 h at 37°C. Sections were then incubated with the primary antibodies: rabbit anti-5-HT3A(1:500 dilution) and guinea-pig anti-P2X2 (Millipore, 1:500 dilution) or goat anti-5-HT3B and rabbit anti-P2X2 (Alomone, 1:500 dilution) in dilution buffer (50
mMTBS, pH 7.6; 0.1% BSA; 0.1% gelatin, 0.1% Tween 20, and 0.05%
Triton X-100) overnight at 4°C. After washing three times with TBS (0.1% gelatin; 0.1% Tween 20), sections were incubated with the follow-ing secondary antibodies (Alexa488-donkey anti-rabbit and Cy3-donkey guinea-pig or Alexa488-donkey goat and Cy3-donkey anti-rabbit (Jackson ImmunoResearch Laboratories, 1:500 dilution for each) in dilution buffer TBS (0.1% Tween 20) for 1 h at room temperature. After three rinses with TBS-Tween 20, sections were coverslipped with Fluoromount-G mounting media (Southern Biotechnology).
Statistical analyses
Distributions of data were analyzed for normality (simple or bimodal). Data are presented as mean⫾ SEM. Statistical significance was assessed
using linear regression, t test, one-way or two-way ANOVA followed by Dunnett or Bonferroni’s tests. Critical level of significance was set at pⱕ 0.05. Analyses were performed using JMP V.10 (SAS Institute) and GraphPad software.
Results
Native 5-HT
3and P2X2 receptors are coexpressed within the
same neurons
If 5-HT
3and P2X2 receptors undergo a common fate within a
supramolecular partnership, then they should share an
overlap-ping distribution and be expressed within the same neurons.
5-HT
3R tissue distributions are well documented by in situ
hy-bridization (
Tecott et al., 1993
;
Morales and Wang, 2002
),
radio-ligand binding (
Laporte et al., 1992
), and antibody labeling
(
Doucet et al., 2000
;
Miquel et al., 2002
). In the CNS, 5-HT
3R are
present in scattered neurons in the cortex (
Tecott et al., 1993
;
Lee
et al., 2010
), in hippocampus CA1 and CA3 layers, amygdala,
nucleus of the solitary tract, Sp5, and dorsal horns of the spinal
cord (
Laporte et al., 1992
;
Doucet et al., 2000
). In the periphery,
5-HT
3R are mainly represented in several peripheral ganglia
(
Morales and Wang, 2002
;
Doucet et al., 2007
) and in the
intes-tinal tract, in neurons of the myenteric and submucosal plexus
(
Glatzle et al., 2002
). P2X2R share a tissue distribution that is
remarkably overlapping with 5-HT
3R albeit wider, including
many non-neuronal cell types (for an extensive review, see
North,
2002
). However, colocalization within the same neurons has only
been described by electrophysiological recordings (
Barajas-Lo´pez et al., 2002
;
Boue´-Grabot et al., 2003
) and remained to be
demonstrated by immunocytological methods. We have used
previously described antibodies against the 5-HT
3A(
Doucet et
al., 2000
) and the 5-HT
3B(
Doucet et al., 2007
) subunits to
illus-trate such a coexpression of native 5-HT
3and P2X2 receptors in
neurons of the rat myenteric plexus using two independent
cou-ples of antibodies: rabbit anti-5-HT
3Aand guinea pig anti-P2X2
Figure 1. 5-HT3and P2X2 receptors are coexpressed in neurons of the myenteric plexus. Immunohistochemical detection of 5-HT3A, 5-HT3B, and P2X2 subunits in the rat intestinal tract at 4 d postnatal. A, 5-HT3A(rabbit anti-5-HT3Aantibody; green) and P2X2 (guinea pig anti-P2X2 antibody; red). B, 5-HT3B(goat anti 5-HT3Bantibody; green) and P2X2 (rabbit anti-P2X2 antibody; red). Both 5-HT3subunits colocalize with P2X2R in the same neurons (arrows). mp, Myenteric plexus; lm, longitudinal muscle; cm, circular muscle. Scale bar, 50m.
(Millipore) (
Fig. 1
A) and goat anti-5-HT
3Band rabbit anti-P2X2
(Alomone Labs) (
Fig. 1
B). In both cases, labeling was found
within the same cell bodies (
Fig. 1
, arrows) of neurons of the
myenteric and submucosal plexus and occasionally on fibers
crossing the longitudinal and circular muscles.
Delayed onset of 5-HT
3Areceptor trafficking in a
subpopulation of cultured hippocampal neurons
We used primary cultures of hippocampal neurons to challenge a
functional partnership between 5-HT
3Ahomomeric and P2X2
receptors in regards to polarized trafficking. This model has
proven to be fully adapted to the quantification of dendritic or
axonal targeting of various receptors (
Carrel et al., 2008
,
2011
;
Al
Awabdh et al., 2012
). Because 5-HT
3R, although present in these
cultures, are expressed at levels too low to be detected by specific
antibodies, we used transfected tagged 5-HT
3Asubunits. We first
tested various tags and their position within the 5-HT
3sequence
and compared them with 5-HT
3AWt (labeled with anti-5-HT
3Aantibodies) to make sure that the tag itself did not interfere with
trafficking mechanisms. 5-HT
3A-GFP (GFP tag in C-terminal
position) and YFP-5-HT
3A(YFP in the N-extracellullar domain
after a signal peptide from the glycine receptor) (
Grailhe et al.,
2004
) did not exhibit a subcellular distribution identical to
5-HT
3AWt, the first one being retained within the endoplasmic
reticulum, and the second one fully filling the dendritic tree in all
transfected neurons. Instead, all tagged 5-HT
3AR carrying a small
tag on the extracellular C-tail exhibited a distribution that was
indistinguishable from 5-HT
3AWt (
Fig. 2
A). We then compared
the expression of 5-HT
3A-HA homomeric receptors with the
ones of a dendritic receptor, the 5-HT
1A-eGFP (
Carrel et al.,
2008
), and two dendritic/axonal receptors: sst2A-eGFP (
Lelou-vier et al., 2008
) and P2X2-YFP (
Bobanovic et al., 2002
). In
iden-tical conditions (same culture, transfection parameters, and
expression time), 5-HT
3A-HA subunits appeared to be restricted
to the proximal part of dendrites (
Fig. 2
A), whereas 5-HT
1A-eGFP receptors filled the entire dendritic tree and sst2A--eGFP or
P2X2-YFP receptors filled both the entire dendritic and axonal
networks, with a homogeneous distribution in almost 100%
of neurons.
Figure 2
B shows cumulated fluorescence curves
along the longest neurite for a sample of neurons expressing
5-HT
3A-HA subunits in proximal dendrites only, and compares
them with 5-HT
1A-eGFP, sst2A-eGFP, and P2X2-YFP. Whereas
cumulated fluorescence reached 800
m for 5-HT
1A-eGFP
(den-drites only), and 900 –1100
m for sst2A-eGFP and P2X2-YFP
(dendrites and axons), 5-HT
3A-HA fluorescence did not exceed
100 –200
m from cell bodies. When we compared transfections
performed from 5 DIV (
Fig. 3
A) to 12 DIV (
Fig. 3
B) (48 h
expres-sion), we observed an increasing proportion of neurons showing
a distal targeting of 5-HT
3A-HA receptors. 5-HT
3AR-HA showed
a delayed distal localization (fluorescence detected at distances
⬎100–200
m from cell bodies) only in a subpopulation of
transfected neurons representing 11.4
⫾ 1.2% at 5 DIV, and
slowly increasing to 30%– 40% after 7 DIV (
Fig. 3
E, blue area).
The population of neurons that were not targeting 5-HT
3AR-HA
distally could not be attributable to a degenerating process due to
transfection, as shown by the integrity of their dendritic tubulin
network (
Fig. 3
A). When transfected at 12 DIV, the discrepancy
between neurons expressing 5-HT
3AR-HA proximally and
neu-rons expressing the receptor distally increased, and surface
label-ing of the HA epitope revealed that only this latter population
expressed the receptor at the surface (
Fig. 3
B). These results are
consistent with the existence of two populations of neurons in
regards to 5-HT
3AR expression: one devoid of a targeting
ma-Figure 2. The majority of hippocampal neurons in culture do not address 5-HT3Areceptors distally. Hippocampal neurons were transfected at 7 DIV with 5-HT3A-HA, untagged 5-HT3A, 5-HT1A-eGFP, sst2A-eGFP, or P2X2-YFP subunits. A, Immunofluorescence was performed with anti-HA, anti-5-HT3A, or anti-GFP antibodies (to enhance GFP and YFP signals). B, Cumulated fluorescence intensities along the longest neurite were plotted for a representative sample of 10 neurons from each transfected culture. Whereas 70% of 5-HT3AR expressing neurons did not address the receptor distally in neurites, nearly 100% of transfected neurons addressed 5-HT1AR in the entire dendritic tree and nearly 100% of neurons addressed sst2AR and P2X2R in the entire dendritic and axonal arborizations. Scale bar, 50m.
chinery for these receptors and another one expressing a distally
targeting machinery with a slow onset.
5-HT
3Areceptor targeting in distal dendrites and axons is
neuron phenotype dependent
Primary cultures of hippocampal neurons contain two major
neuronal populations: large pyramidal neurons that are mainly
glutamatergic (
Graves et al., 2012
), and interneurons, some of
them GABAergic (
Benson et al., 1994
). However, we could not
find any correlation between the capability of neurons to distally
address 5-HT
3AR and the size of the cell bodies, the shape of the
neurons, or GAD65 immunolabeling (data not shown). Instead,
we found a positive correlation between the distal localization of
5-HT
3A-HA and the presence of endogenous P2X2R in these
neurons. We labeled 5-HT
3AR-HA-transfected hippocampal
neurons at an intermediate differentiation time (7 DIV) with
anti-P2X2 antibodies (
Fig. 3
C). The cumulated frequency
dia-gram of anti-P2X2 intensity (
Fig. 3
E, inset) revealed that
hip-pocampal neurons were distributed in two populations (bimodal
anti-P2X2 fluorescence distribution plotted against cumulated
frequency). By plotting the average P2X2R fluorescence
mea-sured on cell bodies versus the detection limit of 5-HT
3AR-HA
immunolabeling (above background) along the longest
immu-nopositive neurite (
Fig. 3
E), a correlation was observed (linear
Figure 3. 5-HT3Areceptor distal targeting is dependent on endogenous P2X2 receptors. Hippocampal neurons were transfected at (A) 5 DIV, (B) 12 DIV, or (C) 7 DIV, with 5-HT3AR-HA. Immunofluorescence detection was performed with the following: A, anti-HA (red) and anti-tubulin (green) antibodies; B, anti-HA antibodies without permeabilization (green), and then anti-HA antibodies after permeabilization (red); or C, anti-HA (red) and anti-P2X2 (green) antibodies. Scale bars, 50m.D,EndogenousP2X2R(arbitraryunits)werequantifiedbyWesternblot(blackline) in hippocampal cultures at the indicated times (DIV). Surviving neurons were counted for each condition (red line), and the amount of endogenous P2X2R was divided by the number of live neurons in the culture at each time (blue line, endogenous P2X2/surviving neurons). E, The intensity of mean endogenous anti-P2X2R immunofluorescence (arbitrary units) measured on neuron somas was plotted versus the distance of the 5-HT3A-HA detection limit (above background) along the longest immunolabeled neurite at 7 DIV (C). The cumulated frequency distribution of P2X2R mean fluorescence intensity on somas (inset) revealed the existence of two populations of neurons (n⫽ 51, bimodal distribution, median ⫽ 50): P2X2 immunonegative (68.3%,1⫽ 47, quartiles ⫽ 40) and P2X2 immunopositive (31.6%,2⫽ 121, quartiles ⫽ 110). Only P2X2R-immunopositive neurons (example in C) expressed 5-HT3AR distally (linear regression, rregression, n
⫽ 51, r
2⫽ 0.71, p ⬍ 0.0001), showing that the distal
targeting of 5-HT
3AR was linked with the expression of native
P2X2R in the neurons. Moreover, the bimodal distribution
corresponded to two neuronal populations: a low intensity
(background, P2X2R negative) and a threefold higher intensity
(P2X2R positive), representing 68.6% and 31.4%, respectively, of
the total. These two populations could be defined by setting a
fluorescence cutoff at the minimum value of the fitted curve
(
Fig. 3
E, inset). Measurements of the lengths of detectable
5-HT
3AR-HA fluorescence yielded corresponding values of 58
⫾
9
m and 312 ⫾ 29 m (mean ⫾ SEM, n ⫽ 51, t test, significant
difference, p
⬍ 0.0001), respectively, for the two populations
(
Fig. 3
E, colored areas). The same results were obtained with
human HA-tagged h5-HT
3Asubunits in which the HA tag was
introduced in the N-terminal domain between amino acids 5 and
6 (
Boyd et al., 2003
) (data not shown), suggesting that this
cor-relation was not rodent specific or induced by the tag position.
Quantification of SDS-PAGE analysis followed by
immunoblot-ting (
Fig. 3
D) confirmed the increasing presence of endogenous
P2X2R in cultured hippocampal neurons from 3 to 10 –11 DIV,
followed by a plateau from 12 to 21 DIV, an observation
consis-tent with previous reports of P2X2R expression in the
hippocam-pus (
North, 2002
;
Khakh et al., 2003
). As a result, the slow onset
of native P2X2R expression in the culture explains the delayed
capacity of the P2X2-immunopositive subset of neurons to
dis-tally address 5-HT
3AR.
5-HT
3Areceptor targeting to distal dendrites and axons is
dependent on endogenous P2X2 receptors
The dependency of transfected 5-HT
3AR on native P2X2R
ex-pression for their distal neuritic localization was confirmed by
RNA interference. We found that simultaneous transfection of
5-HT
3AR-HA and siRNA(P2X2) at 7 DIV (i.e., inhibition of de
novo expressed P2X2R) was optimal to significantly affect
5-HT
3AR localization. Hippocampal neurons were transfected
with 5-HT
3AR-HA, with or without siRNA(P2X2) or control
siRNA at 7 DIV, and the neurons were simultaneously quantified
for the following: (1) their anti-P2X2 fluorescence intensity on
Figure 4. P2X2 receptor depletion inhibits 5-HT3Areceptor targeting toward distal neurites. Hippocampal neurons were transfected at 7 DIV with the 5-HT3AR-HA alone or cotransfected with the 5-HT3AR-HA plus siRNA against endogenous P2X2R or control siRNA for 48 h. A, Immunofluorescence detection of 5-HT3AR-HA in representative neurons belonging to the P2X2-immunopositive subpopulation. Scale bar, 50m. B, 5-HT3AR-HA immunofluorescence detection limits along the longest neurite (one neurite per neuron) were measured for each transfected neuron, and the neurons belonging to the P2X2-immunonegative and P2X2-immunopositive groups were represented separately. After RNA interference of endogenous P2X2R, the 5-HT3AR-HA immunofluo-rescence detection limit was significantly lower in neurites of P2X2-immunopositive neurons only. Bars indicate mean⫾SEM;n⫽40–50.****p⬍0.0001(two-wayANOVAwithBonferroni’spost
hoc test). C, Cumulated fluorescence intensity profiles of 5-HT3AR-HA (arbitrary units) along the longest neurite of P2X2-immunopositive monitored neurons (m) in control conditions (blue) compared with siRNA(P2X2) (red) and siRNA(Cont) (green). D, Areas under individual curves (cumulated in C), for distances of 0 –500m, were averaged. The 5-HT3AR-HA immunofluorescence intensity is significantly lower in neurites after RNA interference of endogenous P2X2R. Bars represent the mean⫾ SEM (n ⫽ 20–30). ***p ⬍ 0.001 (one-way ANOVA with Dunnett’s Multiple Comparison post hoc test).
the soma, (2) their anti-HA (5-HT
3AR) fluorescence intensity
along their longest neurite, and (3) the anti-HA (5-HT
3AR)
flu-orescence detection limit for their longest labeled neurite (
Fig. 4
).
Figure 4
A shows characteristic neurons for the three conditions,
in the population of P2X2R-immunopositive neurons.
Quantifi-cation of 5-HT
3AR-HA detection limit (above background)
revealed that siRNA(P2X2) reduced significantly the average
distance of anti-HA detection by 47% (53.4
⫾ 5.2% of control,
two-way ANOVA, n
⫽ 46, p ⬍ 0.0001) in
P2X2R-immunoposi-tive neurons (
Fig. 4
B), whereas control siRNA had no effect
(106.6
⫾ 10.9% of control, two-way ANOVA, n ⫽ 49, p ⬍
0.0001). There was no significant effect of siRNAs on
P2X2R-immunonegative neurons (
Fig. 4
B). When cumulated
fluores-cence intensity profiles along the longest neurite (one neurite
per neuron) for the P2X2R-immunopositive subset of
5-HT
3AR-HA transfected neurons were plotted, the depletion
of 5-HT
3A-HA receptor expression in the neurites was clear
cut for siRNA(P2X2)-treated neurons but was
indistinguish-able from the control for siRNA(Control) (
Fig. 4
C).
Quantifica-tion of the areas under the curves for each P2X2R-positive
neuron (0 –500
m from soma) yielded an average inhibition of
53% (46.6
⫾ 7.2% of control, two-way ANOVA, n ⫽ 46, p ⬍
0.0001) for siRNA(P2X2) and no effect of control siRNA
(104.5
⫾ 8.5% of control, two-way ANOVA, n ⫽ 49, p ⬍ 0.0001).
Because this protocol of siRNA
interfer-ence only inhibited de novo expression of
endogenous P2X2R (i.e., simultaneously
expressed with transfected 5-HT
3A-HA)
and did not affect the receptors already
present at 7 DIV, no clear decrease of
P2X2 signal could be detected in
immu-nofluorescence at the level of cell somas or
on immunoblots (data not shown).
Nev-ertheless, these results demonstrate the
dependency of 5-HT
3AR on P2X2R for
their localization in distal neurites and
suggest that both receptors probably
un-dergo a common trafficking fate at an
early stage.
5-HT
3Aand P2X2 colocalize in common
surface clusters
We then cotransfected hippocampal
neu-rons with both tagged 5-HT
3Aand tagged
P2X2 subunits to visualize how the
pres-ence of additional P2X2R would influpres-ence
the neuronal distribution and topology of
5-HT
3AR.
Figure 5
A shows a typical
neu-ron transfected with 5-HT
3AR-HA alone
and one cotransfected with 5-HT
3A-HA
plus P2X2-YFP subunits. The main effect
of the presence of both transfected
receptors in the same neurons was a
re-distribution of 5-HT
3AR subcellular
lo-calization in the neuritic processes.
5-HT
3AR were “boosted” to fulfill the
entire dendritic tree and also the axonal
arborization up to the very end.
Magni-fication of an axonal section revealed
that 5-HT
3AR-HA and P2X2R-YFP were
both expressed under a diffuse and a
clustered component. Colocalization of
the two receptors within these surface
clusters was largely observed in the majority of cotransfected
neurons as shown by the correspondence between
fluores-cence profiles (
Fig. 5
B, C), indicating physical proximity
be-tween the two proteins during the trafficking process.
The P2X2 receptor is a specific routing partner of the 5-HT
3Areceptor for axonal targeting
The rigorous quantification of 5-HT
3AR subcellular
redistribu-tion by P2X2R cotransfecredistribu-tion within hippocampal neurons
re-quired to first solve two technically interfering drawbacks: (1) the
reduction of the endogenous P2X2R component contribution to
5-HT
3AR redistribution; and (2) the isolation of the axonal and
dendritic components of fluorescence profile measurements.
Both problems were solved by transfecting early plated neurons
(4 –5 DIV) because, at that time, (1) native P2X2R are still
ex-pressed at low levels (
Fig. 3
D) and contribute to distal targeting of
5-HT
3AR for
⬍10% of neurons (
Fig. 6
D); and (2) the dendritic
trees of neurons are still poorly developed, whereas axons are in
rapid growing phase and are unambiguously characterized from
dendrites on the basis of their shapes and sizes (
Fig. 6
A) without
the use of axonal or dendritic specific markers that are not
selec-tive of their respecselec-tive compartments in neurons that are not
completely differentiated (4 –10 DIV). Thus, 5-HT
3AR-HA and
P2X2R-YFP cotransfection was performed on 4 –5 DIV neurons,
Figure 5. 5-HT3Aand P2X2 receptors colocalize in common surface clusters. A, 5-HT3AR-HA was transfected alone or cotrans-fected with P2X2R-YFP in hippocampal neurons at 7 DIV. Immunofluorescence detection of both receptors (red represents 5-HT3AR-HA; green represents P2X2-YFP) was performed after 48 h. The presence of transfected P2X2R in the same neurons enhanced the distal trafficking of 5-HT3AR in all neurites, particularly in axons (arrows). Scale bar, 50m. B, Magnification of an axonal section reveals that 5-HT3AR and P2X2R colocalize in common surface clusters (arrowheads). C, Fluorescence profiles of both labels along a polyline drawn through the surface clusters (boxed section). Scale bar, 5m.
and quantitative fluorescence analysis was performed on the total
number of transfected neurons for each condition (
Fig. 6
).
Typical neurons expressing either 5-HT
3AR-HA and eGFP or
5-HT
3AR-HA and P2X2R-YFP are shown on
Figure 6
A.
Cotrans-fection of P2X2R-YFP changed completely the targeting of
5-HT
3AR-HA from (proximal) dendritic only to (distal)
den-dritic and axonal, whereas eGFP did not induce 5-HT
3AR-HA
expression in the axon, thereby demonstrating that the 5-HT
3AR
retargeting was not the consequence of a nonspecific artifact
linked to protein overexpression. The totality of 5-HT
3AR-HA-immunopositive neurons was then classified into two categories
on the basis of their expression of 5-HT
3AR-HA fluorescence at
distances under (proximal) or above (distal) 100
m from somas
(
Fig. 6
A), and neuron counts for each condition were represented
in percentage of total neurons counted (
Fig. 6
D). When neurons
were cotransfected with 5-HT
3AR-HA and eGFP, the proximal
and distal groups represented 88.6
⫾ 1.8% and 11.4 ⫾ 1.2%,
respectively, of the total neurons counted (mean
⫾ SEM, n ⫽
324) and did not differ significantly from neurons transfected
with 5-HT
3AR-HA alone (data not shown). When neurons were
cotransfected with 5-HT
3AR-HA and P2X2R-YFP, the proximal
and distal groups were changed to 20.6
⫾ 1.4% and 79.4 ⫾ 1.4%,
respectively (n
⫽ 399). Comparing the relative number of
neu-rons with proximal and distal labeling in the two cotransfection
experiments revealed a significant difference (two-way ANOVA,
p
⬍ 0.0001). Fluorescence profiles along the entire axonal
ar-borization (longest path) were measured on a representative
sub-set of neurons (n
⫽ 30), and cumulated fluorescence profiles for
5-HT
3AR-HA (
Fig. 6
B) and eGFP or P2X2R-YFP (
Fig. 6
C)
fluo-rescence were plotted. Quantification of the areas under
individ-ual fluorescence curves (normalized for 5-HT
3AR-HA
⫹ eGFP
mean value;
Fig. 6
E) showed that the amount of 5-HT
3AR in the
axons was dramatically increased by the presence of P2X2R in the
same neurons (⫹525.3 ⫾ 42.1%) with statistical significance
(one-way ANOVA, n
⫽ 30, p ⬍ 0.0001). The relatively lower, but
not null, quantity of 5-HT
3AR present in axons of neurons
cotransfected with e-GFP (
Fig. 6
B, blue curve) could be
attrib-uted to the contribution of the 11.4% of neurons already
express-ing native P2X2R (see above). Finally, axonal lengths were not
different between the two groups as shown by eGFP and
P2X2R-YFP fluorescence profiles (
Fig. 6
C).
The specificity of the physical partnership between 5-HT
3Aand P2X2 receptors was evaluated by quantification of the
colo-calization of the clustered components of receptor fluorescence
Figure 6. P2X2 receptors induce 5-HT3Areceptor targeting in axons. Hippocampal neurons were cotransfected at 4 –5 DIV with 5-HT3AR-HA plus eGFP or 5-HT3AR-HA plus P2X2-YFP. A, Immunofluorescence detection (red represents anti-HA; green represents anti-eGFP) was performed 48 h after transfection. Arrows indicate the axons. Scale bar, 50m.B,Cumulatedfluorescence intensity profiles of 5-HT3AR-HA along the axons (longest path, n⫽30)for5-HT3AR-HA plus eGFP (blue) or 5-HT3AR-HA plus P2X2-YFP (red). C, Cumulated fluorescence intensity profiles of eGFP and P2X2-YFP along the same axons (n⫽ 30) for 5-HT3AR-HA plus eGFP (green) or 5-HT3AR-HA plus P2X2-YFP (orange). D, Quantification of the number of neurons exhibiting 5-HT3AR-HA immuno-fluorescence at distances above (distal) or below (proximal) 100m from somas for 5-HT3AR-HA plus eGFP or 5-HT3AR-HA plus P2X2-YFP. Bars represent the relative proportions of the two groups (mean⫾SEM)foreachcotransfectioncondition(two-wayANOVA,n⫽324andn⫽399,respectively,p⬍0.0001).E,Areasunderindividualcurves(cumulatedinB)fordistancesof0–1000m were averaged. Bars represent the mean⫾ SEM; n ⫽ 30. ****p ⬍ 0.0001 (two-way ANOVA with Bonferroni’s Multiple Comparison post hoc test).
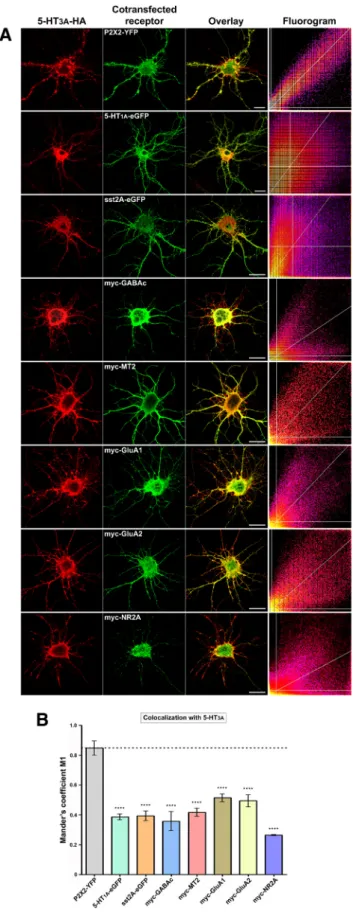
in the dendritic tree, and comparison with other noninteracting
receptors (
Fig. 7
). We chose this method rather than the
quanti-fication of the axonal distribution because it was appropriate for
all receptors tested, all of them having a dendritic representation,
whereas most of them were not axonal. Neurons were
cotrans-fected with 5-HT
3AR-HA and either P2X2R-YFP or seven other
tagged receptors that were not described to functionally interact
with 5-HT
3AR. ROI were chosen within the dendritic trees, and
colocalization was monitored with the JACoP plugin of ImageJ
(
Bolte and Cordelie`res, 2006
), using manual thresholding to
restrict the quantification to the clustered component of
5-HT
3AR-HA immunostaining. Although colocalization of
im-munofluorescence signals cannot be considered as proof of
phys-ical interaction between proteins, we used this method to show
that the absence of colocalization between noninteracting
receptors could evidence the specificity of the 5-HT
3A/P2X2
in-teraction. Indeed, this method proved to distinguish between
physically interacting receptors exhibiting coclustered dendritic
distributions (Mander’s M1 coefficient close to 0.8, characteristic
plume-shaped fluorograms) and noninteracting receptors
char-acterized either by nonoverlapping clusters or by one receptor
being clustered and the other exhibiting a diffuse component
only (random overlap, Mander’s M1 coefficient close to 0.4,
diffuse or bimodal fluorograms) (
Figs. 7
B,
8
C,
9
B). Mander’s
M1 coefficients (percentage of clustered 5-HT
3AR-HA
over-lapping with the clustered component, when relevant, of the
cotransfected receptor) are presented in
Figure 7
B. Moreover,
none of the receptors yielding Mander’s M1 coefficients
⬃0.4
changed significantly 5-HT
3AR-HA distribution in either
neuritic compartment (
Fig. 7
A), showing that 5-HT
3AR
retar-geting by P2X2R was related to their specific physical
recep-tor–receptor interaction.
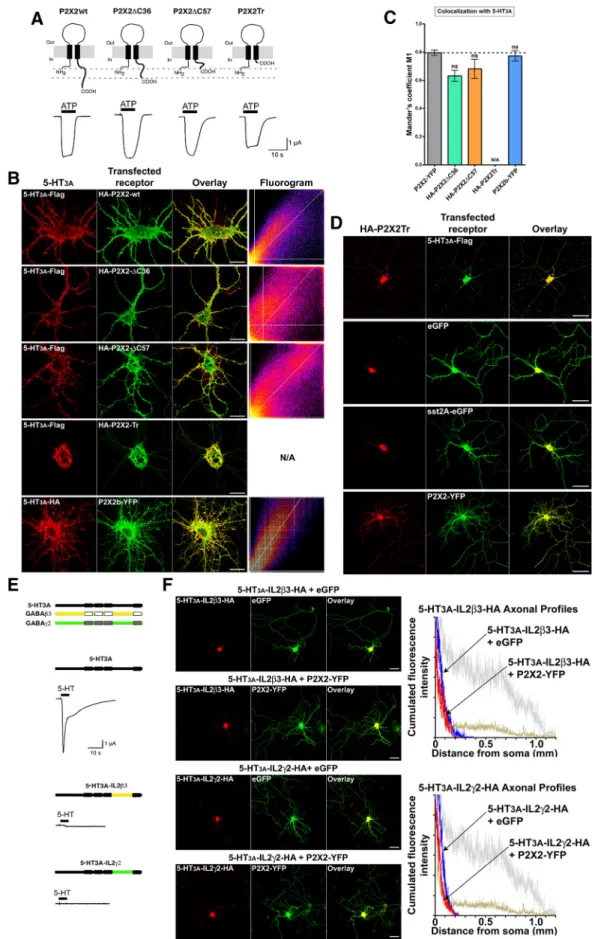
The 5-HT
3Aand P2X2 physical interaction depends on
5-HT
3AIL2, but not on the P2X2 C-tail
We have demonstrated previously that the functional
cross-inhibition between 5-HT
3Aand P2X2 receptors involved the
C-terminal tail of the P2X2R and the IL2 domains of the cys-loop
ionotropic receptors (
Boue´-Grabot et al., 2003
), and that channel
occlusion was subunit dependent in the case of GABA
AR (
Boue´-Grabot et al., 2004a
). To challenge whether the functional and
physical couplings of 5-HT
3Aand P2X2 receptors depended on
the same peptidic domains, we prepared truncated forms of the
P2X2R (
Fig. 8
A) and chimeras of the 5-HT
3AR in which the IL2
domain was replaced by the corresponding loops of
3 or ␥2
subunits of the GABA
Areceptor (
Fig. 8
E). HA-tagged P2X2
⌬C36
and P2X2⌬C57 (lacking the C-terminal 36 and 57 amino acids,
respectively) appeared to be fully functional and responded to
ATP application in Xenopus oocytes (
Fig. 8
A) as expected by their
surface expression in neuron somas and dendrites (
Fig. 8
B).
However, because we found their axonal targeting partially
impaired, their physical association with 5-HT
3AR-Flag was
monitored by measuring Mander’s M1 coefficients for their
co-clustering in the dendritic tree (
Fig. 8
B, C) and was found to be
statistically not different from HA-P2X2Wt (
Fig. 8
C), thereby
Figure 7. Specificity of the 5-HT3Aand P2X2 receptor interaction. Hippocampal neuronswere cotransfected at 7 DIV with 5-HT3A-HA and P2X2-YFP, 5-HT1A-eGFP, sst2A-eGFP, myc-GABAc (1),myc-MT2,myc-GluA1,myc-GluA2,ormyc-NR2Asubunits.A,Immunofluorescence detection was performed after 48 h (red represents anti-HA; green represents anti-eGFP or anti-myc). Scale bars, 20m. ROI were chosen within the dendritic trees to select cluster-rich areas and avoid the center of large neurites, and colocalization was monitored with the JACoP plugin of ImageJ (manual thresholding). Corresponding fluorograms for each cotransfected
4
couple of receptors are represented on the right panels. B, Bars represent mean⫾ SEM values of Mander’s M1 coefficients (percentage of 5-HT3AR-HA fluorescence overlapping with cotrans-fected receptor’s fluorescence). Significant differences appeared only between interacting (P2X2) and noninteracting subunits (one-way ANOVA with Dunnett’s Multiple Comparison post
Figure 8. The physical interaction between 5-HT3Aand P2X2 receptors depends on 5-HT3AIL2, but not on the P2X2 C-tail. A, Schematic representation of P2X2Wt and the C-terminal truncated forms: P2X2⌬C36, P2X2⌬C57, and P2X2Tr. Bottom, Current traces evoked with 100MATP by voltage-clamp recordings from Xenopus oocytes expressing each form, showing that they are all
functional. B, Hippocampal neurons were cotransfected with 5-HT3A-Flag and HA-P2X2, HA-P2X2⌬C36, HA-P2X2⌬C57, HA-P2X2Tr (top) or 5-HT3A-HA and P2X2b-YFP (bottom). Immunofluores-cence detection was performed at 48 h (red represents anti-Flag; green represents anti-HA [top]; or red represents anti-HA; green represents anti-GFP [bottom]). Right panels, Fluorograms as in Figure 7A. Scale bars, 20m. N/A, Not applicable. C, Bars indicate mean ⫾ SEM values of Mander’s M1 coefficients. No significant differences appeared (Figure legend continues.)
demonstrating that the physical association between 5-HT
3Aand
P2X2 receptors did not require any of the motifs present in the
C-terminal tail. We also tested a naturally occurring splice variant
of the P2X2 receptor: the P2X2b. The P2X2b isoform presents a
69 amino acid deletion in a sequence of the C-tail that is not
present in the other subunits. This sequence contains two short
hydrophobic segments highly enriched in prolines and three
recognition sites for serine kinases (
Simon et al., 1997
). However,
we did not find any differences between P2X2-YFP and
P2X2b-YFP, in their coclustering with 5-HT
3A-HA in the dendritic trees
of neurons (
Fig. 8
B, bottom, C), in their axonal distributions, or
in their capability of retargeting 5-HT
3AR in the axons (data not
shown). Surprisingly, the complete removal of the C-terminal tail
of the P2X2R had a dramatic effect on 5-HT
3AR localization.
P2X2Tr is a truncated form of the P2X2R lacking the 98
C-terminal amino acids, and devoid of functional interaction
with 5-HT
3Areceptors (
Boue´-Grabot et al., 2003
) but in which
the proximal 20 amino acids containing the YXXXK motif
con-trolling the surface expression are conserved (
Chaumont et al.,
2004
).
Figure 8
B shows that this truncated form lacked
com-pletely the capability to be targeted further than 50
m from cell
somas, indicating that the C-tail of the
P2X2R contains both axonal and
den-dritic trafficking motifs. Interestingly, the
loss of these P2X2R trafficking motifs
in-duced a concomitant sequestration of
cotransfected 5-HT
3AR within the neuron
soma where both receptors colocalized
completely (
Fig. 8
B). Further controls
were designed to verify that (1) the
se-questration of both receptors within the
somas was not the consequence of a
non-specific blockade of the trafficking
ma-chinery by P2X2Tr overexpression and
(2) the sequestration of the 5-HT
3AR was
specific and did not occur for a
noninter-acting receptor.
Figure 8
D shows that
cotransfection of HA-P2X2Tr completely
impaired 5-HT
3AR-Flag trafficking, even
in proximal dendrites, but was without
consequence on eGFP or sst2A-eGFP
ex-pression in dendrites and axons, thereby
demonstrating the selectivity of this effect
for 5-HT
3Areceptors. Moreover, the
cotransfection of P2X2R-YFP with
HA-P2X2Tr could rescue the latter from sequestration within cell
somas (
Fig. 8
D), as expected if the two subunits were
coas-sembled and if the trafficking machinery was not altered.
Al-though these results could be interpreted either by a tight
association between 5-HT
3Aand P2X2Tr subunits despite the
absence of the C-terminal domain, or by a complete loss of
5-HT
3AR trafficking due to competition of P2X2Tr with
endog-enous P2X2R, they clearly demonstrate the complete dependency
of 5-HT
3AR for their P2X2R targeting partner.
5-HT
3AIL2
3-HA and 5-HT
3AIL2
␥2-HA chimeras were
found to be nonfunctional in Xenopus oocytes (
Fig. 8
E).
How-ever, this lack of response to 5-HT could largely be attributed to
their lack of surface expression, as we observed in neurons (data
not shown). Cotransfection of both chimeras with P2X2R-YFP in
neurons at 4 –5 DIV revealed that neither their surface expression
nor their dendritic or axonal distributions were affected by the
presence of the P2X2R within the same neurons (
Fig. 8
F ).
Cu-mulated fluorescence analysis in axons (
Fig. 8
F, right panels) and
comparison with 5-HT
3AWt curves (in gray) showed no effect,
and consequently confirmed that 5-HT
3Awild-type IL2 integrity
was necessary for its physical coupling with the P2X2R.
From all these observations, we can conclude that the
molec-ular determinants of the physical and functional couplings of
5-HT
3AR and P2X2R are different. As a result, even if the
func-tional coupling of the two receptors leading to cross-inhibition of
the channels has been shown to involve a direct protein–protein
contact between subunits, such a physical interaction between
subunits is only one of the possible mechanisms explaining the
5-HT
3/P2X2 cotrafficking, and we cannot totally exclude here the
participation of a third-party scaffolding protein partner.
5-HT
3Areceptors interact with other members of the
P2X family
To determine whether the receptor–receptor partnership between
5-HT
3AR and P2X2R concerned other members of the P2X family,
we chose the P2X4 receptor because P2X2 and P2X4 are the two
predominant purinoceptors present in brain neurons, and the P2X3
receptor because it is largely expressed in the periphery with the
P2X2R to form heteromers (
North, 2002
). P2X3R have been
de-4(Figure legend continued.) between colocalization of 5-HT3Aand P2X2Wt, P2X2⌬C36, P2X2⌬C57,orP2X2b(one-wayANOVAwithDunnett’sMultipleComparisonposthoctest);n⫽ 4 – 8. ns, Nonsignificant. The measurements with P2X2Tr were not relevant because there was no dendritic expression of either subunit. D, Hippocampal neurons were cotransfected at 7 DIV with HA-P2X2Tr and 5-HT3A-Flag, eGFP, sst2A-eGFP, or P2X2-YFP. Immunofluorescence detec-tion was performed at 48 h (red represents anti-HA; green represents anti-Flag or anti-eGFP). Scale bar, 50m.E,Schematicdiagramsrepresenting5-HT3A, GABAA3,and␥2subunits,and chimeric 5-HT3Asubunits endowed with3 and ␥2 IL2 domains. Current traces obtained with 100M5-HT in oocytes expressing each chimera show their nonfunctionality. F, Hippocampal
neurons were cotransfected at 4 –5 DIV with 5-HT3AIL23-HA or 5-HT3AIL2␥2-HA chimeras plus eGFP (top) or 5-HT3AIL23-HA or 5-HT3AIL2␥2-HA chimeras plus P2X2-YFP (bottom). Immunofluorescence detection of chimeras (anti-HA; red) and eGFP or P2X2-YFP (anti-eGFP; green) was performed 48 h after transfection. Scale bars, 50m.Graphsontherightrepresent cumulated fluorescence intensity profiles of 5-HT3AIL23-HA (top) or 5-HT3AIL2␥2-HA (bot-tom) fluorescence along the axons (longest path, n⫽ 20) for the chimeras plus eGFP (blue) or P2X2-YFP (red). Gray shades represent, for comparison, the corresponding curves obtained with 5-HT3A-HA (Fig. 6B).
Figure 9. 5-HT3Ainteracts with P2X3R and P2X4R. Hippocampal neurons were cotransfected at 6 DIV with 5-HT3A-HA and P2X2-YFP, P2X3-Flag, or P2X4FlagIN subunits. A, Immunofluorescence detection was performed after 48 h (red represents anti-HA; green represents anti-eGFP or anti-Flag). Scale bars, 20m. Right panels, Fluorograms as inFigure 7A. B, Bars indicate
mean⫾ SEM values of Mander’s M1 coefficients. No significant differences appeared between colocalization of 5-HT3Aand P2X2Wt, P2X3, or P2X4FlagIN (one-way ANOVA with Dunnett’s Multiple Comparison post hoc test); n⫽ 4–8. ns, Nonsignificant.