Publisher’s version / Version de l'éditeur:
Vous avez des questions? Nous pouvons vous aider. Pour communiquer directement avec un auteur, consultez la
première page de la revue dans laquelle son article a été publié afin de trouver ses coordonnées. Si vous n’arrivez pas à les repérer, communiquez avec nous à [email protected].
Questions? Contact the NRC Publications Archive team at
[email protected]. If you wish to email the authors directly, please see the first page of the publication for their contact information.
https://publications-cnrc.canada.ca/fra/droits
L’accès à ce site Web et l’utilisation de son contenu sont assujettis aux conditions présentées dans le site LISEZ CES CONDITIONS ATTENTIVEMENT AVANT D’UTILISER CE SITE WEB.
Proceedings of the International Symposium on Intelligent Data Analysis (IDA-95),
1995
READ THESE TERMS AND CONDITIONS CAREFULLY BEFORE USING THIS WEBSITE.
https://nrc-publications.canada.ca/eng/copyright
NRC Publications Archive Record / Notice des Archives des publications du CNRC : https://nrc-publications.canada.ca/eng/view/object/?id=59941a1f-5d60-4ed7-996d-f7fee23ad818 https://publications-cnrc.canada.ca/fra/voir/objet/?id=59941a1f-5d60-4ed7-996d-f7fee23ad818
NRC Publications Archive
Archives des publications du CNRC
This publication could be one of several versions: author’s original, accepted manuscript or the publisher’s version. / La version de cette publication peut être l’une des suivantes : la version prépublication de l’auteur, la version acceptée du manuscrit ou la version de l’éditeur.
Access and use of this website and the material on it are subject to the Terms and Conditions set forth at
The Role of Data Pre-Processing in Intelligent Data Analysis
The Role of Data Pre-processing in Intelligent Data Analysis
A. Famili
Knowledge Systems Laboratory Institute for Information Technology National Research Council Canada Ottawa, Ontario, Canada K1A 0R6 [email protected]
Key Words: Data Analysis, Data Pre-processing, Induction, Machine Learning Applications
Abstract:
This paper first provides a brief overview of some frequently encountered real world problems in data analysis. These are problems that have to be solved through data pre-processing so that the nature of the data is better understood and the data analysis is performed more accurately and efficiently. The architecture of a data analysis tool for which a data pre-processing mechanism has been developed and tested is also explained. An example is then given of the use of this data pre-processing mechanism for two purposes: (i) to filter out a set of semiconductor data, and (ii) to find out more about the nature of these data and make the induction process more efficient.
1.0 Introduction:
Data analysis is now integral to our working lives. It is the basis for investigations in many fields of knowledge, from science to engineering and from management to process control. Data on a particular topic are acquired in the form of symbolic and numeric attributes. Analysis of these data gives a better understanding of the phenome-non of interest. When development of a knowledge-based system is planned, the data analysis involves discovery and generation of new knowledge for building a reliable and comprehensive knowledge base.
Many efforts are being made to analyse data using a commercially available tool or to develop an analysis tool that meets the requirements of a particular application. Almost all these efforts have ignored the fact that some form of data processing is usually required to intelligently analyse the data. This means that through data pre-processing one can learn more about the nature of the data, solve problems that may exist in the raw data (e.g. irrelevant or missing attributes in the data sets), change the structure of data (e.g. create levels of granularity) to prepare the data for a more efficient and intelligent data analysis, and solve problems such as the problem of very large data sets.
There are several different types of problems, related to data collected from the real world, that may have to be solved through data pre-processing. Examples are: (i) data with missing, out of range or corrupt elements, (ii) noisy data, (iii) data from several levels of granularity, (iv) large data sets, data dependency, and irrelevant data, and (v) multiple sources of data. This paper focuses on the problems listed under (i), (iii) and (iv). However, before these problems are discussed, a brief explanation of the motivation for this work is given.
2.0 Motivation
The main motivation for this study was to identify some of the problems that exist in the real world data that require data pre-processing and to build a tool that can be used to solve these problems. The tool was needed for a data analysis software package developed at the National Research Council of Canada. The main role of this soft-ware is to analyse data from an industrial process and explain why some productions fail. Figure 1 shows the basic architecture of this software. The architecture consists of a learning component (IMAFO - Intelligent
MAn-2
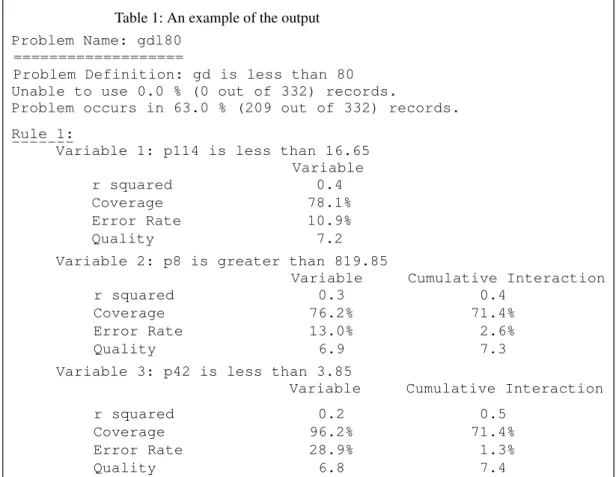
The learning component is a variation of Quinlan’s ID3 algorithm [Quinlan 89, Famili and Turney, 91]. Its main function is to analyse the data collected from a process and to search for descriptions of unsuccessful productions as defined by the user. A data analysis application is set up through a template in which data format, the type of problems for which the data is analysed, and the variables to be used during the analysis are the main settings to be done by a user. IMAFO then analyses the data during which it builds a decision tree for each problem, prunes the tree, and converts it to a set of rules that explain the problem [Famili and Turney, 91; Famili et al., 95]. However, a User Assistant module was designed and implemented to provide support for easy and efficient use of this software. The User Assistant (see Figure 1) has two main functions: (i) data pre-processing, to filter the cor-rupt and out-of-range data and to help users to understand the nature of the data by identifying the principle com-ponents, (ii) rule post-processing, to filter out irrelevant and unreliable rules and to summarize the results of data analysis. The data analyzed are in the form of attribute vectors of the numeric or symbolic types, representing dif-ferent aspects of a production environment (e.g. process variables). Table 1 shows an example of a decision tree generated for one problem that has been converted to a form that is easily understood by process engineers. The information in this rule consists of:
• the names of the independent variables that influence the process (variables selected for the nodes of the deci-sion tree, i.e., p114, p8 and p42),
• the particular threshold below or above which the problem may exist, • the coverage and error rate that represent the reliability of the relationship.
Fig. 1: The architecture of IMAFO and the User Assistant
and Rule Filtering
IMAFO
Reasons for Failed Plans LearningMechanism InitializationMechanism User
Interface GeneratorRule
Summary Verification and Input Data Filtering
User Assistant
Industrial Process
Production
Data
Process Engineers
3.0 The Approach
There are many types of data pre-processing techniques that can be applied to the data to make data analysis more efficient and intelligent. Some of these techniques are related to problems in the data. Examples are: noise model-ling, data filtering, and selection/sampling to identify important data. Other techniques are chosen simply to pro-vide a more intelligent data analysis. Examples of these techniques are: data transformation, similitude modelling, and principle components analysis.
The main goal of data pre-processing is to help process engineers to learn more about the data and to properly set up the data analysis application. Our approach was to target on three problems: (i) corrupt data, (ii) out-of-range data, and (iii) principle components analysis. All three involve pre-processing to assist in better understanding and more meaningful analysis of the data. Since the induction mechanism (IMAFO) is building a decision tree, corrupt and out-of-range data may cause the following problems: (i) the selection of a test to partition the data set would require comparison of tests based on the assumptions that all values of all attributes are available and they are correct, and (ii) the selection of a test may not be valid if a large amount of data consists of outliers.
Principle components analysis, however, involves checking the linear dependency among independent variables in a set of data attributes. Correlation checking is performed in the entire data set. The correlation ratios between any pair of independent variables are then used to focus on principle components by eliminating certain variables from the entire measurement space. Since inductive algorithms are computationally expensive, any simplification in the form of selection of relevant attributes will speed up the data analysis. Following are the concepts that we have designed and implemented as part of the pre-processing mechanism.
Table 1: An example of the output Problem Name: gdl80
===================
Problem Definition: gd is less than 80 Unable to use 0.0 % (0 out of 332) records.
Problem occurs in 63.0 % (209 out of 332) records. Rule 1:
Variable 1: p114 is less than 16.65 Variable r squared 0.4 Coverage 78.1% Error Rate 10.9% Quality 7.2 Variable 2: p8 is greater than 819.85
Variable Cumulative Interaction r squared 0.3 0.4
Coverage 76.2% 71.4% Error Rate 13.0% 2.6% Quality 6.9 7.3 Variable 3: p42 is less than 3.85
Variable Cumulative Interaction r squared 0.2 0.5
Coverage 96.2% 71.4% Error Rate 28.9% 1.3% Quality 6.8 7.4
4
Before the data are analyzed, on a given data file: (i) The length of each record is checked and records with too few or too many attribute values than defined in the application are eliminated, (ii) Each value of each attribute vector is also checked for improper type. For example, if the attribute vector is defined as a timestamp and the attribute value is real, the user is informed. (iii) Each value of each attribute vector is then checked for out-of-range data. This is especially important if the process engineers have different goals in each process (regulations and quality control standards). Facilities have been designed for importing or generating range files for a particu-lar application. Typical information in a range file consists of the upper and lower range for the attributes of inter-est. At the end of the error checking, a secondary data file can be generated that would contain clean data. No mechanism has yet been developed to replace the missing, corrupt, or out-of-range data attributes with other val-ues (e.g. average of the remaining valval-ues in the attribute vector). (iv) Once a clean data file is generated, the linear dependency between independent attributes can be checked. As part of the correlation checking mechanism, we have developed facilities that allow the user to look at the correlation between any pair of independent variables and, if desired, eliminate certain attributes from the analysis. In the presence of noisy data, a large number of irrel-evant and linearly dependent attributes (that otherwise should be eliminated) can produce complex decision trees, requiring efficient pruning methods or some node quality and tree size control mechanisms.
The following equation was used to investigate the collinearity between two variables (U and W) in a multidi-mensional space (Draper and Smith, 81) that consists of i numeric attributes:
The results of correlation checking are presented to the user as follows: for every independent variable, the corre-lation ratio between it and all other variables is listed. The user can then decide, in each pair, which of the two highly correlated variables (e.g. ruw= 0.95) can be eliminated from the analysis. A variable eliminated from the analysis, will no longer be available as a dimension of measurement space during the analysis. The elimination will be automatically applied to all problem definitions. Section 4 includes experiments related to the use of all the mechanisms that we have developed as part of the pre-processing facilities.
4.0 Results from a Real World Application
The data pre-processing mechanism has been tested and evaluated in several real world applications. In one appli-cation, reported here, two data sets collected from a semiconductor manufacturing operation, each consisting of data for 79 attributes and 150 records, were used. The following experiments were performed to evaluate the per-formance of our mechanism:
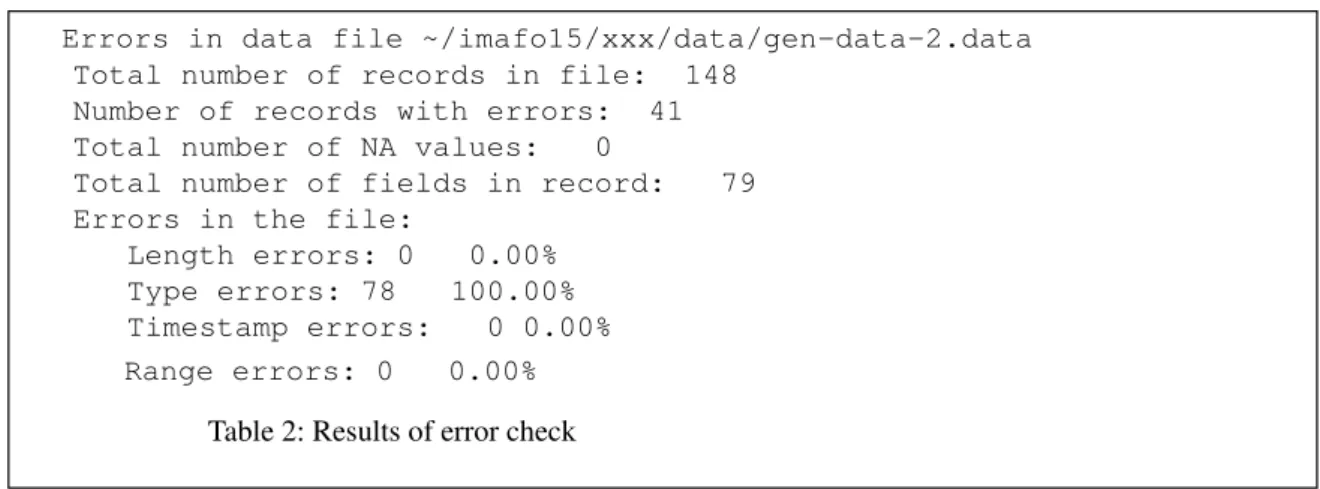
• Each data set was first checked for missing, corrupt and out-of-range data. Table 2 shows a summary of the results of error checking for one of the data sets.
This summary shows that 41 records in this data set contained one or more errors of any type. The corrected data file would therefore have 107 records for analysis. In addition to the above information, the user can retrieve the description of the names of the attributes that contained the errors. This would help them to trace the cause of the errors (e.g. sensor faults, improper conversion, etc.). Detection and elimination of the errors before data analysis helps in having an unbiased analysis and a more reliable set of results. No mechanism has yet been developed to replace the missing, corrupt, or out-of-range data attributes with other values (e.g. average of the remaining val-ues in the attribute vector).
• The corrected data sets were then checked for correlations between the independent variables. Table 3 shows the results of correlation checking performed on one of the data files.
r
uw
Σ Ui–U ( ) (Wi–W) Σ(Ui–U)2 { } 1 2 ---Σ(Wi–W)2 { } 1 2 --- ---= (1)Table 3 shows only the correlations that are above 0.55, between two attributes (pinch-res-10ua and b-r-linewidth) and others. The results of a correlation table can be used as follows: for every pair of independent variables in which the correlation is high (above a ceratin threshold, e.g., 0.8), one of the two variables can be eliminated from one or more problem spaces during the analysis. This elimination depends on the significance of the variable, as process engineers may want to know the effects of both variables on the problem, regardless of their interdependency level. Elimination of one of each pair of variables would make the data analysis process faster and simpler and the analysis would only be focused on principle components. Algorithms have been devel-oped to automatically use the results of the correlation check, without consulating the users. However, this is not appropriate in semiconductor manufacturing, as process engineers should decide which variables can be elimi-nated from the analysis
.
References
Famili, A. and Turney, P. (1991); Intelligently helping human planner in industrial process planning. AIEDAM, VOL 5(2), (pp. 109-124)
Famili, A., Huang X. and Rolleston, A. (1995); Data Pre-processing and Rule Post-processing in an Induction System, paper submitted for publication to the Applied Intelligence Journal.
Quinlan, J.R. (1989); Induction of Decision Trees, Machine Learning, Vol. 1, (pp. 261-283)
Riddle, P., Segal R. and Etzioni O. (1994); Representation Design and Brute-Force Induction in a Boeing Manu-Errors in data file ~/imafo15/xxx/data/gen-data-2.data
Total number of records in file: 148 Number of records with errors: 41 Total number of NA values: 0
Total number of fields in record: 79 Errors in the file:
Length errors: 0 0.00% Type errors: 78 100.00% Timestamp errors: 0 0.00% Range errors: 0 0.00%
Table 2: Results of error check
** CORRELATION CHECKING REPORT (threshold: .55) ** Correlations (r-square) with pinch-res-10ua:
large-npn-beta 0.83 smnpn-beta-1ma 0.78 smnpn-beta-10ua 0.6 smnpn-is-10ua 0.6 smnpn-va-ib-150n 0.72 smnpn-diode-con 0.61 Correlations (r-square) with b-r-linewidth: pnp-va-ib-150n 0.55 beta-idss-vp-2 0.78
Table 3: Results of correlation check .
. .