LIBRARY OF THE
MASSACHUSETTSINSTITUTE OF TECHNOLOGY
WORKING
PAPER
ALFRED
P.SLOAN
SCHOOL
OF
MANAGEMENT
Dewey
ACTION - RESEARCH AS A CYCLICAL PROCESS
Irwin M. Rubin Fritz I. Steele WP 812-75 October 1975
MASSACHUSETTS
INSTITUTEOF
TECHNOLOGY
50MEMORIAL
DRIVE
CAMBRIDGE,
MASSACHUSETTS
02139ACTION - RESEARCH AS A CYCLICAL PROCESS
Irwin M. Rubin Fritz I. Steele
WP 812-75 October 1975
m
212-15"
Action-Research as a Cyclical Process
Introduction
The process by which an OD consultant goes about working with an organization has been compared to the way in which a detective goes about solving a crime. The consultant "detective" searches for clues and contin-ually uses the data at hand to guide next steps. The overall intervention strategy is therefore, molded and shaped by both some overall objective and the insights gleaned from previous steps.
While many consultants experience this iterative cyclical process, there appears to be little in the way of any systematic study of the con-ditions or variables which influence these on-line choices- The consultant
is reminded of the need to besensitive to cultural differences, for example, but there are little systematic data relating to a) what differences lake a difference and b) in what ways.
One notable exception in this regard is Alderfer's work on different
2
models and structure for the feedback of ;urvey research data. His research demonstrates how an analysis of the survey data can guide a consultant in the decisions which must be made around questions of "who should receive what data, when, in what form?" The study to be reported in this paper deals with
a related set of issues.
In conjunction with our efforts in introduce OD into a mediui' size refinery of a large U.S. oil company we have become aware of the ways in which a particular demographic variable
—
the age distribution of the organization's members—
has influenced our strategy of intervention.
-2-Marked differences in perceptions held by "young" vs. "old" employees became apparent after an initial questionnaire survey of tho organization. These differences significantly influenced the form and purpose of additional data collection efforts, the structure and sequence of feedback sessions, and the chain and flow of subsequent action steps.
Background - The Setting
The setting for this effort was a medium size refinery (total manpower of about 800), located in the mid-west. The refinery had three major
departments
—
an Operations Department (Production), a Facilities Department (Maintenance), and an Employee and Plant Services Department (Personnel).
The target group for the intervention under discussion was the entire managerial staff (N=102) of the refinery. This included all the salaried, exempt,
supervisory personnel from the Refinery Manager through and including the first "ine foreman. The refinery was non-union.
The original plan envisioned the following sequence of steps. An initial
3
questionnaire survey would be conducted with the entire managerial staff, A folloT7-up interview was to be- c°nducted with a subset (20%) of this total
sample to add breadth and clarity to the diagnostic questionnaire data. These data were then to be analyzed and summarized with feedback given to organic work groups (family groups). Priority areas needing attention ->nd
action plans to deal with these priorities would flow from these family grou^ feedback sessions.
The original plan , therefore, was straightforward and envisioned a
-
2-Initial Examination of HOER Data
The initial cut at the HOER data involved a straightforward tabulation of total sample responses and a subgroup tabulation across the three major departments. The potential importance of demographic characteristics became more clear from an examination of some of these traits within the total sample.
(See Table One)
.
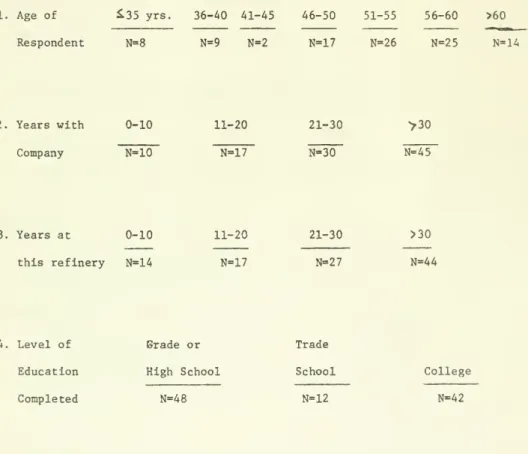
Eighty- two per cent of the sample was over 45 years of age, 75% had
been with the company over 20 years, and 70% had been at this one refinery over 20 years. Almost 40% could be expected to retire in the next 5-7 years. The organizational implications of such a demographic pattern, independent of
A
any OD strategy issues, are extensive but will not be addressed in this paper. The marked skewness of these distributions led to an examination of the relationship between age and the items on the HOER. The results were dramatic. As a single variable, age correlated significantly (p< .05 or better) with 35 of the total of 80 questionnaire items. These correlations were always in the direction of the younger group being "more critical, more frustrated, less satisfied" than the older group. A subset of these differences, grouped around several themes is presented in Table Two.
Interpreting the Results
At the most general level, these rather marked differences can be taken as an indicator of the "generation gap." The younger group, given the differences in their educational levels and life experiences, could be expected to have quite different expectations than the older group. A given situation is percieved to be "good or bad," in part, as a function of what one sees as ideal or legitimate.
-4-The fact that so large a group (the older employees) had spent virtually their entire work lives in this one organization is also relevant. For them the absence of any experience with an alternative could also contribute to less of a sense of dissatisfaction . . . "If you've never tasted steak, chipped
beef tastes pretty good."
A third possibility has to do with the impact of loyalty as a norm and the related impact of a local vs. a cosmopolitan orientation. A strc"-; sense of loyalty, assumed to be a characteristic of the older group, could easily lead a person to not want to be critical of the company or his boss. In addition, for a person close to retirement, strong pressures could be felt not to rock the boat . . . "The company's been good to mc and I've only got
a few years left anyway.
"
Undoubtedly, all of these possibilities were operating in varying degrees. Under any circumstances, the data raised serious questions about the total system's readiness for change. Beckhard provides a particularly useful
7
perspective in this regard.
In determining readiness for change, there is a formula developed by David Gleicher of Arthur D. Little that is particularly helpful. The formula can be described mathematically as C = (abd)> x, where C = change, a =
level of dissatisfaction with the status quo, b = clear or understood desired state, d = practical first steps toward a desired state, and x = "cost" of changing. In other words, for change to be possible and for commitment to occur, there has to be enough dissatisfaction with the current state of affairs to mobilize energy toward change. There also has to be some fairly clear conception of what the state of affairs would be if and when the change were successful. Of course, a desired state needs to be consistent with the values and priorities of the client system. There also needs to be some client awareness of practical first steps, or starting points, toward the desired state.
Given the data presented above, it would appear that a significant majority in the system were not dissatisfied with the status quo. Furthermore, as Beckhard points out, "a desired state needs to be consistent with the values and priorities of the client system." Within this system, given the differences related to age, there appeared to be two client systems with very different values and priorities. Further diagnosis of these hunches would be essential to guide subsequent decisions. As Beckhard comments :
An early diagnosis by the consultant of which of these conditions does not exist, or does not exist in high strength, may provide direct clues concerning where to put early intervention energy. For example, if most of the system is not really dissatisfied with the present state of things, then early interventions may well need to aim toward increasing the level of dissatisfaction. On the other hand, there may be plenty of dissatisfaction with the present state, but no clear picture of what a desired state might be. In this case, early interventions might be aimed at getting strategic parts of the organization to define the ideal or desired state. If both of these conditions exist but practical first steps are missing, then early intervention strategy may well be to pick up some subsystem, e.g., the top unit or a couple of experimental groups, and to begin
improvement activities.
Implications - The Follow-up Interview as an Intervention
The original plan called for interviewing a subset (20%) of the total population in order to gain additional content data about substantive problems or issues related to the dimensions of organizational health tapped by the HOER. The conditions described above suggested the need for
8 a different objective.
To help guide future decisions, the interview would need to provide clarity on the system's level of readiness for change. The focus,
-6-in essence, should be upon the readiness for change formula; C = (abd)> cost. Additional content data were not a priority at this stage.
In addition, we explicitly wanted this interview process to bo an active intervention versus us being solely the passive recipients of data. Through our interactions with the interviewers, we hoped to increase the very readiness for change we were diagnosing. For example, a person who was already dissatisfied with the status quo (variable "a" in the formula) would, through the interview process, come away with a clearer image of a more desirable state (variable "b") and possibly some image of practical first steps (variable "d"}. Given these objectives, it was decided to interview the entire sample rather than a small subset.
The strategy adopted was as follows. Two central themes were represented in the HOBR data which, from our viewpoint, were at the very core of the potential outcomes from an OD effort. One was the apparent "crisis orientation" of the system. This orientation was exemplified by general agreement with items like the following :
"As an organization, we weem to take crises as they come and put out fires, rather than taking steps to head them off in advance." To us, it was symptomatic of many issues needing attention. A short run crisis orientation feeds on itself and can serve as a major obstacle to
-7-The second had to do with the extent to which people felt they could influence decisions in the company that affect their own lives. This orientation was exemplified by general lack of agreement with an item like the following : " I feel that I can influence decisions in the
company that affect my life." To us this symbolized a strong normative bias which underlay the entire OD effort : in a healthy organization
which supports healthy members, people should have influence over decisions that affect their lives.
Each individual interviewed was shown the actual HOER item which reflected each of these themes and the actual distribution of total responses. The interview was designed to both tap and influence an individual's level of readiness for change. The protocol on probes were generally as follows :
-8-1) Do you personally agree that this situation (each of the two focal themes) exists? Is it true for you? (At one level, this asks the person what his/her individual response was.)
2) Do you think this is a "good or a bad" situation? How do you feel about it?
3) Should or could this situation be different? In what ways might it be different?
4) What could you yourself do to improve this situation ? What steps could you take without any help from anyone else (consulLant or task force members)?
Acceptance of the data(Question l)was generally high -Most people confirmed that the particular situation existed - they did not "deny" the data
-even if it"were not true" for them as an individual. Levels of dissatisfaction (variable "a" in the change formula) were, however, quite skewed. The major theme, particularly
witMn
the older group, was: "That's the way it's always been around here!" or "If you think it's bad now, you should have been here 20 years ago!"The ability to imagine and articulate a more desired sLate (variable "b") was also skewed. The older group, for example, had been so socialized to not have influence over decisions which affect their lives that it was truly difficult for them to imagine an alternative. The loyalty theme (presumed to be an element in the "cost" factor) was strongest in this regard: "In my day, you were happy just to get a job. These young college kids don'tknow when they're well off."
Few people could identify practical first steps (variable "d") which would represent movement toward a more desired state. The two major themes
-9-refinery) to do something if they think it's a problem," and "I'm only a few years away from retirement. They've been good to me and I'm not about to rock the boat." (Again, presumed to be an element in the "cost" factor), rven among those who could see practical first steps, there was a strong sense of pessimism : "Nothing meaningful will happen if 'they' don't
put their full weight behind it."
Results of 'he: Interviews
A8 a result of the interviews, it was possible to identify
it sample we
defined as "potential movers" - people whose overall readiness for change was relatively high and/or for whom the "cost" of change was relatively low .
Thg age distribution of the "movers" was consistent with our earlier questionnaire data; by and large, those people with awareness, readiness, and
9
energy for change were the relatively younger supervisors . We were
fortunate that a few of the movers were from the "old guard" and were seen as relatively high influence people by ourselves and others in the system.
The objective of influencing the system's readiness was also achieved in a limited way. As a result of Lhe interview process, some of the older
group became interested in the OD program. Some came to see how tliey, in fact, might je behaving disloyally by not helping lhe system to improve
-the very system which had been "so good to them" foe all those years. On the "cost" dimension, others realized that their closeness to retirement, in fact, put them in a safer position than some others to raise some sticky issues. The respect they had developed over many years of experience could lead others
-10-to respect and be influenced by their inputs and actions.
An increased level of readiness was further demonstrated by the fact that, after the interviews, several people took the initiative for beginning to work on some problems. Thly acted on th^ir own responses to the interview question: "What could you /ourself do to improve this situation?" While nut universally successful in terms of impact, these events served to introduce and legitimize a norm of experimentation and risk-taking, a major step toward reducing the perceived "costs" of change.
Implications - Data Feedback Strategy
While the interviews did serve to increase the readiness for change among some persons, the general levels of expressed dissatisfaction with the status quo and images of a more desirable alternative were still low. These two issues would need further attention before much real movement could be expected with respect to taking practical first steps toward change. Based on the insights gained during the interview process, a modified version of Alder fer's two step peer group
—
intergroup model was .'dopted.Small (10-12) person heterogeneous peer groups were formed . To
maximize openness of discussion, no superior-subordinate pairs were included in any group. The membership of each group was, hov,ever, specifically structured to include a few of the potential movers identified during the interviews. Particularly important in this regard were the older potential movers whose inputs and reactions in these mixed group meetings would, we
-11-The specific focus of these first step meetings was around increasing the dissatisfaction with the status quo and developing images of more desired states. Each person received a summary of all of the major thenes reflected
:'.n the HOEH data. The strategy thenwas to get the entire group to brain-storm around two issues:
l.What forces might conceivably contribute to a particular situation reflected in the data? For example, what kinds of policies, procedures, behaviors could you imagine which might lead a person to feel this way? 2. What might the consequences be. if_ a person, in fact, felt this way? The relative safety of the mixed peer groups and the hypothetical situation focus of the questions served to bring many others out-of-the-woodwork and increase the energy which could be mobilized for change.
This increased energy for change, along with all the hypothetical issues discussed during the first step peer group meeting became the stimulus
for the next series of OD sasetons. The context for these sessions was the family group - a boss and his immediate subbrdinates who constituted a formal (in the organization chart sense) work group. It was within these groups that the issue of practical first steps (variable "d" in the change formula) was addressed.
^ach family group focused upon three questions with respect to the data feedback summaries:
1) What steps could we take by ourselves to handle issues unique to our group ?
2) What steps require the involvement of and coordination of other groups?
-12-Following the linking pin notion, these latter issues vtere carried by a given boss into a subsequent higher-level family group meeting where he was a subordinate (a member) and not the head.
Conclusions
From our discussion of this experience, it is obvious that we were not involved in an experiment involving rigorously controlled conditions. It was rather a specific case in which we found it useful to experiment with new forms of the action-research model which many consultants tend to use
repeatedly with relatively little questioning or variation. We were attempting to improve both the predictability and the impact of our consulting interventions through very conscious use of the latest data base (a) in planning the next step in the process, and(b) as a concrete input to the client system, so that sharing the current data often became the next step.
Our experience here and that of other consultants makes it clear that we need to be more explicit in describing the bases on which we make our on-line decisions during the consulting process. We also need to analyze the consequences of these decisions, even if the analysis in some cases must be limited to "subjective" data.
One common assumption in organizational consulting is that it helps to deal with a system "where they are at" rather than to plan activities that are beyond their present level of development or commitment to change.
-13-questionnaire response by different age groups were the signals that triggered this awareness. Prefessional consultants need to be clearer about what
dimensions they use to assess this readiness. The "readiness formula"
applied here is one such perspective, especially when combined with demographic traits and their associated differences.
Another issue which we encountered but did not discuss here was the difference between our definition of "change work activities" and the clients' definition. For example, we saw the follow-up interview process as an energy-stimulating (or consciousness-raising) intervention which could promote change ,
while most of the clients just thought of it as preliminaries or preparation for doing the "real" work of planning new systems, changing structures, solving problems. We found that we had to repeatedly deal with this issue and share our ideas on how a step fit into the overall goals and process of the progoam .
Finally, our data here may well be generalizable to other types of
organizations, cultures, etc. that tend to operate in a traditional, bureaucratic mode. As a large portion of the supervisory force ages together with relatively
low turnover and few younger replacements, the organization will tend to lose the capacity for self-renewal and vitality. Standards of excellence will tend to be oriented toward the past rather than -what is possible in the future. Higher power members will have a relatively high stake in maintaining the status quo, as they usually do, but with the added block to renewal of being a closed system
—
that is, having around them only other people
-14-of the same generation who share the same standards, attitudes, and opinions. In this type of situation, attempts at planned organization development should explicitly recognize this age/attitude structure, and the early phases of the project should emphasize the generation of shared data, recognition of problems, and generation of energy which can be focussed on the change process.
TABLE ONE
Summary of Demographic Characteristics of Total Sample
1. Age of £35 yrs. 36-40 41-45 46-50 51-55 56-60 >60 Respondent N=8 N=9 N=2 N=17 N=26 N=25 N=14 2. Years with 0-10 11-20 21-30 >30 Company N=10 N-17 N=30 N-45 3. Years at 0-10 11-20 21-30 >30 this refinery N=14 N=17 N=27 N=44
4. Level of Grade or Trade
Education High School School College
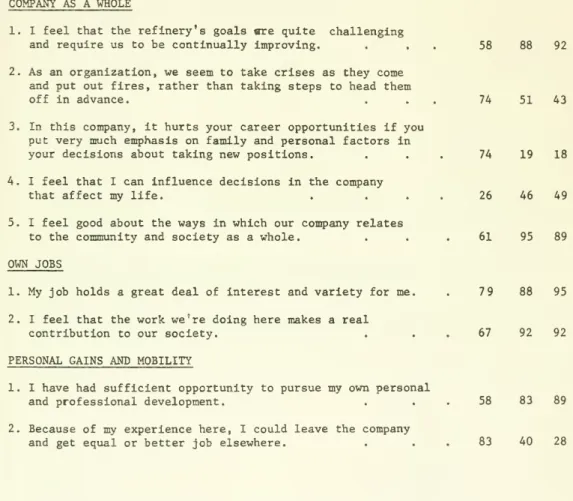
TABLE TWO
DIFFERENCES IN PERCEPTIONS BETWEEN YOUNG (^45 yrs.), MIDDLE
(>46<55
yrs.), AND OLD (£56 yrs.) EMPLOYEESSCALE DESCRIPTION
% ANS. TRUE
A. COMPANY AS A WHOLE
1. I feel that the refinery's goals are quite challenging
and require us to be continually improving. . . . 58 88 92
2. As an organization, we seem to take crises as they come and put out fires, rather than taking steps to head them
off in advance. . . 74 51 43
3. In this company, it hurts your career opportunities if you put very much emphasis on family and personal factors in
your decisions about taking new positions. . . . 74 19 18 4. I feel that I can influence decisions in the company
that affect my life. .
...
26 46 495. I feel good about the ways in which our company relates
to the community and society as a whole. . . . 61 95 89
B. OWN JOBS
1. My job holds a great deal of interest and variety for me. . 79 88 95
2. I feel that the work we're doing here makes a real
contribution to our society. .
..
67 92 92C. PERSONAL GAINS AND MOBILITY
1. I have had sufficient opportunity to pursue my own personal
and professional development. . . . 58 83 89
2. Because of my experience here, I could leave the company
and get equal or better job elsewhere. .
..
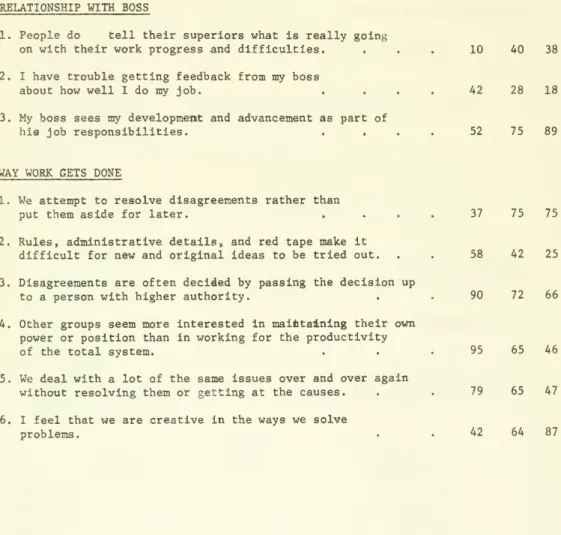
83 40 28TABLE TWO (cont.)
SCALE DESCRIPTION
% ANS. TRUE
Y M
D. RELATIONSHIP WITH BOSS
1. People do tell their superiors what is really going on with their work progress and difficulties.
2. I have trouble getting feedback from my boss about how well I do my job.
3. My boss sees my development and advancement as part of his job responsibilities.
10 40 38
42 28 18
52 75 89
E. WAY WORK GETS DONE
1. We attempt to resolve disagreements rather than
put them aside for later. .
...
37 75 752. Rules, administrative details, and red tape make it
difficult for new and original ideas to be tried out. . . 58 42 25
3. Disagreements are often decided by passing the decision up
to a person with higher authority. . . 90 72 66
4. Other groups seem more interested in maintaining their own power or position than in working for the productivity
of the total system. . . . 95 65 46
5. We deal with a lot of the same issues over and over again
without resolving them or getting at the causes. . . 79 65 47
6. I feel that we are creative in the ways we solve
FOOTNOTES
1. Steele, F.I. , "Consultants and Detectives," Journal of Applied Behavioral
Science , Vol. 5, No. 2, 1969, pp 187-202 .
2. Alderfer, C.P. and Holbrook, J. "A New Design for Survey Feedback," unpublished paper, Department of Administrative Sciences, Yale University, 1973.
3. A Human Organization Effectiveness Review (HOER) was designed to tap peoples' perceptions of the existing state of health of the organization along a variety of dimensions.
4. See Steele, F.I., and Rubin, I.M., "Organizational Aging and the Renewal
Process," in process.
5. Age was selected as the single variable for intensive analysis since ,
as would be predicted, it was very highly correlated with other demographic characteristics.
6. See "Leadership and Organizational Excitement " by D.E. Berlew for more on this topic (in Kolb, Rubin, and Mclntyre, Organizational Psychology A Book of Readings
,
Second Edition, Englewood Clifs, New Jersey :
Prentice - Hall, Inc., 1974, pp 265-277.
7. Beckhard, R., "Strategies for Large System Change," Sloan Management
Review , Winter 1975, Vol. 16, No. 2, pp 43-56.
8. These decisions or choices were not made by the consultants alone.
An internal task force, reflecting a cross-section of the organization, worked closely with the consultants during the entire process. The ability to test hunches and strategies with the "microcosm of the system" was critical.
9. AGE GROUP Young (up to 45) Middle (46-55) 13 (100%)
10. See Alderfer, op. cit.
39 (100%)
Old (over 55)
Likely to be