HAL Id: hal-02649554
https://hal-amu.archives-ouvertes.fr/hal-02649554
Submitted on 8 Oct 2020HAL is a multi-disciplinary open access archive for the deposit and dissemination of sci-entific research documents, whether they are pub-lished or not. The documents may come from teaching and research institutions in France or abroad, or from public or private research centers.
L’archive ouverte pluridisciplinaire HAL, est destinée au dépôt et à la diffusion de documents scientifiques de niveau recherche, publiés ou non, émanant des établissements d’enseignement et de recherche français ou étrangers, des laboratoires publics ou privés.
Environmental Drivers of Microbial Functioning in
Mediterranean Forest Soils
Caroline Brunel, Anne Marie Farnet da Silva, Raphaël Gros
To cite this version:
Caroline Brunel, Anne Marie Farnet da Silva, Raphaël Gros. Environmental Drivers of Microbial Functioning in Mediterranean Forest Soils. Microbial Ecology, Springer Verlag, 2020, 80, pp.669-681. �10.1007/s00248-020-01518-5�. �hal-02649554�
1
Research Paper 1
Title
2
Environmental drivers of microbial functioning in Mediterranean forest soils 3
Authors
4
Caroline Brunel1,2, Anne-Marie Farnet Da Silva1 and Raphael Gros1
5
1 Mediterranean Institute of marine and continental Biodiversity and Ecology, IMBE, Aix
6
Marseille Université, UMR CNRS 7263, IRD, Avignon Université, Campus l’Etoile, Av. 7
Escadrille Normandie Niemen, 13397, Marseille, Cedex 20, France 8
2 IRD, IPME; 911 avenue Agropolis, BP 64501, 34394, Montpellier, France
9
Corresponding Author: Caroline Brunel ([email protected], tel: +33 658 483 326) 10
ORCID IDs:
11
Caroline BRUNEL : 0000-0002-0705-5165 12
Anne-Marie FARNET DA SILVA : 0000-0001-6603-1174 13
Raphael GROS : 0000-0001-6296-0558 14
Abstract
15
Mediterranean forests own distinct characteristics resulting from climate, soil, and vegetation that 16
affect soil microbial communities’ assembly and their associated functions. We initiated a multi-17
scalar analysis of environmental drivers of soil functioning to (1) identify pertinent factorial scales 18
and (2) determine the relative importance of soil, vegetation, and geoclimate relative influences in 19
shaping soil microbial functions across the French Mediterranean forests. Soil samples (0-15 cm) 20
were collected from 60 forest sites and soil physico-chemical and microbiological properties were 21
assessed across different factorial scales i.e., bioclimates, slope exposures, and forest stands. 22
Patterns in microbial catabolic potential (i.e., extracellular enzymes and microbial respiration) and 23
carbon (C) source utilisation (i.e., catabolic-level physiological profiling) were partitioned 24
between vegetation cover, soil characteristics and geoclimate components. Our results reveal that 25
the catabolic potential of soil microbes was strongly influenced by the forest stands, and mainly 26
relied on ammonium and nitrate contents. In contrast, variation in C-source utilisation was mainly 27
explained by vegetation cover. Soil metabolic capacities of microorganisms and resulting C 28
dynamics were largely constrained by climate parameters, which suggests potentially important 29
consequences for soil C storage. Our study revealed diverse structuration patterns between the 30
catabolic potential and the carbon-source utilisation of soil microbial communities, and gives 31
insights into the underlying mechanisms of soil microbial functioning in Mediterranean forests. 32
Key words
33
Ecological filters; Mediterranean forest stands; Microbial metabolism; Scale-dependent 34
structuration; Soil microbial communities; Soil physico-chemical properties 35
3
Introduction
37
Studies of the microbial processes involved in the decomposition of soil organic carbon (C) have 38
considerably increased in recent years owing to the major role soil C storage plays in the context 39
of climate change [1]. In the C sink that forest soils represent [2], soil organic C stocks result 40
largely from the balance between (i) inputs of C determined by the vegetation cover, (ii) processes 41
of soil C humification by microbial communities and stabilization and (iii) outputs via soil erosion, 42
CO2 production from roots and microorganisms [3]. Thus, C dynamics in soils depend on complex
43
interactions between climate conditions (e.g. long term mean annual precipitation and temperature) 44
that shape forest structure and tree productivity, soil physico-chemical properties (such as calcium 45
carbonate content and pH) influenced by the geological substratum and their combined effect on 46
soil microbial communities and their metabolism [4]. 47
Microbes are the primary decomposers of plant material due to their unique ability to produce 48
enzymes to break down both simple molecules such as cellulose and more complex plant derived 49
compounds such as lignin [5]. They mobilize and transform a broad range of soil C substrates, 50
assimilating C in their biomass, emitting CO2 or stabilizing C in soil [6]. There is a lot of debate
51
on the potential drivers controlling soil microbiome assembly and the mechanisms maintaining 52
community structure and composition, and we argue that these rules may be better understood if 53
put in perspective (adapted to the needs and contexts). Soil pH, the chemical composition of 54
organic matter (OM), and climate conditions have been pointed out as key driver of soil 55
functioning at local to continental scales [7–11]. In a recent study from different geographical and 56
climatic zones across Europe, variations in bacterial community diversity and structure were 57
mainly driven by parameters corresponding to similar edaphic and climatic properties [12]. 58
Although these findings provide essential information on soil communities structuration at large 59
scale, the results cannot be transferred to more specific contexts. 60
In the Mediterranean context particularly, where forests are subjected to specific constrains such 61
as drought stress, heat waves, low nutrient availability and recalcitrant organic compounds [13] 62
we still lack a clear understanding of factors controlling microbial C metabolism and driving soil 63
C dynamics. Experimental determination of drivers has helped to develop which drivers may be 64
of importance on Mediterranean soils (i.e., soil OM quality and water availability [14, 15]), but a 65
more accurate determination of drivers from measurements done in situ will give greater insight 66
to the mechanisms maintaining microbial communities’ structures and functions in these soils. 67
Determining pertinent spatial scales to observe variation in the functioning of such specific soils 68
is now required to clarify how this ecosystem compartment is driven and to assess microbial 69
functioning and C cycling vulnerability to environmental changes. 70
Here we report on a study designed to (1) determine pertinent factorial scales for unraveling 71
microbial functional patterns and (2) estimate the relative importance of environmental 72
components (vegetation, geoclimate and soil properties) in shaping of soil microbial functioning 73
and (3) identify specific drivers. To disentangle the patterns and drivers of soil microbial 74
functioning in Mediterranean forest soils, we sampled 60 sites covering an area of about 10.000 75
km2 in south-eastern France. We hypothesizedthat soil microbial metabolic capabilities and C 76
substrate affinities varied according to bioclimates at a regional scale, side slope exposure at a 77
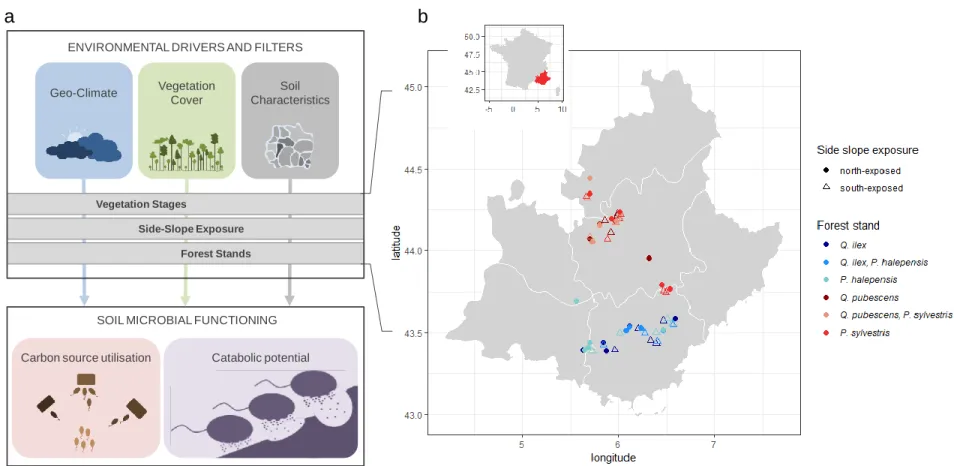
landscape scale and forest stand at a local scale (Fig. 1) due to environmental variations specific 78
to these scales. 79
Methods
5
Study sites and sampling design
81
The sampling was conducted in April 2013 in South-Eastern France (Provence-Alpes-Côte 82
d’Azur), an area characterized by frequent and intense droughts and heat waves typical of the 83
Mediterranean climate. Mean annual temperature and precipitation respectively reach 11.3°C and 84
799mm (from WorldClim [16], Appendix 2, Fig. S1). Soils are characterized by carbonatic 85
pedofeatures (i.e., fine calcareous silt clay loam). We conducted our study in sub-humid and humid 86
bioclimates [17] corresponding to meso-Mediterranean and supra-Mediterranean altitudinal 87
arrangement of vegetation respectively covered with Pinus halepensis and Quercus ilex, and Pinus 88
sylvestris and Quercus pubescens. Three forest stands were selected for each of the two
89
bioclimates, and were a mono-specific stand of Pinus and a mono-specific stand of Quercus, and 90
a mixed stand 60/40% of Pinus/Quercus. All forest stands were about 60 ±10 years-old and were 91
without forest management for 35 years. For each of the six types of forests, five 20mX20m plots 92
were selected on both south- and north-facing slopes. These plots were considered to be true 93
replicates as the distance between them exceeded 2km. All sites were located at altitudes from 500 94
to 900m for meso-Mediterranean and from 900 to 1100m for supra-Mediterranean bioclimates. 95
Plots were first randomly localized by crossing information from the French Geological Survey 96
(for pedofeature), the Forest Property Regional Center (for forest stands informations) and the 97
National Institute of Geography (for altitude and exposition). The sixty forest plots were visited 98
for cross-validation and were then integrated to the survey (Fig. 1b). 99
Within each plot, bulk soil samples were collected after removing the litter layer and 100
digging ten small pits over an approximately 20 cm × 20 cm area (the depth was ranging between 101
10 and 15 cm and was defined by the A horizon limits). The ten sub-samples where sieved (2 mm), 102
pooled and mixed to form a composite sample and placed into a polyethylene bag. In the lab, one 103
aliquot of each composite sample was stored at 4°C for microbial analyses. A second aliquot was 104
air dried in a warm room (48 hours at 30 degrees) for chemical analyses. 105
Soil chemical characteristics
106
Soil water holding capacity (WHC) was determined by the amount of water held in the soil 107
sample vs. the dry weight of the sample. Soil C and N content were measured using a C/N 108
elementary analyzer (Flash EA 1112 ThermoScientific series, Waltham, Massachusetts, USA). 109
Determination of CaCO3 in 10 g soils (dry weight equivalent) was based on the release of CO2
110
after addition of HCl 4N [18]. The percentage of inorganic C (C in CaCO3)was calculated as
111
follows: %C-CaCO3 = 11.991 / 100 x %CaCO3. Organic C was calculated as the difference
112
between total C and inorganic C contents. Soil pH was determined in distilled water (5 g dry weight 113
in 12.5 mL) after a 45 min equilibration [19]. A subsample of 10 g (dry weight equivalent) was 114
analyzed after extraction in 100 ml of 1 M KCl with electrodes to determine inorganic NH4+ and
115
NO3- concentration in soils (expressed per gram of dried soil).
116
Soils C biochemical forms were characterized with solid-state 13C-NMR spectroscopy 117
using cross-polarization and magic angle spinning (CP-MAS). Spectra were obtained on a Bruker 118
Avance 400MHz NMR spectrometer (Rheinstetten, Germany) at a 13C resonance frequency of 106 119
MHz and a Bruker double-bearing probe (further detailed in Appendix 1). The relative distribution 120
of C groups with different structures was determined by integrating the signal intensities over 121
defined chemical shift windows using Dmfit software [20]. Spectra were divided into four 122
chemical regions (Mathers et al., 2003): alkyl C (0-45 ppm), O-alkyl C (45-112 ppm), aromatic C 123
(112-160 ppm) and carbonyl C (160-185 ppm). To describe OM quality, the following ratios of 124
7
humification (HR1 and HR2) and aromaticity (AR) were calculated [21]: HR1=alkyl C/ carboxyl C
125
; HR2= alkyl C/ O-alkyl C ; AR= aromatic C/(alkyl C+ O-alkyl C+ aromatic C)
126
Soil microbial functioning
127
A full description of the methods used for microbial analyses is provided in the Appendix 128
1. Briefly, the determination of C source utilisation (i.e., catabolic-level physiological profiling, 129
CLPP) was performed using BIOLOG® Eco plate (BIOLOG Inc., Hayward, CA). Plates with an 130
average well colour development (AWCD) of 0.4 were used in the statistical calculations. Shannon 131
index and the mean growth on carbohydrates, carboxylic and ketonic acids, amines/amides, 132
polymers and amino-acids substrates were then determined. Microbial biomass (MB) was 133
estimated using Substrate-Induced Respiration (SIR). Ten grams (dry weight equivalent) of 134
standardized samples at 60% of WHC were placed in 117 ml flushed-air glass jars and amended 135
with a powder of talc and glucose (1000 µg C g-1 soil). After ninety minutes, 1 ml of air was 136
sampled with a syringe and injected into a gas chromatograph (Chrompack CHROM 3 – CP 9001, 137
Middelburg, The Netherlands) to determine CO2 production. The gas chromatograph was equipped
138
with a thermal conductivity detector and a packed column (Porapack). The carrier gas helium flow 139
was regulated at 60 ml h− 1. The CO2 concentration of flushed air was subtracted from the CO2
140
concentration of each sample and resulting values were adjusted to 22°C according to Ideal Gas 141
Laws using Q10 = 2. Substrate-induced respiration rates were converted into MB using equations 142
given by [22]. Basal respiration was determined without adding glucose and talc powder and was 143
estimated to calculate the metabolic quotient qCO2 (the ratio of basal respiration to microbial
144
biomass), which is a sensitive ecophysiological indicator of soil stress induced by environmental 145
conditions [23]. The activity of five extracellular enzymes (EEA) involved in soil C and N cycles 146
were assessed (n=3) for each soil sample to determine the catabolic potential of microbial 147
communities. Tyrosinase activity was assessed according to the modified method of Saiya-Cork 148
et al. [24]. Two ml of 25 mM L-DOPA solution (L-3,4-dihydroxyphenylalanine) in potassium 149
phosphate buffer (50 mM, pH 6.5) were added to 0.4 g of soil (fresh weight), mixed and incubated 150
for 30 min, in darkness at 25°C. The mixture was centrifuged for 3 minutes at 12 000 g before 151
absorption was measured at 590 nm. Transesterase activity of lipase was assessed according to the 152
method of Goujard et al. [25]. Two ml of distilled water and 4 ml of 10 mM p-nitrophényl-153
caprylate in heptane were added to 1 g of soil (fresh weight) and incubated for 12 h at 30 °C. The 154
reaction was stopped and colour revealed by adding 200µL of the mixture to 4 mL of 0.1 M NaOH, 155
which was immediately centrifuged for 2 min at 12 000 g. The amount of p-nitrophenol released 156
was measured at 412 nm. Cellulase activity was assayed using CarboxyMethylCellulose (CMC) 157
1% in 2 mL of sodium acetate buffer (50 mM, pH 6) added to 0.5g of soil (fresh weight) incubated 158
for 4h at 50°C. Glucose was quantified according to the Somogyi-Nelson method [26] and 159
absorption was read at 870 nm [27]. Protease activity was measured using 5 g of soil (fresh weight) 160
in 5 mL of casein at 2% in Tris HCl buffer (50mM, pH 8.1). The mixture was incubated for 3 hours 161
at 50°C and then the reaction was stopped with 5 mL of Trichloroacetic acid solution (at 15%) and 162
the mixture centrifuged (2min, 12 000g). Aromatic amino acids were detected using Folin reagent 163
(33%) at 700nm. Tyrosine was used as standard. Urease activity was assessed using 0.5g of soil 164
(fresh weight) in 2mL of urea solution (80mM) in a sodium acetate buffer (50mM, pH 6). The 165
mixture was incubated for 2h at 37°C and then centrifuged (2min, 12 000g). Ammonium was 166
revealed in microplates using an adapted Mulvaney method (1996) [28]: to 30µL of the supernatant 167
were added 15µL of EDTA solution, 60µL of Na-salicylate solution and 30µL of hypochlorite 168
solution. After stabilization (45 min), mixture absorption was measured at 667 nm. Enzyme 169
activities were expressed as µmoles of reaction products released per minute (U) per gram of dry 170
9
soil (U.g-1DS). Another 10 g of soil was incubated for 30 days at 25 °C and maintained at initial 171
moisture and the selective electrodes (Fisher BioBlock Scientific, Hampton, United-States) were 172
used to determine net ammonification and nitrification rates. Ammonification and nitrification 173
rates are here defined as the difference in concentrations of ammonium and nitrate respectively 174
before and after incubation. 175
Geoclimate and vegetation variables
176
Mediterranean forests grow on a wide variety of sites defined by different geoclimatic 177
properties that include climate (e.g., precipitation and temperatures) and physiographic 178
characteristics (e.g., slope, distance to the sea, and elevation), here referred as geoclimate. Climatic 179
data were collected from the WorldClim BioClim dataset (0.93km x 0.93km). The 19 collected 180
variables (listed in supplementary Methods, Appendix 1, Table S1) represent temperature and 181
precipitation annual trends, seasonality, and extreme or limiting environmental factors and results 182
from interpolations of observed data representative of 1950-2000 [16]. Geographic data (Altitude, 183
Exposure, Slope, Distance to the sea, Latitude and Longitude) were obtained from the National 184
Institute of Geography BD ALTI® database (1mx1m). Values were extracted from each site 185
locations using QGIS software (QGIS Development Team, 2.8 ‘Wien’ 2015). 186
Vegetation cover surveys were based on species identification and overlapped among the 187
different layers that were further analysed using an abundance community matrix (Braun-Blanquet 188
approach [29]. The species composition was determined at each site for tree, shrub and herb 189
layers. Vegetation measurements included the plant species richness, the angiosperm and 190
gymnosperm abundances and their relative abundance, the vegetation evenness, the Shannon 191
diversity indexes of the whole community, and of the herb, shrub and non-tree layers. 192
Statistical analyses
193
The different variables and matrix considered were summarized in Table S1 (Appendix 1). 194
Two sets of microbiological data were obtained, and were a matrix of the catabolic potential based 195
on the EEA and SIR analyses and a matrix of C source utilisation based on CLPP. Three 196
environmental datasets (i.e., soil, geoclimate [hereafter geoclimate variables] and vegetation were 197
constituted respectively from 12 soil variables, 25 geoclimate variables, and from the vegetation 198
cover. Dissimilarity matrix were calculated based on Euclidian distances for geoclimate, soil, 199
CLPP and EEA datasets and Manhattan distance for the vegetation cover. 200
Permutational analysis of variance (PERMANOVA), implemented in the ‘adonis’ function 201
(‘vegan’ package [30]), were used to test for significant effects of the factorial scales and their 202
interaction on the environmental components (distance matrixes). 203
The effects of factorial scales and their interaction on each microbial and soil variable were 204
also addressed using analysis of variance (ANOVA) on linear models. Shapiro and Levene tests 205
were respectively used to assess the normality and equality of variances. Variables that did not fit 206
linear model requirements were transformed using the ‘bestNormalize’ function (‘bestNormalize’ 207
package, Peterson, 2018). Used transformations are listed in the Table S1 (Appendix 1). 208
Variation partitioning was completed to rank the influence of environmental components 209
on microbial functioning, their variations were examined as follows. First, non-metric 210
multidimensional scaling (NMDS), which were best designed to represent the ordering 211
relationships among objects in a small and specified number of axes [31], were used for variable 212
reduction [33] of each distance matrixes and the 5 first axis were subsequently used. Then, 213
variations in microbial functioning were partitioned into the pure effects of geo-climatic, soil and 214
11
vegetation components (i.e., variation of the model explained independently by each factor) and 215
into their interactions (i.e., variation of the model explained simultaneously by two or three factors) 216
using constrained and un-constrained distance-based redundancy analysis (db-RDA, function 217
‘varpart’, vegan package [30]). The significance of the testable fractions was determined by 218
ANOVA of the partial db-RDA test using 999 permutations and results were represented by Venn 219
diagrams. 220
Unconstrained RDA were then performed on models that considered a subset of the 221
environmental variables. We first reduced the number of explanatory variables based on a variance 222
inflation factor (VIF) analysis to account for multicollinearity among covariates [34]. Variance 223
inflation factor values were calculated for a full model then for a reduced model obtained by 224
sequentially deleting each variable for which the VIF was the highest until all remaining VIFs 225
were below 2 [35]. Significance of covariates was tested by ANOVA using 999 permutations. 226
Finally, we observed relationships linking microbial variables to environmental variables 227
by determining the Spearman correlation coefficient (rho). 228
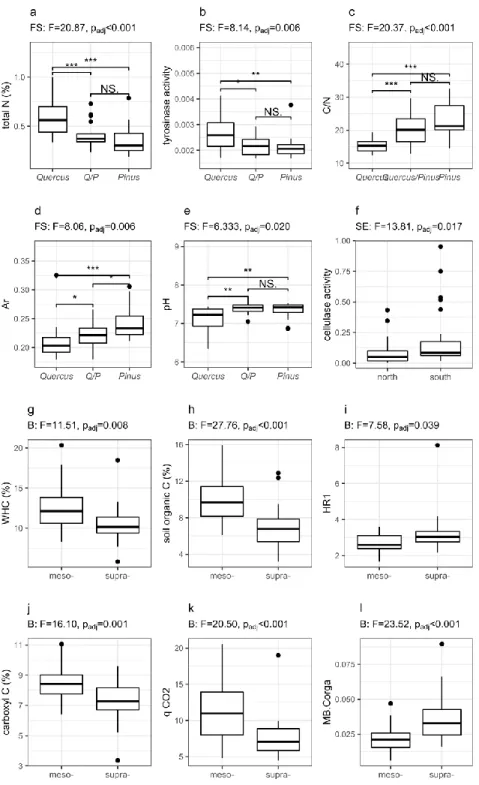
All statistical analyses were performed using R version 3.5.0. To account for multiple 229
comparisons Benjamini and Hochberg false discovery rate corrections were applied when 230
required [36]. 231
Results
232
Relevance of bioclimate, slope exposure and forest stand in shaping soil functioning patterns
233
First, PERMANOVA were performed to test the effects of the different factorial scales and their 234
interaction on both the microbiological and environmental components (Fig. 2 and Table S1 in 235
Appendix 2). Bioclimates explained a low but significant part of variation in both C source 236
utilisation (F=2.28, r2=0.04, p=0.006) and in catabolic potential (F=4.15, r2=0.06, p=0.005).
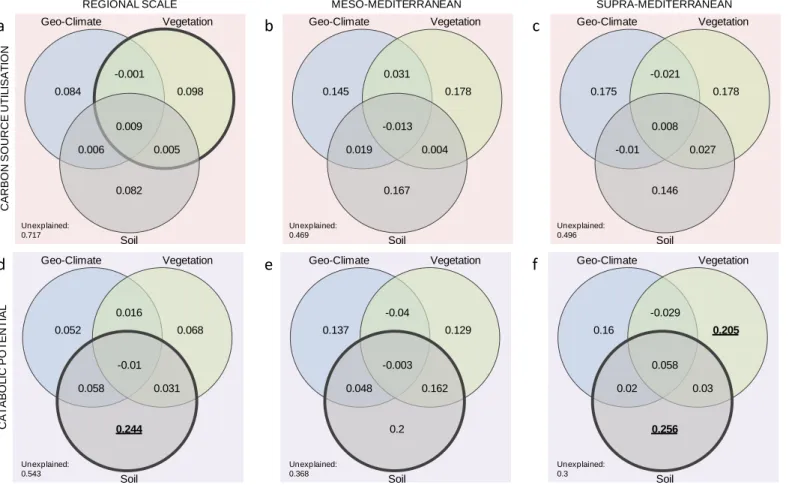
237
PERMANOVA also revealed modification in enzymatic rates induced by forest stands (F=2.503, 238
r2=0.08, p=0.011). As expected, variation in geoclimate and vegetation cover were well described 239
both across bioclimates (F=124.88, r2=0.66, p=0.001 and F=42.831, r2=0.37, p=0.001, 240
respectively) and the interaction between bioclimate and forest stands (F=3.75, r2=0.19, p=0.020 241
and F=4.11, r2=0.07, p=0.001, respectively). Both bioclimate and forest stand defined pertinent
242
scales that could be used to disentangle variations in soil microbial functioning. Bioclimate was 243
the main factor driving microbial functioning. In contrast, variation due to slope exposure was 244
imperceptible on soil, vegetation cover or microbial patterns. It is worth mentioning here that we 245
observed differences in both mean annual temperatures and annual precipitation between north- 246
and south-exposed sites in both meso- and supra-Mediterranean contexts (Appendix 2, Fig. S1), 247
but did not capture the expected lower temperatures on north-facing slopes in the supra-248
Mediterranean context. Additionally, PERMANOVA revealed that soil properties were not 249
structured through any of the considered scales, suggesting that soil physico-chemical 250
characteristics were likely to be driven at larger or smaller scales. 251
Bioclimates had a substantial effect on both soil physico-chemical and microbial characteristics 252
(Fig. 3 and Table S2 in Appendix 2). Total N (F=21.893, padj<0.001) and organic C content
253
(F=27.761, padj<0.001, Fig. 3h) indicated a greater quantity of OM in soils from meso- than from
254
supra-Mediterranean forests together with a higher water holding capacity of the soils (F=11.513, 255
padj=0.008, Fig. 3g). On the other hand, certain characteristics of soil linked with the inorganic
256
fraction, such as calcium carbonate and pH, did not vary between bioclimates. No differences in 257
OM aromaticity (AR) were observed between the two bioclimates, while a higher amount of 258
13
organic acids with long alkyl-chains (HR1, F=8.725, padj=0.0019, Fig. 3i) was found in
supra-259
Mediterranean forest soils. This suggested a higher humification rate associated with production 260
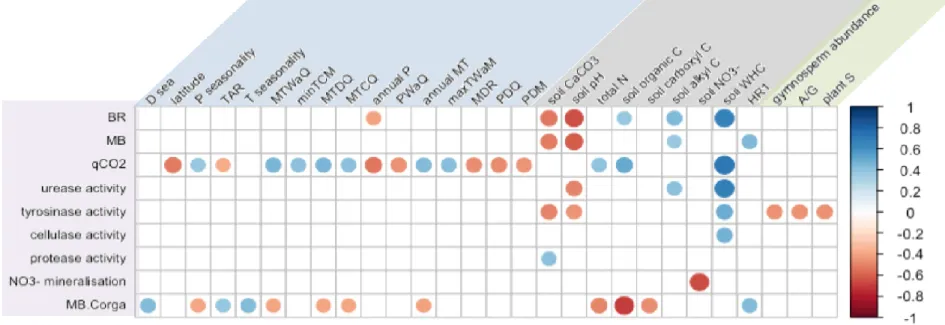
of organic acids with short-alkyl chains (F=16.104, padj=0.001, Fig. 3j) in meso-Mediterranean
261
soils. 262
None of the enzyme potential or C source preferences was differently expressed between the two 263
bioclimates although the H’ index calculated from CLPP indicated slightly but not significantly 264
higher functional diversity in meso-Mediterranean soils (F=5.160, p=0.028, padj=ns). Relating
265
microbial-C to organic-C underlined a higher biomass content per unit of OM in supra-266
Mediterranean soils (F=23.517, padj<0.001, Fig. 3l). The catabolic quotient qCO2 was also higher
267
in the meso-Mediterranean context (F=20.499, padj<0.001, Fig. 3k).
268
Both slope exposure and forest stand had substantial influences on microbial parameters and soil 269
characteristics. Cellulase activity was higher on south-facing slopes (F=14.132, padj=0.011, Fig.
270
3f), where we observed slightly higher carboxyl C and WHC (respectively, F=7.002, p=0.011, 271
padj=ns and F=5.061, p=0.029, padj=ns). The influence of forest stand was expressed on
272
measurements of OM recalcitrance, i.e N content and C/N ratio, aromatic C and AR ratio, and 273
tyrosinase activity. Total N content was higher in soils of oak than pinewoods and mixed stands 274
(F=20.872, padj=0.006, Fig. 3a), which resulted in the opposite C/N trend (F=20.368, padj<0.001,
275
Fig. 3c). Aromatic content and Ar ratio (F=8.061, padj=0.006, Fig. 3d) were higher in pinewoods
276
(F=9.557, padj=0.004). Pinus forests soils, characterized by lower N and higher pH (F=6.333,
277
padj=0.020, Fig. 3e), were observed together with a weaker tyrosinase activity (F=8.141,
278
padj=0.006, Fig. 3b).
279
Variation partitioning of soil microbial functioning
Because microbial patterns varied between the two bioclimates, variance partitioning analyses
281
were carried out at both regional and sub-regional scales to determine the effects of geoclimate, 282
soil and vegetation on both C source utilisation and catabolic potential patterns (Fig. 4 and Table 283
S3, Appendix 2). 284
Overall explanation by environmental components reached ca. 30% and 45% of the C source 285
utilisation (Fig. 4a) and of catabolic potential respectively (Fig. 4d) at the regional scale, and 286
increased to ca. 50% (Fig.4b, 4c) and 65% (Fig. 4e, 4f) at landscape and local scales respectively. 287
Carbon source utilisation patterns were mainly and significantly influenced by vegetation cover 288
(F=1.352, r2=0.11, p=0.030, Fig. 4a) at the regional scale, but no significant influences of the three 289
components were observed at sub-regional meso- and supra-Mediterranean scales (Fig. 4b, 4c). 290
Soil physico-chemical prints explained a large part of variation in microbial catabolic potential at 291
both regional (shared effect: F=5.111, r2=0.32, p=0.001; pure effect: F=3.929, r2=0.243, p=0.001,
292
Fig. 4d) and sub-regional scales. In meso-Mediterranean forest, variation in catabolic potential was 293
due to the shared effect of soil properties (F=3.288, r2=0.406, p=0.001, Fig. 4e) encompassing 16% 294
of vegetation-soil common explanation. In supra-Mediterranean forests, both soil (shared effect: 295
F=2.747, r2=0.364, p=0.003; pure effect: F=2.376, r2=0.0255, p=0.004, Fig. 4f) and vegetation 296
(pure effect: F=1.902, r2=0.204, p=0.029, Fig. 4f) explained variation in catabolic potential.
297
Driving forces of soil microbial functioning
298
To disentangle effects of specific drivers amongst the edaphic, geoclimate and vegetation 299
components, we tested the influence of the main environmental covariates on soil microbiological 300
patterns. Collinear factors were first removed sequentially based on their VIF scores. Remaining 301
covariates included site exposition, slope, longitude, mean temperature of the wettest quarter, 302
15
CaCO3, total N, carboxyl C, O-alkyl C, nitrate, ammonium, bulk density, and vegetation richness
303
(Table S4, Appendix 2). Only edaphic parameters stand out as driving forces of microbial 304
functioning patterns. Carbon source utilisation was related to total N content at regional scale 305
(F=1.825, p=0.019), and to soil bulk density in supra-Mediterranean forests (F=1.698, p=0.035). 306
Catabolic potential was structured by CaCO3 (F=9.49, p=0.001), total N (F=7.389, p=0.001),
307
nitrate (F=5.320, p=0.002) and ammonium (F=3.157, p=0.009) content at regional scale, and by 308
CaCO3 content (F=5.780, p=0.001) in meso-Mediterranean context.
309
To further describe underlying mechanisms of microbial functioning, we examined relationships 310
linking microbial assemblages to environmental parameters (Fig. 5 and supplementary Fig. 2 in 311
Appendix 2). Carbon source preferences and associated functional diversity index were unrelated 312
to environmental variables. Five edaphic parameters were favoring soil microbial properties: the 313
BR, qCO2, urease, tyrosinase, and cellulase increased with soil WHC; BR, MB and urease activity
314
increased with the soil alkyl C fraction; BR and qCO2 increased with soil organic C content, MB
315
and MB per unit of organic C increased with HR1. Soil pH and CaCO3 both negatively affected
316
BR, MB and tyrosinase activity. The metabolic quotient (qCO2) was particularly sensitive to
317
several climate parameters as it was upregulated by temperature indexes (MTWaQ, min TCM, 318
MTDQ, MTCQ, annual MT, max MTWaM) and downregulated by precipitation indexes (annual 319
P, PWaQ, PDQ and PDM). Interestingly, tyrosinase activity was restrained by gymnosperm total 320
and relative abundances together with plant species richness. Although vegetation has been 321
previously shown to influence overall soil microbial patterns, vegetation diversity indexes were 322
not directly related to any specific microbial markers, suggesting that forest community 323
composition rather that forest community structure plays an important role in microbial 324
functioning. 325
Discussion
326
Multiple scaling of soil microbial functioning
327
Comparison between C utilisation and microbial catabolic potential patterns highlighted 328
different structuration scales (i.e., a strong influence of bioclimates on C source utilization vs. a 329
finer effect of forest stands on catabolic potentials), and testified to scale-dependent variations in 330
microbial functioning. While limitations in the BIOLOG methodology for the characterization of 331
whole communities are well known, CLPP remain a useful tool to detect culturable copiotrophic 332
bacteria living in forest soil [37]. Fungi have broader enzymatic capabilities [38] and potentially 333
greater C use efficiency [39] than bacteria. Shift in the respective functional capabilities of fungi 334
and bacteria could partly explain the observed patterns (Fig. 2d and 2e), with substantial 335
implications relevant to C and N cycling as these taxa own distinct C use efficiencies [40]. 336
Variation in C source utilisation was detected between the two bioclimates considered, and 337
was mainly explained by vegetation cover (Fig. 4). However, C use patterns did not differ between 338
forest stands and no substrate preference has been related with descriptor of vegetation (Fig. 5). 339
This suggested that some plant species associated with bioclimates influenced C-substrate affinity 340
over the dominant tree species considered here. Previous studies in grasslands showed 341
modification in soil microbial communities in response to plant community composition [41, 42] 342
but fewer considered treed ecosystems [43, 44], and to our knowledge, only one considered CLPP 343
profiles. In this study [45], both tree diversity and identity affected CLPP. Tree species and even 344
tree genotypes have been previously shown to influence litter chemistry and to control C and 345
nutrient dynamics [46, 47]. Although not further tested here, it is likely that the observed 346
modifications in CLPP reveal a shift in community composition of copiotrophic bacteria [37], that 347
preferentially consume the labile pool of organic C (e.g., freshly fallen litter) [48]. The main driver 348
17
of C use patterns was the total N content, which has previously been revealed as a driver of 349
microbial functional and taxonomic diversity. For instance, Fierer et al. [10] observed shifts in C 350
use utilisation across N gradients together with bacterial phylogenetic and metagenomic responses. 351
Moreover, in our study, functional diversity decreased with soil pH, which has often been pointed 352
out as an important driver of bacterial diversity [49] and of functional diversity approached via 353
CLPP [50]. 354
Unlike C source utilisation, catabolic potential patterns were shaped by forest stands 355
beyond the influence of bioclimates, and more strongly relied on N-related markers (i.e., nitrate, 356
ammonium and total N content). This is likely because decomposer N-requirements are not 357
completely fulfilled by N plant litter concentration [51]. Nitrogen has to be immobilized by 358
decomposers from their resources until the elements reach a critical threshold that allows N 359
conversion into microbial biomass or production of EEA [52]. Nitrogen content significantly 360
changed across the six forest stands considered in our study with particularly exacerbated 361
differences between oak and pine forests. Such differences in OM quality between these 362
Mediterranean tree species have been previously shown together with significant consequences in 363
the resulting soil organic C stocks [53]. These results together indicate that the functional 364
composition of microbial communities (estimated through the C uses) is shaped at larger scales 365
than their actual catabolic potential, which relies on marker of OM quality defined at the forest 366
stand scale. 367
Differential microbial functioning across bioclimates
368
It is a central principle of biogeography that climate exerts a dominant control over the natural 369
distribution of species [54]. In our study, we revealed that the vegetation stage was not a suitable 370
predictor of soil chemical properties. According to Pons and Quézel (1998) [55], the meso-371
Mediterranean bioclimate corresponds to a warm bioclimate with drought waves, while supra-372
Mediterranean winters are harsher and summer more temperate. In the Mediterranean context, 373
vegetation has acquired morphological traits to face the deficit of water, e.g. slow growth, thick 374
cuticle, allelopathic compounds and low nutrient content [56]. These particular climate conditions, 375
exacerbated in meso-Mediterranean forests, select sclerophyllous vegetal species (such as Quercus 376
ilex, Quercus coccifera etc.) that we expected to detect in soil physico-chemical prints. We did not
377
detect such general pattern. However, a higher carboxyl C contents in meso-Mediterranean soils 378
could relate to a larger sclerophyllous plant community in meso-Mediterranean forests (as 379
carboxyl C reflects the cutin polymer of leaves cuticle [57]). 380
Meso-Mediterranean soils were characterized by higher organic C and WHC. Water 381
holding capacity in soil relies on its OM content [58]. Differences in C content can be driven by 382
higher C inputs (i.e., primary production) and/or by lower microbial mineralization rates. Calcium 383
carbonate content had a strong influence in shaping microbial catabolic potential, even more 384
pronounced in meso-Mediterranean soils. Exchangeable calcium positively correlates with SOC 385
concentration and its resistance to microbial degradation [59]. This is in line with our results that 386
point out higher organic C in meso-Mediterranean soils where the CaCO3 content had higher
387
influence on the microbial catabolic potential. As water molecules prevent the direct approach or 388
sorption of an organic substance to a mineral’s surface [59], lower precipitation in meso-389
Mediterranean forests might have increase an inhibitor effect of CaCO3 on microbial catabolic
390
potential. 391
Slightly higher functional microbial diversity under recalcitrant vegetation and more arid 392
conditions from meso-Mediterranean could suggest a shift of functional communities [60] since 393
19
harsher conditions tend to select resistant and specialist populations corresponding to an 394
oligotrophic lifestyle [61]. Tardy et al. [62] showed that a higher microbial diversity improved the 395
functional stability of microbial communities after heat stresses, which are common in the meso-396
Mediterranean bioclimate. We also found respectively a small and a significant increase in 397
microbial basal respiration and in qCO2 of meso-Mediterranean forest soils that suggests a better
398
potential for mineralization in meso-Mediterranean when water is available (60 % WHC). Thus, 399
in meso-Mediterranean forest soils, when hydric conditions are suitable, the mineralization 400
potential is likely to be high and to lead to CO2 production (for instance in spring and fall), while
401
during summer drought, OM decomposition is probably drastically inhibited. This suggests that 402
the observed higher C contents in the meso-Mediterranean context then result from climate 403
constraints. 404
Detection of variations in microbial functioning at smaller scales
405
We found that soil chemical and microbial characteristics (total N, aromatic C and 406
tyrosinase activity) related to OM recalcitrance varied among forest stands (Fig. 3 a-e). In a 407
previous study, Brunel et al. [53] investigated the effect of relative oak/pine tree composition using 408
the same tree species and bioclimates and determined that relative aromatic content increased 409
linearly with pine abundance. Recalcitrant OM, mainly aromatic compounds, limits microbial 410
growth by toxic effects on microbial cells (for instance on membranes), limiting bioavailability of 411
nutrients, and can also bind to microbial enzymes and inhibit their activities [63, 64]. As soil N is 412
tightly bound to recalcitrant humic acids, a limited availability and/or quantity of N under 413
pinewood is likely to enhance aromatic C accumulation in pine stands [65]. 414
Side slope exposure has previously been reported to affect forest soils directly through its 415
influence on radiation, temperature and moisture [66], and indirectly by affecting vegetation cover 416
and structures [67]. Variations in geoclimate were not perceptible between south- and north facing 417
slopes. This can point out two mutually non-exclusive scenarios: (i) that the used climate data are 418
unsuitable to unravel differences at the slope scale (pixel of 0.86 km2 for the BioClim modeled 419
variables [16]), and/or (ii) that microclimatic variations between sites were consistently larger than 420
the variations caused by differences induced by slope exposure. We detected higher cellulase 421
activities in soils of south-exposed forests, and slight modifications in carboxyl C content. In 422
contrast with our results, differences in vegetation cover between north- and south-facing slopes 423
have been previously reported in Mediterranean areas; overall vegetation cover and species 424
richness were shown to be reduced on north-facing slopes and a greater number of evergreen 425
species have been observed on south slopes [68, 69]. In their study on forest soils, Måren et al [70] 426
showed that, in arid environments, slope aspect is less important in driving soil properties than in 427
moister environments where more microclimatic contrasts are observed. 428
Environmental drivers and their potential implications in the context of climate change
429
While Mediterranean forests have the potential to strongly contribute to global C sink [71], 430
their SOC stocks are known to be lower than other forest types. This pattern is commonly 431
explained by factors such as landuse legacy (abandoned pastures) and fire frequency, and also by 432
the low productivity of Mediterranean tree species [72]. Here we also observed that soil microbial 433
functioning is largely explained by climate parameters. We reported above that C stocks in meso-434
Mediterranean forest soils resulted from climate constraints. Two other observations tend to reveal 435
that soil microbial functioning in Mediterranean forest soils is controlled by climate variation. 436
First, qCO2, which indicates the efficiency by which soil microorganisms use C-resources in soil
21
[73], was strongly associated to climate variation (up-regulated by 6 indexes of temperature and 438
down-regulated by 5 indexes of precipitation). Then, 5 microbial markers (i.e., basal respiration, 439
metabolic quotient, urease, tyrosinase, cellulase activities and ammonium mineralization rate) 440
were strongly related to the water holding capacity, which reflects the water-balance fluctuations 441
in soils. As in the Mediterranean region, average annual temperatures are well above current global 442
warming trends [74], our results suggest that soil microbial functioning and resulting C dynamics 443
will be drastically affected in the coming years. Our results support recent findings of Diamond et 444
al. [75] who reveal that climate change can have a direct impact on the relative abundance and 445
metabolic capacities of microorganisms in Mediterranean soil ecosystems, with potentially 446
important impacts for both soil C storage and gas release. 447
Conclusion
448
The use of a multi-scalar sampling design allowed us to show the prevailing influence of 449
bioclimates and forest stands in controlling soil functioning over slope exposure and provide 450
insights into the underlying mechanisms. Because climate is responsible for vegetation type, which 451
in turn provides different soil C substrates that are metabolized under different conditions (e.g., 452
temperature or moisture), the bioclimate effect per se is hard to disentangle. However, by 453
describing variations associated with the bioclimate in soil properties, climate and vegetation 454
cover, this study provides clues on which facet of the bioclimatic context (i.e., geo-climate, soil or 455
vegetation) are the most structuring. We found that vegetation cover better explained variations in 456
C source utilization, whereas edaphic characteristics better explained variations in catabolic 457
potential of microbial communities. These results, therefore, contribute to a better understanding 458
of the environmental drivers of microbial functioning across the French Mediterranean landscape. 459
Further studies focusing on soil metabarcoding and transcriptomic would be required to shed light 460
on the environmental filters of microbial composition in relation to their expressed metabolism, 461
and on the drivers of bacterial and fungal communities respectively. 462
Acknowledgments
463
The project received funding from the French Environment and Energy Management 464
Agency (ADEME) and Region Provence Alpes Côte d’Azur (France). We thank Florence 465
Ruaudel, Fabio Ziarelli, and Sebastien Milanesio for their technical assistance and are grateful to 466
the Forest Property Regional Center (CRPF) for their contribution, especially to Olivier Martineau 467
for his valuable support in determining the selected sites. 468
23
References
470
1. Bradford MA, Wieder WR, Bonan GB, et al (2016) Managing uncertainty in soil carbon 471
feedbacks to climate change. Nat Clim Change 6:751 472
2. Lal R (2005) Forest soils and carbon sequestration. For Soils Res Theory Real Its Role 473
Technol Sel Ed Pap 10th North Am For Soils Conf Held Saulte Ste Marie Ont Can 20-24 474
July 2003 220:242–258. https://doi.org/10.1016/j.foreco.2005.08.015 475
3. Tian H, Lu C, Yang J, et al (2015) Global patterns and controls of soil organic carbon 476
dynamics as simulated by multiple terrestrial biosphere models: Current status and future 477
directions. Glob Biogeochem Cycles 29:775–792. https://doi.org/10.1002/2014GB005021 478
4. Pan Y, Birdsey RA, Fang J, et al (2011) A Large and Persistent Carbon Sink in the World’s 479
Forests. Science 333:988–993. https://doi.org/10.1126/science.1201609 480
5. Romaní AM, Fischer H, Mille-Lindblom C, Tranvik LJ (2006) Interactions of bacteria and 481
fungi on decomposing litter: differential extracellular enzyme activities. Ecology 87:2559– 482
2569 483
6. Bardgett RD, Freeman C, Ostle NJ (2008) Microbial contributions to climate change 484
through carbon cycle feedbacks. ISME J 2:805–814 485
7. Davidson EA, Janssens IA (2006) Temperature sensitivity of soil carbon decomposition and 486
feedbacks to climate change. Nature 440:165–173 487
8. Rousk J, Baaath E, Brookes PC, et al (2010) Soil bacterial and fungal communities across a 488
pH gradient in an arable soil. ISME J 4:1340–1351 489
9. Rousk J, Brookes PC, Baath E (2009) Contrasting soil pH effects on fungal and bacterial 490
growth suggest functional redundancy in carbon mineralization. Appl Env Microb 75:. 491
https://doi.org/10.1128/AEM.02775-08 492
10. Fierer N, Lauber CL, Ramirez KS, et al (2012) Comparative metagenomic, phylogenetic 493
and physiological analyses of soil microbial communities across nitrogen gradients. ISME J 494
6:1007–1017. https://doi.org/10.1038/ismej.2011.159 495
11. Bonanomi G, Capodilupo M, Incerti G, Mazzoleni S (2014) Nitrogen transfer in litter 496
mixture enhances decomposition rate, temperature sensitivity, and C quality changes. Plant 497
Soil 381:307–321. https://doi.org/10.1007/s11104-014-2119-4 498
12. Plassart P, Prévost-Bouré NC, Uroz S, et al (2019) Soil parameters, land use, and 499
geographical distance drive soil bacterial communities along a European transect. Sci Rep 500
9:1–17. https://doi.org/10.1038/s41598-018-36867-2 501
13. Castaño C, Lindahl BD, Alday JG, et al (2018) Soil microclimate changes affect soil fungal 502
communities in a Mediterranean pine forest. New Phytol 220:1211–1221. 503
https://doi.org/10.1111/nph.15205 504
14. Brunel C, Gros R, Lerch TZ, Da Silva AMF (2020) Changes in soil organic matter and 505
microbial communities after fine and coarse residues inputs from Mediterranean tree 506
species. Appl Soil Ecol 149:103516 507
15. Boukhdoud N, Silva AMFD, Darwish T, Gros R (2017) Olive mill waste and glyphosate-508
based herbicide addition to olive grove soils: effects on microbial activities and their 509
responses to drying–rewetting cycles. Soil Use Manag 33:499–510. 510
https://doi.org/10.1111/sum.12367 511
16. Hijmans RJ, Cameron SE, Parra JL, et al (2005) Very high resolution interpolated climate 512
surfaces for global land areas. Int J Climatol 25:1965–1978. 513
https://doi.org/10.1002/joc.1276 514
17. Medail F, Quezel P (2003) Que faut-il entendre par" forêts méditerranéennes"? XXIV: 515
18. Chaney RC, Slonim SM, Slonim SS (1982) Determination of calcium carbonate content in 516
soils. In: Geotechnical properties, behavior, and performance of calcareous soils. ASTM 517
International, 3-15, https://doi.org/101520/STP28907S 518
19. Aubert G (1978) Méthodes d’analyses des sols. Centre national de documentation 519
pédagogique, Centre régional de documentation pédagogique de Marseille 520
20. Massiot D, Fayon F, Capron M, et al (2002) Modelling one‐and two‐dimensional solid‐state 521
NMR spectra. Magn Reson Chem 40:70–76 522
21. Baldock J, Preston CM (1995) Chemistry of carbon decomposition processes in forests as 523
revealed by solid-state 13C NMR. 89–117, https://doi.org/10.2136/1995.carbonforms.c6 524
22. Beare MH, Neely CL, Coleman DC, Hargrove WL (1990) A substrate-induced respiration 525
(SIR) method for measurement of fungal and bacterial biomass on plant residues. Soil Biol 526
Biochem 22:585–594. http://dx.doi.org/10.1016/0038-0717(90)90002-H 527
23. Anderson T-H (2003) Microbial eco-physiological indicators to asses soil quality. Agric 528
Ecosyst Environ 98:285–293. http://dx.doi.org/10.1016/S0167-8809(03)00088-4 529
24. Saiya-Cork K, Sinsabaugh R, Zak D (2002) The effects of long term nitrogen deposition on 530
extracellular enzyme activity in an Acer saccharum forest soil. Soil Biol Biochem 34:1309– 531
1315 532
25. Goujard L, Villeneuve P, Barea B, et al (2009) A spectrophotometric transesterification-533
based assay for lipases in organic solvent. Anal Biochem 385:161–167 534
26. Ladd J, Butler J (1972) Short-term assays of soil proteolytic enzyme activities using 535
proteins and dipeptide derivatives as substrates. Soil Biol Biochem 4:19–30 536
27. Farnet Da Silva AM, Qasemian L, Guiral D, Ferré E (2010) A modified method based on 537
arsenomolybdate complex to quantify cellulase activities: Application to litters. 538
Pedobiologia 53:159–160. http://dx.doi.org/10.1016/j.pedobi.2009.09.001 539
25
28. Mulvaney DL, America SSS of, Agronomy AS of (1996) Methods of Soil Analysis Part 3: 540
Chemical Methods. Amer Society of Agronomy, Madison, Wis 541
29. Braun-Blanquet J (1932) Plant sociology. The study of plant communities. First ed. Plant 542
Sociol Study Plant Communities First Ed 543
30. Dixon P (2003) VEGAN, a package of R functions for community ecology. J Veg Sci 544
14:927–930. https://doi.org/10.1111/j.1654-1103.2003.tb02228.x 545
31. Peterson RA (2018) bestNormalize: Normalizing Transformation Functions, R package 546
version 1.2. 0 547
32. Borcard D, Gillet F, Legendre P (2018) Unconstrained Ordination. In: Borcard D, Gillet F, 548
Legendre P (eds) Numerical Ecology with R. Springer International Publishing, Cham, pp 549
151–201 550
33. Quinn GP, Keough MJ (2002) Experimental design and data analysis for biologists. 551
Cambridge University Press 552
34. James G, Witten D, Hastie T, Tibshirani R (2013) An introduction to statistical learning. 553
Springer 554
35. Zuur AF, Ieno EN, Elphick CS (2010) A protocol for data exploration to avoid common 555
statistical problems. Methods Ecol Evol 1:3–14 556
36. Benjamini Y, Hochberg Y (1995) Controlling the False Discovery Rate: A Practical and 557
Powerful Approach to Multiple Testing. J R Stat Soc Ser B Methodol 57:289–300 558
37. Lladó S, Baldrian P (2017) Community-level physiological profiling analyses show 559
potential to identify the copiotrophic bacteria present in soil environments. PLOS ONE 560
12:e0171638. https://doi.org/10.1371/journal.pone.0171638 561
38. Waring BG, Averill C, Hawkes CV (2013) Differences in fungal and bacterial physiology 562
alter soil carbon and nitrogen cycling: insights from meta-analysis and theoretical models. 563
Ecol Lett 16:887–894. https://doi.org/10.1111/ele.12125 564
39. Six J, Frey SD, Thiet RK, Batten KM (2006) Bacterial and Fungal Contributions to Carbon 565
Sequestration in Agroecosystems. Soil Sci Soc Am J 70:555–569. 566
https://doi.org/10.2136/sssaj2004.0347 567
40. McGuire KL, Treseder KK (2010) Microbial communities and their relevance for 568
ecosystem models: Decomposition as a case study. Soil Biol Biochem 42:529–535. 569
https://doi.org/10.1016/j.soilbio.2009.11.016 570
41. Bardgett RD, Shine A (1999) Linkages between plant litter diversity, soil microbial 571
biomass and ecosystem function in temperate grasslands. Soil Biol Biochem 31:317–321 572
42. Eisenhauer N, Beßler H, Engels C, et al (2010) Plant diversity effects on soil 573
microorganisms support the singular hypothesis. Ecology 91:485–496. 574
https://doi.org/10.1890/08-2338.1 575
43. Scheibe A, Steffens C, Seven J, et al (2015) Effects of tree identity dominate over tree 576
diversity on the soil microbial community structure. Soil Biol Biochem 81:219–227. 577
https://doi.org/10.1016/j.soilbio.2014.11.020 578
44. Thoms C, Gattinger A, Jacob M, et al (2010) Direct and indirect effects of tree diversity 579
drive soil microbial diversity in temperate deciduous forest. Soil Biol Biochem 42:1558– 580
1565. https://doi.org/10.1016/j.soilbio.2010.05.030 581
45. Khlifa R, Paquette A, Messier C, et al (2017) Do temperate tree species diversity and 582
identity influence soil microbial community function and composition? Ecol Evol 7:7965– 583
7974. https://doi.org/10.1002/ece3.3313 584
46. Chavez-Vergara B, Merino A, Vázquez-Marrufo G, García-Oliva F (2014) Organic matter 585
dynamics and microbial activity during decomposition of forest floor under two native 586
neotropical oak species in a temperate deciduous forest in Mexico. Geoderma 235– 587
236:133–145. https://doi.org/10.1016/j.geoderma.2014.07.005 588
47. Pérez‐ Izquierdo L, Saint‐ André L, Santenoise P, et al (2018) Tree genotype and seasonal 589
effects on soil properties and biogeochemical functioning in Mediterranean pine forests. 590
Eur J Soil Sci 69:1087–1097. https://doi.org/10.1111/ejss.12712 591
48. Fierer N, Bradford MA, Jackson RB (2007) Toward an ecological classification of soil 592
bacteria. Ecology 88:1354–1364 593
49. Lauber CL, Hamady M, Knight R, Fierer N (2009) Pyrosequencing-based assessment of 594
soil pH as a predictor of soil bacterial community structure at the continental scale. Appl 595
Environ Microbiol 75:5111–5120 596
50. Rutgers M, Wouterse M, Drost SM, et al (2016) Monitoring soil bacteria with community-597
level physiological profiles using BiologTM ECO-plates in the Netherlands and Europe. 598
Appl Soil Ecol 97:23–35. https://doi.org/10.1016/j.apsoil.2015.06.007 599
51. Zechmeister-Boltenstern S, Keiblinger KM, Mooshammer M, et al (2015) The application 600
of ecological stoichiometry to plant-microbial-soil organic matter transformations. Ecol 601
Monogr 85:133–155. https://doi.org/10.1890/14-0777.1 602
52. Parton W, Silver WL, Burke IC, et al (2007) Global-Scale Similarities in Nitrogen Release 603
Patterns During Long-Term Decomposition. Science 315:361–364. 604
https://doi.org/10.1126/science.1134853 605
53. Brunel C, Gros R, Ziarelli F, Da Silva AMF (2017) Additive or non-additive effect of 606
mixing oak in pine stands on soil properties depends on the tree species in Mediterranean 607
forests. Sci Total Environ 590:676–685 608
27
54. Pearson RG, Dawson TP (2003) Predicting the impacts of climate change on the 609
distribution of species: are bioclimate envelope models useful? Glob Ecol Biogeogr 610
12:361–371. https://doi.org/10.1046/j.1466-822X.2003.00042.x 611
55. Pons A, Quézel P (1998) À propos de la mise en place du climat méditerranéen. Comptes 612
Rendus Académie Sci - Ser IIA - Earth Planet Sci 327:755–760. 613
http://dx.doi.org/10.1016/S1251-8050(99)80047-0 614
56. Sardans J, Peñuelas J (2013) Plant-soil interactions in Mediterranean forest and shrublands: 615
impacts of climatic change. Plant Soil 365:1–33. https://doi.org/10.1007/s11104-013-1591-616
6 617
57. Bhunia RK, Showman LJ, Jose A, Nikolau BJ (2018) Combined use of cutinase and high-618
resolution mass-spectrometry to query the molecular architecture of cutin. Plant Methods 619
14:117. https://doi.org/10.1186/s13007-018-0384-6 620
58. Lal R (2018) Digging deeper: A holistic perspective of factors affecting soil organic carbon 621
sequestration in agroecosystems. Glob Change Biol 24:3285–3301. 622
https://doi.org/10.1111/gcb.14054 623
59. Rowley MC, Grand S, Verrecchia ÉP (2018) Calcium-mediated stabilisation of soil organic 624
carbon. Biogeochemistry 137:27–49. https://doi.org/10.1007/s10533-017-0410-1 625
60. Yuste JC, Fernandez-Gonzalez AJ, Fernandez-Lopez M, et al (2014) Strong functional 626
stability of soil microbial communities under semiarid Mediterranean conditions and 627
subjected to long-term shifts in baseline precipitation. Soil Biol Biochem 69:223–233 628
61. Paul EA (2014) Soil microbiology, ecology and biochemistry. Academic press 629
62. Tardy V, Mathieu O, Lévêque J, et al (2014) Stability of soil microbial structure and 630
activity depends on microbial diversity. Environ Microbiol Rep 6:173–183 631
63. Chomel M, Guittonny-Larchevêque M, Fernandez C, et al (2016) Plant secondary 632
metabolites: a key driver of litter decomposition and soil nutrient cycling. J Ecol 104:1527-633
1541 634
64. Mutabaruka R, Hairiah K, Cadisch G (2007) Microbial degradation of hydrolysable and 635
condensed tannin polyphenol–protein complexes in soils from different land-use histories. 636
Soil Biol Biochem 39:1479–1492 637
65. Rovira P, Vallejo VR (2002) Labile and recalcitrant pools of carbon and nitrogen in organic 638
matter decomposing at different depths in soil: an acid hydrolysis approach. Geoderma 639
107:109–141. http://dx.doi.org/10.1016/S0016-7061(01)00143-4 640
66. Pook EW, others (1966) The influence of aspect on the composition and structure of dry 641
sclerophyll forest on Black Mountain, Canberra. ACT. Aust J Bot 14:223–242 642
67. Cantlon JE (1953) Vegetation and microclimates on north and south slopes of Cushetunk 643
Mountain, New Jersey. Ecol Monogr 241–270 644
68. Martínez-Murillo JF, Gabarrón-Galeote MA, Ruiz-Sinoga JD (2013) Soil water repellency 645
in Mediterranean rangelands under contrasted climatic, slope and patch conditions in 646
southern Spain. Catena 110:196–206 647
69. Nadal-Romero E, Petrlic K, Verachtert E, et al (2014) Effects of slope angle and aspect on 648
plant cover and species richness in a humid Mediterranean badland. Earth Surf Process 649
Landf 39:1705–1716 650
70. Maaaren IE, Karki S, Prajapati C, et al (2015) Facing north or south: Does slope aspect 651
impact forest stand characteristics and soil properties in a semiarid trans-Himalayan valley? 652
J Arid Environ 121:112–123 653
71. Allard V, Ourcival JM, Rambal S, et al (2008) Seasonal and annual variation of carbon 654
exchange in an evergreen Mediterranean forest in southern France. Glob Change Biol 655
14:714–725. https://doi.org/10.1111/j.1365-2486.2008.01539.x 656
72. Muñoz‐ Rojas M, Jordán A, Zavala LM, et al (2015) Impact of Land Use and Land Cover 657
Changes on Organic Carbon Stocks in Mediterranean Soils (1956–2007). Land Degrad Dev 658
26:168–179. https://doi.org/10.1002/ldr.2194 659
73. Insam H, Haselwandter K (1989) Metabolic quotient of the soil microflora in relation to 660
plant succession. Oecologia 79:174–178. https://doi.org/10.1007/BF00388474 661
74. Vicente Serrano SM, López-Moreno JI, Beguería S, et al (2014) Evidence of increasing 662
drought severity caused by temperature rise in southern Europe, Environ. Res Lett, 663
https://doi.org/10.1088/1748-9326/9/4/044001 664
75. Diamond S, Andeer PF, Li Z, et al (2019) Mediterranean grassland soil C–N compound 665
turnover is dependent on rainfall and depth, and is mediated by genomically divergent 666
microorganisms. Nat Microbiol 4:1356–1367. https://doi.org/10.1038/s41564-019-0449-y 667
29
Figures
668
Fig. 1 | The overview of experimental design; (a) the schematic representation of the study design. The variables assessed and matrix used to describe
669
geoclimate, vegetation cover, soil characteristics, carbon source utilisation and catabolic potential are fully detailed in the supplementary methods 670
(Appendix 1, Table S1) ; (b) Sampling sites map. The colors of the symbols (n=60) refer to the different forest stands: red and blue tones correspond 671
to meso- and supra-Mediterranean bioclimates, respectively; filled and open symbols correspond to north- and south-exposed plots, respectively. 672 673 674 Geo-Climate Vegetation Cover Soil Characteristics
Carbon source utilisation Catabolic potential SOIL MICROBIAL FUNCTIONING ENVIRONMENTAL DRIVERS AND FILTERS
Side-Slope Exposure Vegetation Stages
Forest Stands
Fig. 2 | Nonmetric multi-dimensional scaling (NMDS) of (a) geoclimate, (b) soil, (c) vegetation, (d) carbon source
675
utilisation, and (e) microbial catabolic potential patterns based on Euclidian (a, b, d, e) and Manhattan (c) 676
dissimilarity distances. The colors of the symbols refer to the different forest stands: red and blue tones correspond 677
to meso- and supra-Mediterranean bioclimates, respectively; filled and open symbols correspond to north- and 678
south-exposed plots, respectively. PERMANOVA results of main factors (B for bioclimate, FS for forest stand 679
and SE for slope exposure) are provided above each panel. Interaction effects (all not significant) are provided in 680
Appendix 2, Table S1. 681
31 682
Fig. 3 | Shaping of soil biological and chemical characteristics across the considered factorial scales (B for
683
bioclimate, FS for forest stand and SE for slope exposure). Panel a, b, c, d and e respectively stand for the total 684
N, the microbial tyrosinase activities, the C/N ratio, the aromaticity ratio and pH as affected by forest stands 685
(Q/P stands for mixed Quercus/Pinus stands). Panel f stands for the microbial the slope exposure effect on 686
cellulase activity. Panels g to l respectively stand for the water holding capacity, the soil organic carbon, the 687
HR1 ratio, the Carboxyl C fraction, the microbial metabolic quotient and the microbial biomass per unit of 688
organic C respectively, as affected by the meso- or supra- mediterranmean bioclimates. Only significant effects, 689
i.e., p ≤ 0.05 after Benjamini and Hochberg (1995) post-hoc correction, are shown. 690
33
Fig. 4 | Variation partitioning of soil microbial carbon source utilisation (a, b and c) and catabolic potential (d, e and f) into soil, vegetation and
692
geoclimate components at different spatial scales (a and d at the regional-scale (n=60); b and e at the sub-regional meso-Mediterranean scale (n=30); 693
and c and f at the sub-regional supra-Mediterranean scale (n=30)). Each Venn diagram represents a given biological variation (r²) partitioned into the 694
relative effects of each components or combination of components. Pure and shared effects of the different fractions were analyzed by constrained and 695
un-constrained db-rda tests respectively, and are reported in the Table S3. Significant component are underlined when implying a pure effect and are 696
enclosed by a bold line when implying a whole component. 697 698 a d b e c f Geo-Climate Vegetation Soil Unexplained: 0.717 0.084 0.098 -0.001 0.009 0.006 0.005 0.082 Geo-Climate Vegetation Soil Unexplained: 0.469 0.145 0.178 0.031 -0.013 0.019 0.004 0.167 Geo-Climate Vegetation Soil Unexplained: 0.496 0.175 0.178 -0.021 0.008 -0.01 0.027 0.146 Geo-Climate Vegetation Soil Unexplained: 0.543 0.052 0.068 0.016 -0.01 0.058 0.031 0.244 Geo-Climate Vegetation Soil Unexplained: 0.368 0.137 0.129 -0.04 -0.003 0.048 0.162 0.2 Geo-Climate Vegetation Soil Unexplained: 0.3 0.16 0.205 -0.029 0.058 0.02 0.03 0.256
REGIONAL SCALE MESO-MEDITERRANEAN SUPRA-MEDITERRANEAN
C AT ABO L IC PO T EN T IAL C AR BO N SO U R C E U T IL ISA T IO N
34
Fig. 5 | Heat map of Spearman correlation coefficient (rho) between microbial and environmental variables. The color ramp refers to
699
the Spearman correlation coefficient, blue tones stand for positive relations and red tones for negative relations, and the point size 700
refers to the correlation strength (abs(rho)). Top annotations refer to environmental variables and left annotations to microbial 701
variables (Dsea: distance to the sea; P seasonality: precipitation seasonality; TAR: temperature annual range; T seasonality :
702
temperature seasonality; MTWaQ: maximum temperature of the warmest quarter; minTCM: minimum temperature of the coldest 703
month; MTDQ: mean temperature of the driest quarter ; MTCQ: mean temperature of the coldest quarter; annual P: annual 704
precipitation; PWaQ: precipitation of the warmest quarter; annual MT: annual mean temperature; max TWaM: maximum temperature 705
of the warmest month; MDR: mean diurnal range; PDQ: precipitation of the driest quarter; PDM: precipitation of the driest month; 706
WHC: water holding capacity; HR1: humification ratio 1; A/G: angiosperm to gymnosperm ratio; BR: basal respiration; MB: 707
microbial biomass; qCO2 : metabolic quotient; MB.Corga: microbial biomas per unit of organic carbon). Only variables that show
708
significant correlations are shown, i.e., p ≤ 0.05 after Benjamini and Hochberg (1995) post-hoc correction. 709
710 711
Supplementary Material
Click here to access/download
Supplementary Material