HAL Id: hal-01257697
https://hal.archives-ouvertes.fr/hal-01257697
Submitted on 19 Jan 2016
HAL is a multi-disciplinary open access archive for the deposit and dissemination of sci-entific research documents, whether they are pub-lished or not. The documents may come from teaching and research institutions in France or abroad, or from public or private research centers.
L’archive ouverte pluridisciplinaire HAL, est destinée au dépôt et à la diffusion de documents scientifiques de niveau recherche, publiés ou non, émanant des établissements d’enseignement et de recherche français ou étrangers, des laboratoires publics ou privés.
OIB/seamount recycling as a possible process for
E-MORB genesis
Marc Ulrich, Christophe Hémond, Philippe Nonnotte, Klaus Peter Jochum
To cite this version:
Marc Ulrich, Christophe Hémond, Philippe Nonnotte, Klaus Peter Jochum. OIB/seamount recycling as a possible process for E-MORB genesis. EPJdirectC - Articles, 2012, �10.1029/2012GC004078�. �hal-01257697�
1 2 3 4 5
OIB/seamount recycling as a possible process for E-MORB genesis.
6 7
Marc Ulrich1*, Christophe Hémond1, Philippe Nonnotte1, Klaus Peter Jochum2.
8 9
Domaines Océaniques, IUEM-UMR 6538, Université de Brest, 29280 Plouzané, France. 10
Max-Planck-Institut für Chemie, Postfach 3060, D-55020 Mainz, Germany. 11
12
* present address : ISTerre, OSUG-UMR 5275, Université Joseph Fourier, 38000 Grenoble, 13 France 14 15 16 17
18
ABSTRACT 19
20
This paper deals with the origin of enriched MORB independent from any hotspot 21
activity. Indeed, MORB enrichment was readily attributed to a ridge/hotspot interaction and 22
in absence of identified neighboring hotspot, to more questionable processes (e.g. incipient 23
plume or plume activity residue). More recently, the existence of enriched MORB away from
24
any identifiable hotspot was attributed to different origins (i.e. recycled oceanic crust and/or 25
enriched mantle after subduction metasomatism). Within this frame, we present here a new 26
set of geochemical analyses of major and trace elements and Sr, Nd and Pb isotopes on 27
samples collected by submersible on both intersections of the 15°20’N fracture zone with the 28
spreading axis of the Mid-Atlantic Ridge. This area is characterized by an increasing 29
enrichment of the lava compositions from north to south through the fracture zone. Results 30
show that the geochemical enrichment observed with a different intensity on both sides of the 31
fracture zone is linked to the 14°N topographic and geochemical anomaly. Our modeling 32
shows that both trace element and isotopic compositions are consistent with a binary mixing 33
between the regional depleted MORB mantle source and a recycled OIB/seamount, as 34
previously proposed to explain the observed enrichment at 14°N [Hémond et al., 2006]. This 35
model can also account for other enriched MORB i.e. the 18°-20°S region of the Central 36
Indian Ridge, illustrating that it does not represent an isolated and local process. On the basis 37
of our results and on the DMM isotopic evolution, the age of the recycled OIB/seamount is 38
estimated to be ~250 Ma, suggesting a recycling within the upper mantle. Considering the 39
huge number of ocean islands and seamounts upon the ocean floor, their recycling into the 40
upper mantle is a plausible process to produce enriched MORB. 41
1. INTRODUCTION 43
44
Over the last 3 decades, the increasing number of oceanographic expeditions together 45
with the development of analytical techniques and the understanding of the mantle-derived 46
basalt composition have allowed us to evaluate the chemical structure of the Earth. In 47
particular, the numerous studies made on mid-ocean ridges basalts (MORB) have led to a 48
classification in groups mainly based on trace element enrichment. Historically, the most 49
abundant ones are depleted and were named “normal” MORB (N-MORB). Compared to 50
basalts from other tectonic environments, N-MORB are characterized by low abundances in 51
incompatible elements, low radiogenic Sr and Pb and high radiogenic Nd (and Hf) isotope 52
ratios [e.g. Hofmann, 1997]. Conversely, enriched MORB [E-MORB; Sun et al., 1979; 53
Schilling et al., 1985] retains their tholeiitic composition but are characterized by more 54
elevated incompatible trace element abundances, trace clement ratios and more radiogenic 55
compositions in Sr and Pb isotopes than N-MORB [Saunders et al., 1988]. E-MORBs have 56
long been considered as a rare expression of MORB, but numerous spreading ridge 57
investigations have demonstrated that MORB enrichment does not represent isolated 58
anomalies [Macdougall and Lugmair, 1986; Zindler and Hart, 1986; Leroex et al., 1992; 59
Cousens et al., 1995; Castillo et al., 1998; Niu et al., 1999]. Therefore, these observations 60
highlight the nature and heterogeneity of the upper mantle beneath mid-ocean ridges. 61
Although the existence of E-MORB has been known for a long time [Schilling et al., 62
1985], their origin proves difficult to determine within the binary model of enriched hot spot 63
mantle versus depleted MORB upper mantle. Although some E-MORBs are easily explained 64
by hotspot activity in the vicinity [Schilling, 1973; Schilling et al., 1985], the origin of 65
numerous E-MORB found far away from any obvious plume still remains enigmatic. Along 66
the Mid-Atlantic Ridge, several examples of hotspot-unrelated E-MORB have been described, 67
among others at 23°N [Donnelly et al., 2004], 14°N [Bougault et al., 1988; Staudacher et al., 68
1989; Dosso et al., 1991, 1993; Bonatti et al., 1992; Hémond et al., 2006], or 33°S [Michael et 69
al., 1994]. To explain such enrichment, most of the authors have brought up the presence of 70
an enriched component drowned in the "normal" depleted MORB mantle source (DMM), and 71
several possible origins were proposed: old oceanic crust or sediments [Staudacher et al., 72
1989], an embryonic mantle plume associated with the triple plate junction [Bougault et al. 73
1988; Dosso et al., 1991], relics of subcontinental mantle [Bonatti et al., 1992], or an 74
unidentified passively embedded chemical heterogeneity in the mantle [Michael et al., 1994]. 75
Nevertheless, none of these have obtained unanimous agreement to explain hotspot-unrelated 76
E-MORB genesis. To account for the origin of E-MORB along the Mid-Atlantic Ridge, 77
Agranier et al. [2005] suggested the dispersion of the "South Hemisphere anomalous mantle" 78
[i.e. the DUPAL anomaly, Dupré and Allègre, 1983; Hart, 1984]. Donnelly et al. [2004] 79
explained that the enrichment observed in one basalt from the Mid-Atlantic Ridge near Kane 80
fracture zone (23°N MARK area) could result from the presence beneath the ridge of a 81
peridotite previously metasomatised by crust-derived enriched melts during subduction. 82
Finally, using trace element concentrations, Hémond et al. [2006] justified the presence of E-83
MORB at 14°N by recycling beneath oceanic ridges of previously subducted alkali basalts. 84
In this paper, we present a study of samples recovered on both northern and southern 85
sides of the 15°20’N fracture zone (FZ) during the cruise MODE 98 (R/V Yokosuka, 1998). 86
These samples gave us the opportunity to better constrain the extent of the topographic and 87
geochemical anomaly described at 14°N by Dosso et al. [1991,1993], Bonatti et al. [1992], 88
and Hémond et al. [2006]. By using binary mixing modeling on new trace element and 89
radiogenic isotope (Sr, Nd and Pb) analyzes, this study shows the plausible implication of 90
recycled OIB-type material to the formation of E-MORB not only at 14°N, but also at a 91
global scale. 92
93
2. GEOLOGICAL BACKGROUND 94
95
The 15°20’N FZ is one of the largest transform faults of the Mid-Atlantic ridge (Fig. 1). 96
The offset is of about 200 km, and the fracture zone 4500 m deep in average. The dextral 97
movement is estimated to 3 cm.yr-1 [Charlou et al., 1991; Castillo et al., 1998]. This region is
98
characterized by the presence of enriched MORB [Dosso et al., 1991; Bonatti et al., 1992; 99
Dosso et al., 1993; Hémond et al., 2006] and large but discontinuous ultramafic rock outcrops 100
[Cannat et al., 1997]. These outcrops are not limited to ridge/fracture intersection but extend 101
from 25 km to 35 km on each ridge flank. 102
The northern segment of the 15°20’N FZ is a complex area with numerous fractures and 103
discrepancies. This segment globally shows slow spreading ridge characteristics, such as a 104
deep axial valley ranging in depth from 3900 m to 4700 m at the intersection with the fracture 105
zone. The ridge flanks are markedly asymmetrical [Cannat et al., 1997]. Ultramafic rocks 106
outcroping north of the 15°20’N FZ are serpentinized peridotites. They have extremely 107
depleted harzburgite-like compositions and represent a high partial melting degree mantle 108
residue [Cannat et al., 1992]. Peridotitic rocks are covered with a thin basaltic layer (< 100 m) 109
locally missing. Basalts crop out in the ridge axis as pillow lavas, tubes or breccia and present 110
fresh glass rims, which are covered by a thin sedimentary layer (< 10 cm). This attests a fairly 111
recent volcanic activity [Cannat et al., 1997]. 112
South of the 15°20’N FZ, harzburgites tectonically crop out in the internal ridge flanks. 113
Basalts are also erupted along the ridge axis, but no sediments are observed, suggesting a 114
higher magmatic activity compared to the northern segment. They are crosscut by decimeter 115
to meter large fissures revealing recent extensive tectonic activity [Cannat et al., 1997]. The 116
entire segment south of the 15°20’N FZ is characterized by a high topographic bulge centered 117
at 14°N [Dosso et al., 1993]. 118
In summary, basalts are located near the center of the ridge and seem to result from 119
recent eruptions whereas peridotites and gabbros are exposed on the ridge flanks by a 120
conjugate fault set. Uneven topography is attributed to peridotitic massif uplift across the 121
oceanic crust, associated with intrusive gabbroic bodies, suggesting highly heterogenous 122
lithosphere, both compositionally and mechanically, near the 15°20’N FZ [< 60 km, Escartin 123
and Cannat, 1999]. Away from the fracture zone, the crust is thicker, associated with axis 124
parallel faults and abyssal hills. No peridotite has been dredged, which is consistent with a 125
more homogenous and magmatic crust [Escartin and Cannat, 1999]. 126
Samples were picked up using the Shinkaï submersible during the Japanese 127
oceanographic cruise MODE 98 on board the R/V Yokosuka (1998). The samples were 128
collected from the spreading axis and from the intersection massifs between the ridge and the 129
transform fault of both northern (dives 415, 417, 418, 419, 420 and 421) and southern (dive 130 428; Fig. 1) segments. 131 132 3. ANALYTICAL TECHNIQUES 133 134
Major element contents were obtained by in situ analyses on basaltic glasses by electron 135
probe Camebax SX-50 in Brest, and trace element concentrations using laser ablation sector-136
field ICP mass spectrometer (laser 213 nm New Wave coupled with Element 2 ICPMS) at the 137
Max-Planck-Institut für Chemie of Mainz [methodology by Jochum et al., 2007]. Sr and Nd 138
fractions were separated using standard ion exchange techniques adapted from Richard et al. 139
[1976] and White and Patchett [1984]. Analyses were performed using a Triton T1 thermal 140
ionization mass spectrometer (TIMS) at the Institut Universitaire Européen de la Mer of the 141
University of Brest; Pb fractions were separated following Manhès et al. [1978] and were 142
analyzed using a Nu Instrument HR multi-collector ICP-MS at the École Normale Supérieure 143
of Lyon. 144
Analyses were done on small basaltic glass chips (2-5 mm) carefully selected under a 145
binocular microscope. All chips with apparent sign of alteration or Mn crust were removed. 146
Selected glass chips were leached with 10 mL of HCl 6N at 50°C during 24h. Then, the 147
samples were rinsed twice with distilled water and leachates were saved and analyzed to 148
quantify the effects of the leaching process. Average element concentrations in leachates 149
relative to those of samples do not exceed 8 % for trace elements. 150
Blanks for Sr, Nd and Pb isotope compositions are respectively 250, 90 and 80 pg and 151
are thus negligible compared to the amount of Sr, Nd and Pb concentrations measured here. 152
Sr (NIST-987), Nd (JNdi-1) and Pb (NIST-981) isotope ratios of reference materials were run 153
with each sample batch. Average results are 0.710241±9 (n=5, ±2σ) for 87Sr/86Sr ratio in
NBS-154
987 reference material, 0.512101±9 (n=4, ±2σ) for 143Nd/144Nd ratio in JNdi-1 reference
155
material and 16.9327±5, 15.4865±6 and 36.684±2 (n=10, ±2σ) respectively for 206Pb/204Pb,
156
207Pb/204Pb and 208Pb/204Pb ratios in NIST-981 reference material. All these results are consistent
157
with those previously published and available online in the Geological and Environmental 158
Reference Materials (GeoReM, http://georem.mpch-mainz.gwdg.de/) database. 159 160 4. RESULTS 161 162 4.1 Major elements. 163
Major element data show that our samples are all tholeiitic in composition. It was 164
suggested that major elements in E-MORBs may reveal some variations relative to N-MORBs 165
[e.g. increasing content in Al2O3 observed in E-MORBs from the MARK area, Donnelly et al.,
166
2004]. This is not the case for the 15°20’N FZ area. No systematic variations can be identified 167
in major elements versus parameters such as latitude or distance to the 15°20’N FZ (e.g. Mg# 168
ranges from 41 to 47), except for Na8.0 average which decreases from 2.8 for the northern
169
segment to 2.3 for the southern segment. 170
171
4.2 Trace elements. 172
Extended trace element patterns (normalized to primitive mantle) [McDonough and Sun, 173
1995] are shown by Figure 2. Basalts from the northern segment are slightly enriched in 174
LREE compared to HREE, with average (La/Sm)N and (Dy/Yb)N ratios of 1.10 and 1.07
175
respectively. 418R3 is the only sample that presents higher ratios, with (La/Sm)N ~1.23 and
176
(Dy/Yb)N ~1.15. Enrichment for LREE is about 20 to 30 times C1 chondrite contents and less
177
than 20 times for HREE. These samples are therefore intermediate in compositions between 178
N-MORB and more enriched MORB such as basalts from the MARK area or from the MAR 179
14°N anomaly. Extended trace element patterns show slight enrichment in the most 180
incompatible elements with normalized concentrations ranging from 6 to 10 times primitive 181
mantle contents [McDonough and Sun, 1995]. All samples present negative Pb anomalies, 182
which are characteristic of suboceanic mantle [Hofmann, 1988], but also high positive 183
anomaly in Nb-Ta, and negative anomaly in Sr. Generally speaking, the northernmost 184
samples (e.g. 415R4) are less enriched than samples near the fracture zone (e.g. 418R3 ; Fig. 185
3), and follow the geochemical gradient described by Dosso et al. [1991] from 17°10’N to 186
14°N (Fig. 3). 187
Samples patterns from the south of the 15°20’N FZ are sub-identical, indicating that 188
samples probably come from the same magmatic body. These basalts are significantly 189
enriched in LREE with average (La/Sm)N ratios of ~2. (Dy/Yb)N ratios are slightly higher than
190
those from the northernmost samples (1.25 versus 1.13). Enrichments are also described for 191
strongly incompatible element. Nb-Ta concentrations are 40 times that found in primitive 192
mantle, twice the contents of the most enriched sample from the north segment (418R3). 193
194
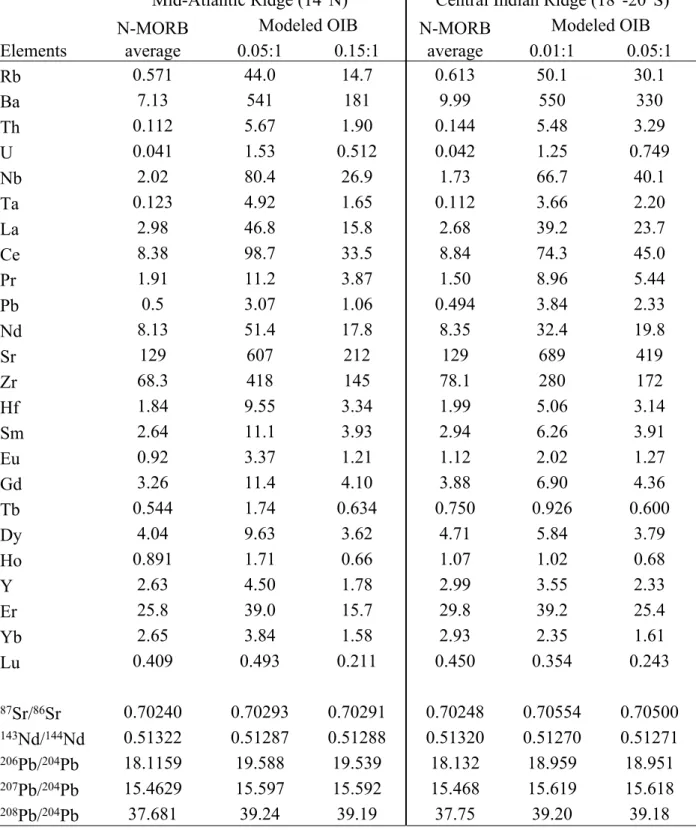
4.3 Sr, Nd and Pb isotope data. 195
New isotope data presented in this study are plotted in Figure 2 together with isotope 196
data from Atlantic MORB [Agranier et al., 2005]. Considering average isotopic compositions 197
for N-MORB from the North Atlantic of 0.70240, 0.51322, 18.116, 15.463 and 37.68 198
respectively for Sr, Nd and Pb isotopic ratios (averages calculated using MORB away from 199
any hotspot; data are from Agranier et al., 2005], all of our samples presented in this study are 200
more radiogenic in Sr and Pb (and less in Nd) than those of North Atlantic N-MORB. MORB 201
Sr ratios from the northern segment increase from 0.70249 to 0.70265 towards the 15°20’N 202
FZ. The most radiogenic values (~0.70276) are measured on E-MORBs located south of the 203
fracture zone. The dispersion observed in 87Sr/86Sr ratios for 415R4, 415R5, 417R1 and 419R4
204
while they are on the mantle array in Nd-Pb and Pb-Pb spaces is likely to be related to 205
seawater interaction. The fact that NAUFARA-007-005 and CHR0077-006-145 samples from 206
Agranier et al. [2005] behave like these four samples also display good evidence for seawater 207
contamination as well. 143Nd/144Nd ratios from northern segment samples decrease from the
208
15°20’N FZ to the north. Lower values (~0.512950) are observed in the southern segment 209
samples with isotopic ratio comparable to those of hotspot-related E-MORB (35°N-45°N 210
region related to the Azores hotspot, Turner et al., 1997; Equatorial MAR contaminated by 211
the Sierra-Leone mantle plume, Schilling et al., 1994). 212
MORBs from the northern segment range from 18.3647 to 18.5668 for 206Pb/204Pb ratio,
213
from 15.4828 to 15.5075 for 207Pb/204Pb ratio and from 37.889 to 38.138 for 208Pb/204Pb ratio.
214
Conversely, E-MORBs from the southern segment are characterized by higher isotopic lead 215
ratios, with values about 19.23, 15.56 and 38.86 respectively for 206Pb/204Pb, 207Pb/204Pb and
216
208Pb/204Pb. The global increase observed in lead isotope ratios from north to south is in
agreement with the progressive source enrichment through the 15°20’N FZ, as determined by 218
previous trace element and isotope composition analyses (Fig. 3). 219 220 5. DISCUSSION 221 222 5.1 Enrichment origin. 223
The statistical study published by Arevalo and McDonough [2009] shows that Atlantic 224
MORBs compared to MORBs from Indian and Pacific oceans are in average more enriched in 225
very incompatible element (e.g. LREE, Ti, Ta, Nb, ...) as well as less incompatible elements 226
(e.g. HREE). To account for this observation, the authors suggested that this enrichment is 227
likely related to smaller degrees of partial melting and/or greater extends of fractional 228
crystallization due to smaller spreading rates, even though the presence of prominent recycled 229
source component or variable proportion of pyroxenite in the Atlantic mantle source is also 230
envisaged. Nevertheless, for the most enriched MORB, it is now commonly accepted that the 231
genesis of E-MORB does not only occur because of smaller degrees of partial melting but 232
requires an enriched source contribution [Dosso et al., 1991; Dosso et al., 1993; Michael et al., 233
1994; Niu and Batiza, 1997; Donnelly et al., 2004; Hémond et al., 2006; Nauret et al., 2006]. 234
Recent studies on MAR basalts propose that Atlantic MORB heterogeneities have two 235
origins: (1) a long-wavelength character revealing the influence of hotspot mantle (e.g. 236
Iceland), and (2) a pervasive shorter wavelength character explained by MORB source 237
contamination with old subducted recycled lithosphere [i.e. the dispersion of the DUPAL 238
anomaly; Dupré and Allègre, 1984; Agranier et al., 2005]. The idea of a hotspot interaction to 239
account for the 14°N anomaly was rapidly abandoned, the nearest hotspot, the Cape Verde 240
islands, being located 1800 km away. Bougault et al. [1988] followed by Dosso et al. [1991] 241
proposed that the 14°N E-MORB may reflect an interaction with an embryonic mantle plume 242
associated with the triple plate junction, but alternative origins of the enriched mantle source 243
was suggested by the same authors shortly after [Dosso et al., 1993]. It was also demonstrated 244
that E-MORBs from the East Pacific Rise (EPR) could be attributed to small discrete blobs of 245
variably fractionated material, with more radiogenic signatures, dispersed as heterogeneities 246
with a size and distribution related to spreading rate at fast spreading ridge [Allègre et al., 247
1984; Niu et al., 1999]. Thus, it appears that E-MORBs do occur far from any hotspot and 248
without any relationship with deep mantle plumes [Donnelly et al., 2004]. Therefore, when no 249
hotspot is involved, mixing processes between some N-MORB source and some enriched 250
component is the most adequate explanation accounting for the MORB enrichment variability 251
[Staudacher et al., 1989; Dosso et al., 1991; Dosso et al., 1993; Michael et al., 1994; Donnelly 252
et al., 2004; Hémond et al., 2006]. This hypothesis is firstly suggested by the Na8.0 variation.
253
Na8.0 refers to values of Na2O corrected from low-pressure fractionation to a common MgO
254
content of 8 wt.% and is considered as an index of the partial meting degree [Klein and 255
Langmuir, 1987]. This parameter is also known to increase with the axial depth, explaining 256
why samples north to the 15°20'N FZ have higher values than those located to the region of 257
the 14°N topographic high previously described (2.8 versus 2.3 in average; Table 1). As 258
proposed by Klein and Langmuir [1987], such depth/chemistry relationship may reflect 259
source heterogeneity in major element composition. The mixing hypothesis is also suggested 260
by the isotope data. The correlations described between our samples isotope ratios indicate 261
that the observed MORB compositional variability probably derived from a binary mixing. 262
Even if the mixing hypothesis was early proposed [Bougault et al., 1988; Staudacher et al., 263
1989; Dosso et al., 1991; Dosso et al., 1993], the petrological and geochemical processes 264
leading to the formation of enriched sources were not really discussed until recently by 265
Donnelly et al. [2004]. 266
These authors underlined that such enrichment requires a low partial melting degree 267
stage to account for the trace element ratios whereas oceanic ridges are mostly characterized 268
by high melting degrees. To account for the enrichment of a mildly enriched basalt (MARK 269
area), authors have developed a model where the MORB mantle source is contaminated by a 270
metasomatised peridotite, which was previously enriched by low degree partial melts during 271
subduction. Without refuting this model, Hémond et al. [2006] proposed another explanation 272
for E-MORB genesis. Following the observation of McKenzie et al. [2004], they argued that 273
the recycling of alkali basalts composing the great majority of ocean islands and submarine 274
seamounts beneath oceanic ridges could represent an alternative to the metasomatic model 275
proposed by Donnelly et al. [2004]. Both models were developed based on trace element 276
characteristics of E-MORB, and particularly the recurrent occurrence of Nb-Ta positive 277
anomaly. Niu et al. [1999] estimated that Nb-Ta positive anomaly in oceanic basalts indicates 278
that the sources of these basalts are recycled oceanic lithosphere that had previously 279
undergone subduction zone dehydration which preferentially transferred the Th and U (vs. Nb 280
and Ta) to the mantle wedge, leaving a "residual" lithosphere enriched in Nb and Ta. Melting 281
of such enriched lithosphere could therefore enrich the surrounding mantle peridotites and 282
finally produce E-MORB at spreading ridge axis, corroborating the metasomatism model 283
proposed by Donnelly et al. [2004]. Nevertheless, Nb-Ta positive anomaly is also 284
characteristic in overall OIB [e.g. Willbold and Stracke, 2006], probably inherited from the 285
process described by Niu et al. [1999], as recycled oceanic lithosphere is thought to be the 286
major source of OIB [Willbold and Stracke, 2006]. In addition, based on the calculation of 287
trace element variability of the 14°N MAR samples, Hémond et al. [2006] suggested that 288
seamounts can pass through the subduction (in spite of the fractionation related to subduction) 289
without being significantly modified in their trace element composition, even for the more 290
"mobile" element such as Rb and U. Thus, recycling OIB and/or seamounts beneath mid-291
ocean ridge would also be consistent with the genesis of E-MORB. 292
The main limitation of the latter model is that Hémond et al. [2006] did not extrapolate 293
it to the isotopes. Conversely, Donnelly et al. [2004] used them to demonstrate that the 294
recycling of the oceanic crust cannot explain the isotopic composition of E-MORB, since 295
recycled oceanic crust is expected to have a DMM isotopic composition, which is not 296
radiogenic enough to constitute a suitable source of E-MORB. Based on this assumption, they 297
developed a metasomatic model described above which creates the enrichment necessary to 298
account for the trace element and the isotopic compositions of E-MORB. Similarly to 299
Donnelly et al. [2004], Cooper et al. [2004] considered the origin of Azores E-MORB as 300
related to the melting of a peridotite previously contaminated by melts deriving from the 301
recycling of an old oceanic crust. They suggested that the highly radiogenic Sr composition of 302
E-MORB could be inherited from the hydrothermal alteration of the recycled oceanic crust 303
prior to its subduction. Authors also explain the unradiogenic Nd values by aging effects, but 304
such effects are not only restricted to Nd isotope ratios, and would also affect other isotopic 305
systems. Moreover, this model does not explain the highly radiogenic Pb composition usually 306
observed in E-MORB. Although Pb isotopic compositions can increase due to the seawater 307
alteration, this assumption is far from systematic. Indeed, even Fe-Mn crust contributes to 308
increase Pb isotope ratios [von Blankenburg et al., 1996; Abouchami et al., 1997], Vidal and 309
Clauer [1981] demonstrated that Sr isotopes can show evidences of seawater contamination 310
whereas Pb isotopes do not (this is also the case in this study for some of our samples, Figure 311
3). The major argument against Donnelly et al.'s model [2004] [and also the one of Cooper et 312
al., 2004] concerns the depth of the first melting stage. In both models, low F melting of the 313
subducting slab is believed to occur at greater depths than those usually considered for arc-314
magma genesis [i.e. ~110 km; e.g. Hattori and Guillot, 2003; Rüpke et al., 2004]. This 315
assumption may be problematic for two reasons: Firstly, melting of subducting slab requires 316
particular conditions that are far from systematic in subduction zones. Iwamori [1998] 317
demonstrates that slab melting is restricted to young slab (<10 My), mainly producing 318
particular arc-magmas such as adakites. Such melting generally occurs in the forearc and is 319
thus localized at low depth [<80 km; Iwamori, 1998]. Secondly, melting is unlikely to occur 320
at depths greater than ~150 km. Melting in subduction is associated to the breakoff of hydrous 321
minerals (i.e. serpentine) composing the slab and/or the overlying mantle wedge that release 322
an important amount of water leading to its partial melting [e.g. Hattori and Guillot, 2003; 323
Rüpke et al., 2004]. Even small amount of water can be retained in the slab at depth greater 324
than 150 km, the pressure is likely too high and the amount of water too low to produce slab-325
derived melts. Therefore, while these observations are not sufficient to rule out the 326
metasomatism model of Donnelly et al. [2004], they allow us to consider further the OIB 327
recycling model of Hémond et al. [2006]. Nevertheless, to validate the model of Hémond et al. 328
[2006], isotopic compositions must be taken into account, particularly considering that even if 329
OIB can be estimated as homogeneous in trace element composition, this assumption is not 330
true for isotopes. 331
332
5.2 OIB recycling model. 333
5.2.1 Formation of seamounts: On-axis vs. off-axis origin. 334
The major feature that has to be taken into account before considering the model of 335
seamount recycling is the origin of the seamounts. Indeed, the viability of the model critically 336
depends on how do the seamounts form and do all of them display enriched composition that 337
could contribute to produce E-MORB after their recycling. Basically, seamounts can be 338
related to: (1) a hotspot activity; (2) a mid-ocean ridge activity; (3) a intra-oceanic subduction 339
zone. Although seamounts deriving from arc magmatism are clearly different in composition 340
compared to the DMM, their number is very limited [Koppers and Watts, 2010] and thus their 341
contribution to the mantle heterogeneity can be considered as negligible. 342
Volcanic islands and seamounts formed away from tectonic boundaries (so-called intra-343
plate volcanism, e.g. Hawaii-Emperor chain, Society Islands, Réunion, Cape Verde) are 344
commonly considered as the surface expression of deep mantle plume activity [Morgan, 345
1971]. In this "off-ridge" setting [Watts et al., 2006; Koppers and Watts, 2010], such intra-346
plate magmatism leads to the formation of large volcanic islands (locating the present-day 347
hotspot activity) which become seamounts as the plate motions move them away from the 348
"stationary" parent plume, forming linear age-progressive seamount trails. Basalts related to 349
hotspots (so-called OIB for oceanic island basalts) differ from MORB in their chemical 350
composition. Unlike the MORB, which are tholeiites thought to be formed by high degrees of 351
partial melting (>10%), OIB are mainly silica-undersaturated alkali basalts deriving from low 352
degrees of partial melting and which are enriched in incompatible elements and radiogenic 353
isotope ratios relative to MORB [e.g. Hofmann et al., 1978; Zindler and Hart, 1986]. As they 354
were believed to derive from a deep source [i.e. the D" layer at the Core-Mantle boundary; 355
Morgan, 1971], OIB offered a unique opportunity to understand deep mantle processes. 356
Therefore numerous studies focused on them over the last three decades [e.g. Hofmann et al., 357
1978, White, 1985; Zindler and Hart, 1986; Hart et al., 1992; Stracke et al., 2005; Willbold 358
and Stracke, 2006; 2010]. These studies have demonstrated that OIB do not derive from a 359
unique source and that they arise from the mixing of approximately five mantle reservoirs 360
(DMM, EM-1, EM-2, HIMU and FOZO/PREMA/PHEM/C) defined by their isotope ratios 361
[Zindler and Hart, 1986], leading to a scheme nicknamed "the mantle zoo" [Stracke et al., 362
2005]. Compared with the DMM, presumed to approximate the source of the MORB, EM-1 363
(Enriched-Mantle-1) is characterized by high 87Sr/86Sr, very low 144Nd/143Nd and higher
364
208Pb/206Pb at a given 206Pb/204Pb, properties that are thought to be inherited from the recycling of
365
pelagic sediments in the source of magmas. OIB that fall into this category are Pitcairn, 366
Kerguelen, Walvis Ridge, Tristan da Cunha and Gough. OIB from EM-2 source (Enriched-367
Mantle-2) are more radiogenic in Sr and Pb and less radiogenic in Nd than EM-1 and are 368
associated to the recycling of terrigenous sediments eroded from the continental crust and 369
deposited on the seafloor. Society, Samoa and Marquesas Islands are representative of EM-2 370
type OIB. HIMU (for HIgh µ, i.e. high 238U/204Pb) type OIB includes St Helena and some of the
371
Cook-Austral chain basalts (others belong to the FOZO type, see below) and are characterized 372
by extremely high Pb isotope ratios. They are also less radiogenic in Sr compared to EM-373
types and are likely to be formed by the recycling of old, subducted, dehydrated oceanic crust. 374
Compared to HIMU, the last classification, called FOZO [for FOcal ZOne, Hart et al., 1992; 375
Stracke et al., 2005] was attributed to OIB that were less radiogenic in Pb at a given Sr and 376
Nd isotopic composition. FOZO is mainly represented in basalts from Cook-Austral chain 377
[see Stracke et al., 2005], and it is also considered to be common to most basalts. The idea of 378
a common component mixed in the various sources of OIB, first called PREMA [for 379
PREvalent MAntle, Zindler and Hart, 1986], has evolved to FOZO, PHEM [for Primitive 380
HElium Mantle, Farley et al., 1992] and C [Common Component, Hanan and Graham, 1996], 381
but all of them differ from each other only in detail [Hofmann, 2003]. As the name and the 382
origin of this component have no influence on the proposed model, we will simply refer to 383
FOZO hereafter. 384
As their chemistry strongly differs from the DMM, the recycling of OIB may introduce 385
significant amount of enriched material in the mantle. Nevertheless, intraplate oceanic 386
seamounts do not all originate from plumes. Even, several studies have shown that this type 387
of seamount is predominant in the seafloor compared to OIB related seamounts [Batiza, 1982; 388
Hofmann, 1997; Watts et al., 2006; Koppers and Watts, 2010]. They usually occur as isolated 389
edifices (near-ridge seamounts, e.g. along the EPR), clusters (Rano-Rahi seamount field, near 390
the EPR) or lines (the Cameroon Line in the Atlantic ocean or the Line Islands and the 391
Pukapuka ridge in the Pacific Plate). As only few data are available on this type of seamounts, 392
their origin remains poorly constrained, Hofmann [1997] arguing that most of these are 393
melting anomalies likely coming from the upper mantle. Following this idea, the hypothesis 394
of small-scale sublithospheric convection [Ballmer et al., 2007] has been developed to explain 395
linear seamount chains that do not display age progression (such as Pukapuka ridge or Line 396
Islands) or seamount clusters (Rano-Rahi seamount field). Recently, on the basis of the elastic 397
thickness, a parameter that is sensitive to whether a seamount is formed nearby of faraway 398
from a mid-ocean ridge, Watts et al. [2006] and Koppers and Watts [2010] estimated that the 399
largest part of the world's seamounts are not related to plume and was formed close to mid-400
ocean ridge (i.e. "on-ridge" type seamount). Studies focused on these "on-ridge" seamounts 401
have shown that they are geochemically different from N-MORB, carrying slightly enriched 402
MORB-like signatures [Batiza and Vanko, 1984; Zindler et al., 1984; Graham et al., 1988; 403
Niu et al., 1997; 2002]. In reality, non-OIB seamounts display large variations in composition, 404
ranging from N-MORB-like signature to OIB-like signatures (Fig. 4). Particularly, numerous 405
EPR seamounts have isotopic compositions that are highly comparable with those assumed 406
for the DMM. However, most of the "on-ridge" seamounts exhibit slightly to strongly 407
enriched compositions and plot along the DMM-FOZO array. This indicates that such type of 408
seamounts derives from the mixing of small-scale heterogeneities with the surrounding 409
depleted upper mantle and thus also incorporates a significant amount of enriched material in 410
the mantle when they are recycled. 411
Nevertheless, although we show that "on-ridge" type seamounts are slightly enriched 412
compared to the DMM, both types of seamounts do not have the same potential to produce E-413
MORB after their recycling. As illustrated above, "on-ridge" seamounts differ from "off-414
ridge" seamounts mainly on their number, their size and their chemistry. Hillier and Watts 415
[2007] estimate a total number of ~3 million seamounts with a height > 0.1 km of which only 416
200,000 are clearly identified. Considering these numbers, only a few of them are clearly 417
documented enough to constrain their origin. However, Watts et al. [2006] and Koppers and 418
Watts [2010] recently estimated that at least 60% of the identified seamounts were formed in 419
an "on-ridge" setting (estimate made using the Wessel's [2001] database of ~15,000 420
seamounts with a height >1.5 km). Although "off-ridge" seamounts are less abundant, they 421
are significantly more enriched in incompatible elements and more radiogenic in Sr and Pb 422
isotopes. Among all "on-ridge" seamounts plotted in Figure 4, only a few reaches the 423
radiogenic enrichment usually described in OIB (e.g. the Cameroon line or some samples 424
from the Line Islands). All others more closely resemble E-MORB rather than OIB. "Off-425
ridge" seamounts are also higher in size and volume [Batiza, 1982; Wessel, 2001]. For 426
instance, the almost totality of the structures that form the Hawaiian-Emperor seamount 427
chains are higher than 4 km, while "on-ridge" seamounts are smaller (likely < 1.5 km in 428
average) suggesting that the largest amount of enriched material that derives from the 429
recycling of seamounts is related to OIB. 430
431
5.2.2 Trace element modeling. 432
The trace element modeling reproduced in this study is nearly the same as developed in 433
Hémond et al. [2006]. This model was used to constrain the Sr, Nd and Pb concentrations in 434
the enriched component, data that are required for isotope modeling. Parameters used in this 435
model and their references are given in Table 2 and 3 (see also Table S1 for complete 436
parameter values used for the modeling including partition coefficients, average compositions 437
in trace elements and isotopes for OIB, etc.). 438
The assumption of Hémond et al.'s modeling is that E-MORB from the 14°N anomaly 439
in the MAR derive from the melting of an enriched source which can be modeled as a solid 440
binary mixing process between the DMM and enriched component (i.e. a recycled 441
OIB/seamount). For purpose of modeling, the trace element composition of the recycled 442
OIB/seamount is calculated using the non-modal batch meting equation from Shaw [1970] 443
and the solid binary mixing model developed by Faure [1977]. The non-modal batch melting 444
equation defined by Shaw [1970] is turned to express the trace element concentration of the 445
E-MORB source (C0) as a function of the trace element composition of the E-MORB (CEL), the
446
partial melting degree (F), the source bulk distribution coefficient (D0) and the melt partition
447 coefficient (P): 448 (1) C0= CEL D0+ F(1− P) 449
The most enriched E-MORB (sample 428R5) was chosen for the melt composition (CEL). It
450
makes sense to use this sample in this purpose as this sample comes from the area where the 451
contamination by the enriched component is the strongest. As postulated by Hémond et al. 452
[2006], a relatively high partial melting degree (F = 18 %) was used because of the enhanced 453
fertility caused by the addition of the enriched component within the DMM. 454
The same expression as (1) is used to constrain the trace element composition of the N-455
MORB source (i.e. the DMM): 456 CDMM = CN−MORB D0+ F(1− P) (2) 457
Here, CDMM is the trace element composition of the DMM and CN-MORB corresponds to an average
458
of N-MORB trace element composition (N-MORB are here defined as MORB with 459
(La/Sm)N < 1 and 87Sr/86Sr < 0.7027). D0 and P are the same as in (1) and F = 10 %, following
460
the model of Hémond et al. [2006]. Then, the composition of the enriched component (i.e. the 461
recycled OIB/seamount; CEC) drowned in the surrounding, more depleted, mantle source (i.e.
462
the DMM; CDMM) is deduced from the solid binary mixing equation given in Faure [1977]:
463
C0= CEC. f+ CDMM.(1− f ) (3)
464
turned into 465
CEC =
C0 − CDMM.(1− f )
f (4)
466
where f corresponds to the proportion of the enriched component in the mixture. 467
In Figure 5, the trace element spidergrams of two calculated enriched components (red 468
lines) are reported and compared with the OIB fields [Willbold and Stracke, 2006]. The 469
"0.05:1" and "0.15:1" lines represent the PM-normalized trace element compositions of the 470
modeled recycled OIB/seamount calculated for f = 5 % and 15 %, respectively (see Table 3 471
for the compositions). Contrary to Hémond et al. [2006] who chose the abundance patterns of 472
the recycled OIB/seamount "so that the final model product matches the observed, average E-473
MORB at 14-15°N exactly", we calculate here the trace element composition of the enriched 474
component at different mixing proportions with respect to the OIB fields. In other words, we 475
consider in our calculation that the modeled enriched component is consistent with "natural" 476
OIB when at least 90% of the PM-normalized values plot within OIB field. Even if mixing 477
proportions were chosen to stay within the OIB field, Figure 5 demonstrates that chondrite-478
normalized trace element patterns are consistent with "natural" OIB composition (i.e. 479
incompatible element enrichment, positive Nb-Ta anomaly, HREE depletion). Furthermore, 480
these mixing proportions (5 to 15 %) are closed to the abundance of recycled material present 481
in north Atlantic MORB source [≤10%, Cooper et al., 2004]. Our estimates can be closer (6 to 482
11 %) to those of Cooper et al. [2004] by considering only modeled patterns of which 100% 483
of the chondrite-normalized values plot within OIB field. 484
485
5.2.3 Isotope modeling. 486
Isotope ratios of the enriched component were calculated using the binary mixing 487
equation developed by Faure [1977] and DePaolo and Wasserburg [1979]: 488 (5) ICm= fCECICEC + (1− f )CDMMICDMM fCEC+ (1− f )CDMM 489
where ICm, ICEC and ICDMM are respectively the isotopic compositions of the mixture, the
490
enriched component and the DMM, CEC and CDMM are the elemental concentrations in both
491
components and f is the proportion of the enriched component in the mixture. Results of trace 492
element modeling were used for Sr, Nd and Pb concentrations, as well as the mixing 493
proportions. Isotope ratios of the mixture and the DMM were determined by the same way as 494
for the trace elements: isotope ratios of the most enriched E-MORB (sample 428R5) were 495
chosen as ratios of the mixture, and DMM isotope ratios correspond to the regional average of 496
N-MORB isotope ratios. Other parameters are summarized in Table 2 and Table S2. Results 497
are presented in Figure 6 and Table 3. 498
Contrary to the results given by the trace element modeling, variations in the mixing 499
proportions do not lead to significant changes in the modeled enriched component 500
composition. The modeling results are ~0.70292 for 87Sr/86Sr, ~0.51287 for 143Nd/144Nd ratio,
501
~19.564 for 206Pb/204Pb ratio, ~15.594 for 207Pb/204Pb ratio and 39.22 for 208Pb/204Pb ratio.
502
Compared to OIB fields, the calculated enriched component appears incompatible with both 503
EM endmembers. Sr and Nd isotopes are consistent with HIMU, but Pb isotopes are too low 504
to fit with the extremely radiogenic values characterizing HIMU. However, all isotope ratios 505
are comparable with the FOZO isotope compositions, which are characterized by lower Pb 506
isotopic composition at given Sr and Nd. Considering that both trace element and isotope 507
modelings reach the same results, the recycling of OIB seems to be a reasonable model to
508
explain the E-MORB genesis at 14°N on the MAR. 509
510
5.3 Does this happen somewhere else ? 511
Although our model can explain the MORB enrichment in the 14°N region in the MAR, 512
its validity at a global scale (whether this model can account for MORB enrichment in other 513
ridge environment or not) has to be verified. To test this hypothesis, we used samples from 514
the Central Indian Ridge (CIR) at 18°S [Nauret et al., 2006], as in many points, they resemble 515
to the samples from the 14°N anomaly in the MAR: (1) Samples are enriched in incompatible 516
elements ((La/Sm)N >1), (2) they display Nb-Ta positive anomaly, (3) they are highly
517
radiogenic in Sr and Pb and isotopically depleted in Nd compared to the DMM. 518
Nauret et al. [2006] suggested that "the CIR MORB, between 18° and 20°S are 519
generated by partial melting of a heterogeneous source consisting of an enriched component 520
and a normal, depleted upper-mantle peridotite". These authors also highlighted that "the 521
nature of the enriched component is a matter of speculation". They finally noticed that this 522
enrichment is not related to the presence of a hotspot, as the E-MORB composition is distinct 523
from the Réunion plume composition, which is the closest hotspot in the area. Instead, Nauret 524
et al. [2006] considered that the enriched component could result from the metasomatic event 525
proposed by Donnelly et al. [2004], even if enrichment by recycling ancient alkali basalt is 526
also considered. 527
The model established on trace elements and isotopes for the samples from the 14°N 528
region in the MAR was extrapolated to the 18°-20°S region of the CIR. Calculations were 529
made using sample GNT-Pl1-1 since it corresponds to the most enriched sample. Results are 530
presented in Figure 7 and Table 3 (all plots are available in supplementary Figure S1). Trace 531
element composition of the calculated enriched component is comparable to OIB 532
compositions using mixing proportions varying between 1 % and 5 %. Applying these results 533
on the isotope modeling gives an enriched component more radiogenic in Sr (~ 0.70525), less 534
radiogenic in Nd and 206Pb (~ 0.51270 and ~ 18.955 respectively) and almost identical in
535
207Pb/204Pb and 208Pb/204Pb (~ 15.618 and ~ 39.19) compared to the one calculated for the 14°N
536
anomaly in the MAR. As illustrated in Figure 7, this enriched component is consistent with 537
common EM 2 basalts, demonstrating that the model of OIB recycling can also explain 538
MORB enrichment in this region. 539
More generally, several studies reported the existence of E-MORB along mid-ocean 540
ridges of which at least a part presents identical geochemical characteristics (incompatible 541
element enrichment, Nb-Ta positive anomaly, isotopically enriched in Sr and Pb, depleted in 542
Nd) to E-MORB from 14°N in the MAR. This is the case, for example, of MORB sampled 543
along the MAR at 23°N [Donnelly et al., 2004] and 33°S [Michael et al., 1994], as well as for 544
those located at 11°20'N along the EPR [Niu et al., 1999]. Although our model was not tested 545
in these cases due to incomplete data set, the existence of these MORB with geochemical 546
characteristics as listed above (particularly the Nb-Ta positive anomaly) allows us to suppose 547
that our modeling is expected to work on these regions too. 548
Finally, we notice that the mixing proportions determined from the CIR samples are 549
notably the same as those calculated for the 14°N anomaly (globally < 10 %). This result is 550
compatible with previous results obtained by Cooper et al. [2004] who estimated that the 551
materials responsible for the genesis of E-MORB in the North Atlantic are present in 552
abundances of 2-5 % in average. However, these abundances are used by Cooper et al. to 553
explain the pollution of upper mantle at a global scale while ours explain smaller 554
heterogeneities along mid-ocean ridges. This means that the percentage of the recycled 555
OIB/seamount in the mantle source of MORB could be greater if required without being in 556
opposition to the model of Cooper et al. [2004; 2009]. In any case, the small amount we 557
calculated together with the generally small scale heterogeneity that represent E-MORB we 558
studied along the MAR and the CIR suggest that the enriched component represents a very 559
small volume (maybe a few cubic kilometer scale) drowned in the surrounding "normal" 560
mantle. This statement is compatible with the recycling of OIB or seamount which are below 561
the sea level and thus small sized when they subduct. 562
563
5.4. Hyperbolic versus straight mixing trends. 564
As developed by Langmuir et al. [1978], mixing relationships in isotope spaces form 565
linear or hyperbolic trends depending on the denominators in the isotope ratios and on the 566
elemental ratio of both mixing components: if the denominators in isotope ratios are identical 567
(as in the lead isotopes, i.e. 204Pb), the mixing trend is a straight line. Else, the mixing trend
568
depends on the ratio of elemental concentrations in both mixing components: 569 (6) K=(Cx a / Cya ) (Cx b / Cy b ) 570
Choosing for example Sr for x and Nd for y, it becomes 571
(7) K =(Sr / Nd)a
(Sr / Nd)b 572
in which a and b are the mixing endmembers. If K=1, the mixing trend is also a straight line. 573
Else, it is an hyperbola. In Figure 6 and 7, plotting the model results with the data shows 574
essentially straight lines, even in Nd-Sr, Sr-Pb and Nd-Pb isotopic projections where 575
hyperbolic trends are likely to occur. As described above, this feature can be explained by a K 576
value of ~1, showing that the ratios of elements (i.e. Sr/Nd, Sr/Pb and Nd/Pb) are 577
approximately the same in both end-members. This seems to be paradoxical, since our model 578
involves a mixing between the DMM and an enriched OIB source. Figure 8 presents 579
histograms showing the frequency and variation of element ratios (Sr/Nd, Sr/Pb and Nd/Pb) in 580
MORB and OIB. This figure illustrates the broad overlap in the range of Sr/Nd, Sr/Pb and 581
Nd/Pb ratios in MORB and OIB. We found average ratios of 12.8, 247 and 20.1 for Sr/Nd, 582
Sr/Pb and Nd/Pb ratios in MORB, respectively. Average ratios calculated for the OIB 583
approximate those of MORB, leading to K values closed to 1 (calculated here as the ratios in 584
MORB divided by those in OIB). As an example, a virtual mixing between sediments and the 585
DMM leads to a K that can be higher than 20 [calculated using the Nd/Pb ratios of the 586
GLOSS from Plank and Langmuir, 1998]. Therefore, as element ratios in MORB and in OIB 587
are similar, a mixing between these two components will form curvilinear trends rather than 588
hyperbolas in isotope spaces. 589
590
5.5 Time constraints. 591
Several studies try to constrain the age of the heterogeneities responsible for E-MORB 592
genesis [e.g. Dosso et al., 1999; Cooper et al., 2004; Donnelly et al., 2004]. Using mantle 593
isochrons and Monte-Carlo simulations on Sr, Nd and Pb isotope systems, Dosso et al. [1999] 594
give an age of 250 Ma for the heterogeneity beneath the 14°N region. The same age is also 595
given for the enriched component beneath the Azores [Dosso et al., 1999; Cooper et al., 2004]. 596
Cooper et al. [2004] extrapolate this age to all enriched components present in the North-597
Atlantic MORB source (excluding deep hotspot), arguing that all of them represent recycled 598
products subducted along the western margin of Pangea. In their study, Donnelly et al. [2004] 599
also calculated an age of ~300 Ma based on mantle isochrons, but also showed that this age 600
does not necessarily represent a specific event. Instead, they assume that this age results from 601
the continuous formation and destruction of the enriched mantle source and depends on 602
multiple parameters such as the decay constant of the radioactive decay system or the 603
incompatibility of the daughter element during melting. They finally demonstrated that the 604
mantle isochron ages could approximate the residence time of the enriched reservoir in the 605
mantle if its mass represents a few percent of the system. 606
Figure 9 shows the evolution of the 206Pb/204Pb and 208Pb/204Pb compositions with the time,
607
calculated for both modeled recycled OIB/seamount (14°N in the MAR and 18°-20°S region 608
of the CIR) and compared to the evolution of the DMM. Considering that the Pb isotopic 609
composition of the recycled OIB/seamount cannot be more depleted than the DMM, a 610
maximum age is given by the intersection between both evolution lines. Pb isotope systems 611
give apparent ages ranging from 266 Ma to 295 Ma for the recycled OIB/seamount beneath 612
the 14°N anomaly in the MAR, which is closed to the ~ 250 Ma estimated by Dosso et al. 613
[1999] and Cooper et al. [2004]. Age calculated for the recycled OIB/seamount in the CIR 614
region ranges from 298 Ma to 332 Ma. Using extremely depleted isotopic compositions for 615
the DMM (D-DMM in Figure 9), ages measured for recycling OIB in both regions are ~ 400-616
550 Ma. Tackley [2000] demonstrated that the time scale of complete mantle overturn (i.e. 617
travel down to core-mantle boundary and back to surface) approximates 400-500 Myr. This 618
suggests that recycling OIB underwent a maximum of one "cycle" within the mantle before 619
reappearing beneath the ridge. Considering that the 400-500 Myr age is obtained for an 620
extremely (anomalously) depleted mantle composition, an age of ~250 Ma seems more 621
reasonable, suggesting that the recycled OIB/seamount likely never entered the deep mantle 622
(Fig. 10). 623
624
5.6 Reconciling the OIB/seamount recycling model and the oxygen isotope 625
composition of MORB 626
Recently, Cooper et al. [2009] have published a compilation of available laser 627
fluorination δ18O data for MORB form the Atlantic, Indian and Pacific ridges and have used it
628
to constrain the nature and percentage of enriched material within the upper mantle globally. 629
They revealed that the δ18O compositions of MORB from each ocean basin fit a normal
630
distribution, with identical means and standard deviations (δ18O
mean ~5.50 ‰) and with a total
631
range of 5.25 - 5.8%. In addition, they showed that the oxygen isotope data correlate with 632
radiogenic isotope and trace element. Based on this, Cooper et al. [2009] suggested the DMM 633
to have a δ18O composition of ~5.25 ‰ and the average measured value of 5.5 ‰ to reflect a
634
global contamination of the upper mantle by recycling crustal material in proportion ranging 635
from 5 to 10% (taking into account that these estimates may vary depending on the 636
sedimentary contents in the recycled material). This model is much in favor of the Donnelly et 637
al.'s model rather than ours, since ones can assume that the OIB/seamount recycling model 638
cannot account for the apparent correlation between oxygen isotope data and radiogenic 639
isotope or trace element, because OIBs display the same range in δ18O composition as MORB
640
[Eiler et al., 1996; Eiler, 2001]. Eiler et al. [1996] have reported the δ18O composition of
641
olivine from basalts belonging to each subtype of OIB (i.e. HIMU, EM 1, EM 2 and others 642
including some of the FOZO group). Their results show no evidence for δ18O values outside
643
the range for MORB, except for EM 2 type OIB, of which anomalously high δ18O
644
compositions reflect the presence of subducted sediments in their mantle source. 645
Therefore, taking into account the results of Cooper et al. [2009], trends in δ18O plotted
646
versus trace elements or isotope data are not consistent with the OIB/seamount recycling 647
model unless the OIB that are recycled are all EM 2. However, this assessment can be 648
addressed by at least two reasons: Firstly, although δ18O data are clearly of a certain interest in
649
the study of mantle heterogeneities, the correlations proposed by Cooper et al. [2009] are not 650
always well defined (this is particularly true for Pacific samples which exhibit a large range of 651
δ18O compositions at a given Sr and Pb isotopic composition). Although the weakness of the
652
correlations may be related to the lack of high resolution oxygen data such as those published 653
by Cooper et al. [2004; 2009], these correlations have to be considered with caution and are 654
not robust enough to rule out the OIB/seamount recycling model. Moreover, as oxygen 655
isotope data are available neither in the 14°N region of the MAR nor in the 18-20°S of the 656
CIR, there is no evidence for a possible application of the Copper et al.'s model in these 657
regions. That is not ruling out the model of Cooper et al. [2009], but without a denser 658
database in oxygen isotopes for MORB, one could admit that correlations may occur at large 659
scale (ocean scale) while they do not at more restricted scale (not more than few hundred 660
kilometers). Secondly, the model defended by Cooper et al. [2009] is not incompatible with 661
ours as both could actually happen synchronously in different localities, i.e. a recycled 662
seamount could represent the enriched material in some areas while other types of enriched 663
materials could contribute to form E-MORB in others. The main difference between the two 664
models resides in that the recycling of the oceanic crust may account for large scale 665
heterogeneities (e.g. the global enrichment in oxygen isotopes of the upper mantle at ocean 666
scale, as postulated by Cooper et al., 2009] while the recycling of OIB/seamounts are more 667
likely to form very restricted MORB enrichments (no more than hundred kilometers). 668
669
5.7 Recycled seamounts: more than a process for local MORB enrichment ? 670
We show in this paper that recycling OIB can be a viable process to explain the genesis 671
of E-MORB at 14°N in the MAR, but it is also susceptible to explain E-MORB genesis along 672
other ridges. As demonstrated above, E-MORB from the 18°S region of the CIR, and in 673
regions potentially presenting similar geochemical features (MORB at 23°N and 33°S in the 674
MAR and those from 11°20'N in the EPR) could be explained by this process. This suggests 675
that the recycling of OIB is not an isolated process. Wessel [2001] and Hillier and Watts 676
[2007] identified slightly less than 15,000 seamounts with a heigh >1.5 km, and almost a half 677
of them resides on the Pacific plate. Although the size of a seamount is negligible compared 678
to the volume of the mantle, calculations made by Hillier and Watts [2007] show that overall 679
identified seamounts cover more than 18% of the oceanic seafloor area. A virtual addition of 680
these numerous seamounts allows a thickening of the oceanic crust of about 180 m. 681
Considering these estimates and those of Hofmann [1997] which showed that 20 km3 of
682
oceanic crust are recycled per year, we can calculate that seamounts represent approximately 683
2% of the recycled material. Taking into account that the values given by Hillier and Watts 684
[2007] are minima estimates, i.e. using only identified and measured edifices and that the 685
authors expect around 3 millions of seamounts with a height >0.1 km, the proportion of 686
seamounts in the recycled material can significantly increase. Thus, considering the trace 687
element budget, the isotopic composition of the mantle and the 5-10 % estimation for the total 688
recycled material in the upper mantle with seamounts representing ~2 %, it is clear that the 689
recycling of seamount can hardly be considered as a significant contributor to the upper 690
mantle heterogeneity. Nevertheless, it has to be considered as a plausible mechanism to 691
generate (local) MORB enrichment. 692
693
CONCLUSIONS. 694
New trace element and isotope data have demonstrated that MORB enrichment from 695
north and south of the 15°20’N FZ can find their origin in the geochemical anomaly centered 696
at 14°N and associated with a high topographic bulge. 697
Isotope ratios confirm and valid the enrichment model established on trace element by 698
Hémond et al. [2006]: the E-MORB origin can be attributed to a binary mixing between N-699
MORB source and OIB/seamount material recycled through subduction. The age of the 700
recycled OIB/seamount is estimated to 250 Ma. 701
Finally, we show that the model described here can be applied to E-MORB from other 702
ridge segments, and is thus unlikely to be an isolated process. Considering the great number 703
of seamounts on the ocean floor, their recycling may represent a significant process to 704
account for MORB enrichment. 705
706
Acknowledgements.
707
M.U., C.H. and P.N. thank Claire Bollinger and Marcel Bohn for their help during the laboratory and analytical
708
works, and Philippe Telouk for his help during lead isotope measurements at the ENS of Lyon. We also thank
709
Catherine Chauvel, Al Hofmann, Charlotte Fillon and Morgane Ledevin for their help during the redaction of the
710
manuscript.
711
K.P.J. thanks Brigitte Stoll for its contribution during trace element measurements at the Max-Plank-Institut für
712
Chemie of Mainz.
713
We also thank the editor Joe Baker and the two anonymous reviewers and Matthew Jackson for their comments
714
that help us to significantly improve this manuscript.
References. 716
Abouchami W., Goldstein, S.L., Gazer, S.J.G., Eisenhauer, A., and Mangini, A., 1997. 717
Secular changes of lead and neodymium in central Pacific seawater recorded by a Fe-718
Mn crust. Geochimica et Cosmochimica Acta, 61(18): 3957-3974. 719
Abouchami, W., Galer, S.J.G. and Hofmann, A.W., 2000. High precision lead isotope 720
systematics of lavas from the Hawaiian Scientific Drilling Project. Chemical Geology, 721
169(1-2): 187-209. 722
Agranier, A. Blichert-Toft, J., Graham, D., Debaille, V., Schiano, P., and Albarède, F., 2005. 723
The spectra of isotopic heterogeneities along the mid-Atlantic Ridge. Earth and 724
Planetary Science Letters, 238(1-2): 96-109. 725
Allègre, C.J., Hamelin, B. and Dupré, B., 1984. Statistical analysis of isotopic ratios in 726
MORB - The Mantle Blob Cluster model and the convection regime of the mantle. 727
Earth and Planetary Science Letters, 71(1): 71-84. 728
Arevalo, R. Jr, and McDonough, W.F., 2009. Chemical variations and regional diversity 729
observed in MORB. Chemical Geology, 271: 70-85. 730
Blichert-Toft, J., Weis, D., Maerschalk, C., Agranier, A. and Albarède, F., 2003. Hawaiian 731
hot spot dynamics as inferred from the Hf and Pb isotope evolution of Mauna Kea 732
volcano. Geochemistry Geophysics Geosystems, 4: doi:10.1029/2002GC000340. 733
Ballmer, M.D., van Hunen, J., Ito, G., Tackley, P.J., Bianco, T.A., 2007. Non-hotspot volcano 734
chains originating from small-scale sublithospheric convection. Geophysical Research 735
Letters, 34: L23310. 736
Batiza, R., 1982. Abundances, distribution and sizes of volcanoes in the Pacific Ocean and 737
implications for the origin of non-hotspot volcanoes. Earth and Planetary Science 738
Letters, 60: 195–206. 739
Batiza, R., Vanko, D., 1984. Petrology of young Pacific seamounts. Journal of the 740