HAL Id: hal-02591764
https://hal.inrae.fr/hal-02591764
Submitted on 15 May 2020
HAL is a multi-disciplinary open access
archive for the deposit and dissemination of sci-entific research documents, whether they are pub-lished or not. The documents may come from teaching and research institutions in France or abroad, or from public or private research centers.
L’archive ouverte pluridisciplinaire HAL, est destinée au dépôt et à la diffusion de documents scientifiques de niveau recherche, publiés ou non, émanant des établissements d’enseignement et de recherche français ou étrangers, des laboratoires publics ou privés.
vision
M. Manez, E. Moors, M. Buma, J. Panebianco, S. Loubier
To cite this version:
M. Manez, E. Moors, M. Buma, J. Panebianco, S. Loubier. Aquastress D2.1.4 - External paper on the Aquastress Water Stress Index (AWSI) including external experts vision. irstea. 2008, pp.17. �hal-02591764�
Doc Name: Deliverable ID: WP 2.1 D2.1-4.pdf Date: 14/02/2008
Dissemination level: PU – Final Report 1
A
QUA
S
TRESS
M
ITIGATION OFW
ATERS
TRESS THROUGH NEWA
PPROACHES TOI
NTEGRATINGM
ANAGEMENT,
T
ECHNICAL,
E
CONOMIC ANDI
NSTITUTIONALI
NSTRUMENTSI
NTEGRATEDP
ROJECTD2.1-4
External paper on the AquaStress Water Stress Index (AWSI) including
external experts vision
Due date: 31-01-08
Actual submission date: 14-02-08
Start date of project: 1-02-05 Duration: 48 months
Deliverable Lead contractor:
(Organisation name) USF
Participant(s) (Partner short names) USF, ALTERRA, CEMAGREF, TNO
Author(s): Manez, M., Moors, M, Buma, J. Panebianco, S.,
Loubier, S.
Contact for queries: Dr. Maria Manez
USF-Barbarastrasse 12-G66 49076 Osnabrück (Germany) tel. +49-541-9692424
mmanez@usf.uos.de
Dissemination Level (1): PU
Deliverable Status: Final Report
(1)
(PU=PUblic, PP=Restricted to other Programmes Participants, RE=REstricted to a group specified by the consortium, CO=COnfidential only for members of the consortium)
CemOA
: archive
ouverte
d'Irstea
Doc Name: Deliverable ID: WP 2.1 D2.1-4.pdf Date: 14/02/2008
Dissemination level: PU – Final Report 2
Abstract
Water stress is a global problem with far-reaching local economic and social implications. Extreme examples of water stress are climatic events as the long-prolonged drought period in the Iberian Peninsula or. In an era of high implication due to climatic changes, good management practices are needed to combat water stress. However, water resources management in the past has often been derived from a perspective where the different components of “environment-technology-human” systems were clearly separated and approached in a sequential fashion (Pahl-Wostl, 2002). The mitigation of water stress at local scale depends not just on technological innovations, but also on the development of new integrated water management tools and decision-making practices.
This paper presents the implementation of a framework for assessing water stress described in detail by Sullivan et al., 2007. The framework is designed to assess the degree of water stress the different sectors face within a region. Our target focused on relatively small catchments in opposite to the main frameworks for describing water stress.
The aim of the framework reaches further than just an assessment. It improves systems’ coping capacities by focusing attention directly on the water stressors at the sectoral level. The method is sufficiently flexible to accommodate diverse mitigation options for water stress, whose contexts are location specific without presupposing the constraints of “unique-size tailoring”. However, the framework generates an index that can be employed to evaluate the relative water stress of diverse catchments to multiple sectoral water stressors and to their potential interactions.
Table of Contents
Introduction ...3
A water management tool: the Water Stress Framework (WSF)...4
Case studies ...6
Sardinian Case Study... 6
Moroccan Case Study... 9
Discussion ...11
Conclusion...12
Acknowledgements: ...13
Reference:...14
Annex ...15
CemOA : archive ouverte d'Irstea / CemagrefDoc Name: Deliverable ID: WP 2.1 D2.1-4.pdf Date: 14/02/2008
Dissemination level: PU – Final Report 3
Introduction
We are aware that the use of indicators and its application in the water sector is already a fact and has become very important. In particular, legislations such as the implementation of the EU Water Framework Directive (WFD) have given prominence to indicators as management tools in the water sector. There are many other water indicators in use today. Most of these are single indicators of water quality, which for a long time have been the area of water research. Some indicators have been combined as measures of various dimensions of water stress, including the widely used indicators relating the quantity of water available to the amount needed for certain activities. Two well known ones are, the “Water availability per capita per year” (this defines specific thresholds relating to water shortages : 1700 m3/capita/year or less: water stress, 1000 m3/capita/year or less : water scarcity), and “Water withdrawals” (this indicates the degree of stress in a location, but does not take account of water transferred from transboundary rivers or international interbasin transfers).
There are some frameworks, like the DPSIR (Drivers Pressures States Impacts Responses) for water indicators (Jesinghaus, 1998). Arguments have been made (European Environment Agency 1999), that the DPSIR approach permits the establishment of causal relationships between human activities, their environmental impacts, and the effects of societal responses. It is certainly true in some cases, that such cause and effects can be known (e.g. the link between lead emissions to the environment, and its impact on human health), and effective policy responses have been the result (e.g. the removal of lead from petrol). A number of authors have put forward several disadvantages of the DPSIR approach. In some cases, isolated chains of indicators may not be enough to reproduce the complexity of systems, which tend to behave more like a network rather than a linear chain (Bossel, 1999), (Rekolainen, Kämäri, & Hiltunen, 2003),(Caeiro, Patinho, Costa, & Ramos, 1999), (Jorge, Lourenço, Machado, & Rodrigues, 2002).
During the process of the literature review, and building on earlier work on index development (C. Sullivan, Meigh, & Lawrence, 2005; C. A. Sullivan, Meigh, & Fediw, 2002), it had been observed that there was some dissatisfaction in the use of indices in general. Statements are sometimes made about an index being too simple, or not comprehensive enough, with the methodology not allowing a sufficient breadth of knowledge to be included.
As a result our objective was to ease the management of water stress by providing a tool for a first assessment of the integral effect of measures taking by different sectors to combat water stress. We focused on the water system’s property to:
characterize the water system,
to describe the water stress situation in the different water sectors, to recognize the water stressors and
to properly act with bundle mitigation options against water stress.
The basis for our approach was developed within our research group (see C. A. Sullivan et al.(2007)). From our perspective, there are two main possibilities for the use of this tool: 1) to evaluate water stress at the local level and 2) for regional assessments.
In this paper we will apply this tool and we will present how to assess the present water stress situation in specific test sites across different water consuming sectors on a small scale.
CemOA
: archive
ouverte
d'Irstea
Doc Name: Deliverable ID: WP 2.1 D2.1-4.pdf Date: 14/02/2008
Dissemination level: PU – Final Report 4
A water management tool: the Water Stress Framework
(WSF)
One of the first discrepancies that aroused when we started developing the framework was the multitude of disciplines represented in our group. Interdisciplinarity can help to understand a dilemma from different paradigms but sometimes represents also a handicap for conceptions. To avoid future problems, a workshop was organized to refine the understanding of “water stress” for the different disciplines. The aim was to reach a “consilent” definition. Consilience is an attempt to bridge the culture fissure among sciences (Wilson, 1998). The workshop helped to minimize understanding problems. The main outcome was the definition of water stress agreed upon by the different disciplines represented:
“Water stress occurs when the functions of water in the system do not reach the standards (of policies) and or perceptions (of the population) on an appropriate quantity and quality, at an appropriate scale and the adaptability for reaching those is not given”
Based on this definition, our water management tool emerges as a way of assessing those complex issues in for potentially water stressed areas. Our work is developed, along with a related index (Inter Sectoral Water Stress Index -ISWSI). As we already elucidate the water stress framework (WSF) is based on previous work done (comp. Sullivan et al. (2007). Additionally for a better understanding on the structure of the WSF, there is short explanation in the annex to this paper.
Our purpose by building and using the WSF was to define the ability of the water system to exist in some preferred state and continue to deliver its services over time identifying rapidly the possible stressors. The WSF is a composite of indicators. The matrix of indicators combines five water-consuming sectors and five categories (see figure 1).
The Water Stress Framework (WSF) is generated through a combination of two parts: the Integrated
Sectoral Water Stress Index (ISWSI), which captures the level of water stress in the different sectors,
and the Potential Margin (PM), which is an assessment of the available water resource supply (for more information please see annex).
CemOA
: archive
ouverte
d'Irstea
Figure 1: Water Stress Framework Location classification Quantity Issues Quantity Issues Quantity Issues Quantity Issues Quantity Issues Quality Issues Quality Issues Quality Issues Quality Issues Quality Issues Institutional and adaptive capacity Institutional and adaptive capacity Institutional and adaptive capacity Institutional and adaptive capacity Institutional and adaptive capacity Infrastructure Infrastructure Infrastructure Infrastructure Infrastructure Social and economic equity Social and economic equity Social and economic equity Social and economic equity Social and economic equity ENVIRONMENT INDUSTRY (TOURISM) INDUSTRY (PRODUCTION) AGRICULTURE DOMESTIC
Natural Baseline Endowment (NBE) (Quantity of water in the natural water cycle)
PLUS any imported water (interbasin transfers, irrigation channels etc.)
weighted and summed across
IS W S I In teg rat e d S ect o ral Wat er S tr ess In de x
DE
M
A
ND
SU
PPL
Y
W at er S tress O u tc om es PM Po te n tia l M argi ngFor regional assessments comparability across sites needed to be ensured. For this, there is a limited number of core indicators belonging to the five different categories (compare figure 1 and table 1). These core indicators are essential for those regional assessments and the same indicators will be required for each site. To achieve this for a high number of sites only a reduced set of indicators can be used as represented in Table 1. The most important selection criteria for this set of indicators, was data availability combined with the sensitivity of the indicator to water stress. In any case and because the selection of indicators plays such an important role in the spatial applicability of the WSI, it is important to know from the beginning what the objective of the WSI calculations is. For example, if the indicators are adapted to a particular biogeographic region depending on the local conditions, the regional comparison should only be limited to those particular biogeographic regions around the world. In such a case for instance the Mediterranean subtropics with its particularities would be comparable around the world (e.g. Chilean region and Spanish region)
Doc Name: Deliverable ID: WP 2.1 D2.1-4.pdf Date: 14/02/2008
Dissemination level: PU – Final Report 5
During the case study application process, autocorrelation between the indicators was also tested, which further reduced the final number of indicators to be used. For any indicator which was not available at the test site, a replacement was made. Where possible, the selection was made in consultation with the stakeholders at the site e.g. Morocco). When doing so we realized that a prerequisite for site specific evaluation is the selection of the required indicators in consultation with stakeholders. It should be noted that this should be seen as an iterative process, with refinement of this structure achievable if needed during the site process. If there are significant data gaps at a site, proxy values can be provided using expert opinion, until such time as an appropriate specific indicator becomes available. CemOA : archive ouverte d'Irstea / Cemagref
Doc Name: Deliverable ID: WP 2.1 D2.1-4.pdf Date: 14/02/2008
Dissemination level: PU – Final Report 6
Table 1: Example of the core indicators of the WSI
DOMESTIC AGRICULTURE INDUSTRY
(PRODUCTION)
INDUSTRY (TOURISM)
ENVIRONMENT
Quantity Issues Drinking water Irrigation dependability Water quality Water use intensity Deviance from natural flow
Quality Issues Quality norms Salinity Water treatment Quality norms Waste water polluted load
Institutional and adaptive capacity
Water regulation Water saving technologies
Recycling Water saving
technologies
Protected areas
Infrastructure Supply interruptions
Supply dependability Supply interruptions Water treatment River fragmentation Social and economic equity Economy of water suppliers
Farm size dispersion Labour-related water intensity
Labour-related water intensity
Nature protection
Regarding the determination of the weightings for the calculation of the WSF, since those are a political issue and must be regarded as such, weighting should be done in consultation with stakeholders. Alternatively weights could be based on the economic relevance or on the water consumption of a sector, this choice will also depend on the priorities of the user. As it is important to ensure transparency in the interpretation of the results, in general in this paper no weights (i.e. all weights are set to 1) are applied for the first calculations.
Case studies
For the implementation of the WSF we have chosen two case studies: Sardinia and Morocco, which are both test-sites of the AquaStress project. AquaStress adopts a Case Study - stakeholder driven approach1.
In the Sardinian case study we characterized the water stress situation of the test sites and test the sensitivity of the framework using the available data and taking into account the particularities of the test site. In here we can characterize all sectors and we adapt core indicators to the distinctiveness of the test site. In the Moroccan case study we adjust the calculation to the minimal amount of existing data and see how the WSF react.
Sardinian Case Study
The Flumendosa-Mulargia basin is located in the south-eastern part of Sardinia. The basin (1824,39 km2), which includes six interconnected reservoirs, supplies water resources in Southern Sardinia for different and conflicting uses (domestic, agriculture, industry and energy production) within the same basin and mainly for the distribution network located outside the basin in the Campidano plain. As the
1 for more information see www.aquastress.net
CemOA
: archive
ouverte
d'Irstea
Doc Name: Deliverable ID: WP 2.1 D2.1-4.pdf Date: 14/02/2008
Dissemination level: PU – Final Report 7
majority part of Mediterranean areas, it is characterised by water scarcity and quality problems due to drought. The hydrological cycle is influenced both by the geo-morphologic characteristics of the basin and by its pluviometric regime. The Flumendosa-Mulargia system is an area of particular interest for European policies and strategies because it is representative of problems due to drought typical of the Mediterranean climate. The climatic changes of the last years determined a drastic deficit between water demand and its availability, with increase of water stress phenomena in Sardinia. In particular in the last years the reservoir-system resulted in the supply of water resources considered sufficient to cover no more than 20% of the total requirements of the area. Moreover “water stress” resulted in significant problems concerning quality aspects.
The majority of the data for the Sardinian case study were drawn from the databases of Istat (the Italian statistical office), and to a lesser extent Eurostat (the database of the European Union). The spatial scale of the information contained within these databases is generally NUTS-2 or NUTS-3 level. This corresponds to the region of Sardegna and the province of Cagliari, respectively. These administrative boundaries do not correspond to the natural boundaries of the river catchment making up the test site. This is a common problem when applying information about water use and water stress in catchment studies. A potential advantage of retrieving data from the databases mentioned is that the water stress in the test site can be compared to that in other regions. In fact, the range of indicator values contained within a dataset can be used to determine the relative performance of the test site for a given indicator. While this may be not advantageous for indicators which are already normalized to percentages, it is convenient when only absolute values can be retrieved. This is for example the case with the domestic / institutional and adaptive capacity indicator ‘per capita investment in water treatment’. Unfortunately, despite a fair availability of water stress indicator data for individual countries, they have only few indicators in common (Vermooten et al., 2007). This complicates comparisons of the test site with regions in similar settings throughout the entire Mediterranean area.
The dataset was extended by adding local data summarized in Preziosi et al.(2008). With respect to water use, this revealed some inconsistencies with the other data sources. The Istat data report a water use by agriculture of only 312,000 m3 (1999), while between 1997 and 2002, 210 million m3 per year was reportedly abstracted from the reservoirs, of which 100 million m3 per year for use by agriculture (Apostolaki & Assimacopoulos, 2005).
Table 2 shows the resulting indicator values for Flumendosa-Mulargia. The higher the value, the higher the inferred stress.
Table 2: Indicator results for the Flumendosa-Mulargia test site
DOMESTIC AGRICULTURE INDUSTRY TOURISM ENVIRONMENT
Quantity issues 1.00 0.17 1.00* 0.18 0.43
Quality issues 0.00 0.34*
Institutional and
adaptive capacity 0.72 0.57 0.77* NN 0.91
Infrastructure 0.66 0.43* NN 0.61 0.23
Society and equity NN 1.00* NN 0.71*
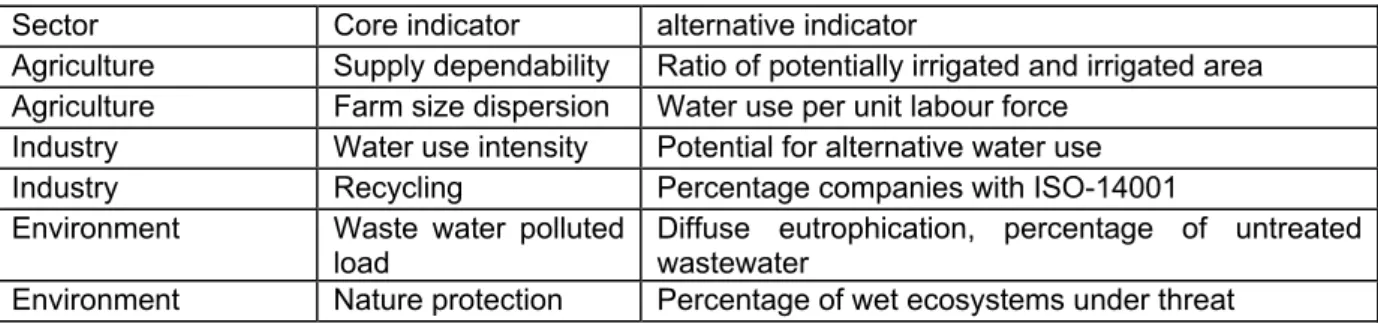
From Table 2 it follows that useful information could be found for 17 out of 25 indicators. The asterisks mark the indicators for which alternative indicators were employed in the absence of data on the core indicators. Table 3 below shows the associated core and alternative indicators. The usefulness of some alternative indicators may be questionable. For example the percentage companies with ISO 14001 is a proxy-indicator providing information about environmental aspects in general, rather than about water in particular.
CemOA
: archive
ouverte
d'Irstea
Doc Name: Deliverable ID: WP 2.1 D2.1-4.pdf Date: 14/02/2008
Dissemination level: PU – Final Report 8
Table 3: Alternative indicators
Sector Core indicator alternative indicator
Agriculture Supply dependability Ratio of potentially irrigated and irrigated area Agriculture Farm size dispersion Water use per unit labour force
Industry Water use intensity Potential for alternative water use
Industry Recycling Percentage companies with ISO-14001
Environment Waste water polluted
load
Diffuse eutrophication, percentage of untreated wastewater
Environment Nature protection Percentage of wet ecosystems under threat
Based on the values shown in Table 2, the Water Stress Index was calculated in the following steps: The sectoral indicators were weighted and summed to ISWSF (see Figure 1). The environmental sector was assigned a weight of 1, while the remaining sectors were weighted according to their water use as a fraction of the total. These relative water uses were 46% for the domestic sector, 48% for agriculture, 5% for industry, and 1% for tourism. The resulting ISWSF was 0.57.
ISWSF divided by the potential margin yields the WSF. The calculated potential margin ranged from 0.02 to 0.18, and turned out to be greatly influenced by assumptions of (notably) evapotranspiration. As a consequence, the resulting WSF varies by a factor 9. It is concluded that WSF is very sensitive to the potential margin and uncertainties therein, notably at low values. Conversely, a change in the value of one single indicator does not affect the overall result to a great extent, because the effect is dampened out by the weighting procedure. This provides the WSF-approach with some degree of robustness, provided that values for a sufficient number of meaningful indicators can be retrieved. The sensitivity of the WSF to seasonality was also assessed, by considering only the summer period (June through August) in stead of the entire year. While the overall effect on WSF remains limited to an increase of 7%, it clearly changes the sectoral contributions, as shown in the Figure 1. Agriculture and tourism become more important, illustrating the importance of carefully choosing the proper period for analysis.
CemOA
: archive
ouverte
d'Irstea
Figure 2: Sardinian Case Study Variations 0.00 0.10 0.20 0.30 0.40 DOMESTIC AGRICULTURE INDUSTRY TOURISM ECOSYSTEMS Entire year Summer (June through August)
Moroccan Case Study
The Tadla region in Morocco is located about 200 km South-East of Casablanca at an altitude of 400 m and has a mean annual precipitation of 300 mm. The cropped area in Tadla is approximately 10,000 km2. The significant proportion of it is irrigated from two dams (with a total capacity of almost 2 billion cubic meters -BCM). Groundwater irrigation is also growing, but the scale of it has not been assessed. Over 12% of Morocco national production of both citrus and olives are produced in Tadla irrigated area, together with some 23% of nationally produced sugar beet. 82% of the fields have an area less than 5 ha and occupy 34% of the total area, while 3% of fields have an area more than 20 ha and occupy 34% of the total area. Tadla presents a variety of water stress problems which concern surface water scarcity, groundwater resources depletion, water pollution and more. Moreover, some national strategies for water stress mitigation are currently undergoing in the Tadla as is the case of the whole of other large scale irrigated perimeters in Morocco.
The calculations of the WSF in the Moroccan case study were done in the same way as explained in the Sardinian case study. One of the main disparities to the test site in Sardinia was the different sectors that play a role in this test site: the domestic and the agricultural sector. The Tadla test site also represents one of this test sites where difficulties getting data aroused as the main constraint for calculating the WSF. As table 4 shows, we were only able to get data for the domestic and the agricultural sector because the other water consuming sectors are not developed. Regarding the environment, as in many developing countries, data at the local level are not available.
The most important issue in Tadla case study concerns water availability for irrigation. At the beginning of the creation of the perimeter, the irrigated area was very small compared to the hydraulic capacity of the system. This lead to an excessive use of water and to an artificial recharge of the superficial aquifer. In some places of the perimeter it has even been necessary to drain lands. With the development of the irrigated area, artificial groundwater recharge also reduces proportionally to
Doc Name: Deliverable ID: WP 2.1 D2.1-4.pdf Date: 14/02/2008
Dissemination level: PU – Final Report 9
CemOA
: archive
ouverte
d'Irstea
Doc Name: Deliverable ID: WP 2.1 D2.1-4.pdf Date: 14/02/2008
Dissemination level: PU – Final Report 10
the increase in the irrigation efficiency (lower consumption per hectare). In the same time, the aquifer did allowed to irrigate when there where restriction in the water allocation for the surface water. Surface and groundwater where then complementary resources. But drought become structural and the use of groundwater where the only solution to maintain the quantity of water at the field level. This leads to an increase in the investments in borehole and to groundwater depletion. Groundwater does not play any more its initial role of insurance against occasional drought. The main problem comes from the reduction of the water allocation to the canal system that seems to be permanent now and induce behaviours consisting in drilling deeper and deeper, risking to challenge domestic consumption. Regarding the domestic sector, because of the rapid urban population increase and the fact that it is too costly to develop public infrastructure in rural area, only 15% of the population is connected to an effective sewage system. (Loubier S. et al., 2008) (compare table 4).
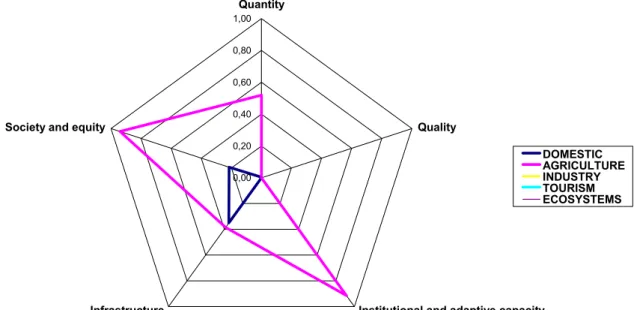
Table 4 and graphic representation: Indicators results for the Tadla test site
DOMESTIC AGRICULTURE INDUSTRY TOURISM ENVIRONMENT
Quantity issues 0,00 0,52 NN NN NN
Quality issues 0,00 0,00 NN NN NN
Institutional and
adaptive capacity 0,00 0,91 NN NN NN
Infrastructure 0,35 0,39 NN NN NN
Society and equity 0,22 0,94 NN NN NN
Differently as in Sardinia, no alternative indicators to the core indicators were used. Additionally the core indicators were approved by local stakeholders through cross-checking of every indicator and its statement with the understanding of the stakeholders. No weight was given to the sectors and no seasonality was included due to the fact that water needs do not changes considerably with seasonality.
In figure 3 we see that the results of the calculation in the case of Tadla do reflect the described problematic. Those results can be used to evaluate the relative water stress interdependency to the double sectoral water stressors – domestic and agriculture - and its interactions. We can see that while the main stressors in the agricultural sector are in the category of “society and equity” and “institutional and adaptive capacity”, in the domestic sector the category of “infrastructure” embodies
the main deficiencies of the sub-system. CemOA
: archive
ouverte
d'Irstea
Figure 3: Water Stress Characterisation for the Agricultural and Domestic Sector in Tadla 0,00 0,20 0,40 0,60 0,80 1,00 Quantity Quality
Institutional and adaptive capacity Infrastructure
Society and equity
DOMESTIC AGRICULTURE INDUSTRY TOURISM ECOSYSTEMS
In regard to the domestic sector, for example, the figure 3 shows the reality of the area where the insufficiency of the liquid sanitation network is one of the main causes of the development of diseases like viral hepatitis, cholera, typhoid and diarrhea (comp.
http://www.matee.gov.ma/onem/monographie_centre.htm) .
Discussion
Despite the relative abundance of water use and water stress information in central databases such as Istat and Eurostat, additional local information and knowledge has proved to be essential to establish a realistic WSF, and to characterise the local water stress reliably. A combination of both data sources is recommended: local information to better pinpoint the water stress problem, and regional, centralized data to position the local situation in a regional or (inter)national context. Local data should be more relied on if the purpose is to transfer local experiences in combatting water stress to other, less experienced regions. Regional data may be more relied on in the context of policy making on national or supranational levels, for example by generating maps of WSF or ISWSF per administrive region. With this respect it should be noted that the ultimate value of the presented analysis is yet to be judged by the local project partners. However, the purpose of this paper is rather to share experiences in applying the WSF approach and finding the appropriate data.
Given the relative abundance of information for Italy within the Istat databases, it is expected that in other countries like Morocco more information must be collected locally. This would limit possibilities for cross-regional or –national comparisons between water stressed sites.
What is really needed to make the WSF-approach useful in practice?
A uniform, pan-European dataset of meaningful core indicators as shown in Table 1,
Doc Name: Deliverable ID: WP 2.1 D2.1-4.pdf Date: 14/02/2008
Dissemination level: PU – Final Report 11
CemOA
: archive
ouverte
d'Irstea
Doc Name: Deliverable ID: WP 2.1 D2.1-4.pdf Date: 14/02/2008
Dissemination level: PU – Final Report 12
inclusion of indicators on mitigation options, and their success, in this dataset, a normalisation of WSF to make the approach easier to communicate.
A definition of the biogeographic regions for cross-regional comparison
A comparison of weights given by different stakeholder groups could be also a good demonstration tool for a same test-site. Although this was out of the scope of this paper, weights can changes the perceptions of water stress for an area. Therefore we recommend the exercise for the future to test the WSF against different weights given by different stakeholder groups
In all we consider the WSF a good instrument for fast assessment for policy purposes in small catchments because due to the structure of the framework by sector it is easier to recognize the source of the change and the source of water stress.
Conclusion
The main challenge of European water policy is centered in the good ecological and chemical status of its waters. The European Informal Council of Environment Ministers declared that an integrated approach is needed to address the water scarcity and droughts challenge. They suggest an approach that integrates supply, use and demand. With the WSF we demonstrate a tool that has the capacity to be used for this approach.
The problems of water availability in our case studies do not differ that much from the factual problems we are suffering in Europe but also around the world. Water stress results not only from water scarcity but also from water contamination or like in Morocco from mismanagement of water resources. Despite the predictions about losses of the water supply due for example to exaggerated leakage, one of the main problems that we are facing is the delivery of enough water to the main water consumer sector, e.g., the agricultural sector.
A first step for solving the problems of “getting enough water” for the different water consuming sectors is to detached the sectors demands and supplies as we have done with our WSF and to be able in that way to address the sub-problems belonging to a particular sector and to a particular subtheme of a sector. Only so we will be able to address with the suitable mitigation option the problem this sector is suffering.
Gustavson et al.(1999) made the remark that “greater focus is required on modeling frameworks that can use incomplete data sets or qualitative information”. Adding to their affirmation, when using the WSF following issues should be taken into account:
Our framework is more appropriate for qualitative modeling of different policy alternatives, rather than for predictions based on specific indicators.
Data requirements at the local level imply a high dependency in time and money resources. Often the only possibility to get data is to find estimations based on higher levels of aggregated data.
Contrary to the current in use frameworks for assessing water stress, we focus on a small number of indicators with their particular indicators-clusters: water quantity, water quality, institutional and adaptive capacity, infrastructure and social and economic equity (comp. table 1). There are some examples in other river basin that reveal that a large number of indicators do not automatically improves the consistency of models to provide policy guidance. (comp.(Gustavson et al., 1999)
Concluding and after having reflected on our case studies, we can add that the WSF and other frameworks for assessing water stress are far from representing or predicting the reality of the water consuming sectors under the uncertainty attached to the element “water”. Even less when the policies
CemOA
: archive
ouverte
d'Irstea
Doc Name: Deliverable ID: WP 2.1 D2.1-4.pdf Date: 14/02/2008
Dissemination level: PU – Final Report 13
dominating the water consuming sectors (e.g. common agricultural policy) are unpredictable in their consequences to the water household. Therefore it is inappropriate to create a framework for assessing water stress that would just make predictions.
In this regard the WSF reaches our expectations: to evaluate the relative water stress of the case studies to multiple sectoral water stressors and to identify in which particular sector, under which particular category the stressors are located. In that way the possibility to address the water scarcity problems by their sources are higher due to the differentiation than in a single number index.
Acknowledgements:
We thank the AquaStress Project “Mitigation of Water Stress through new Approaches to Integrating Management, Technical, Economic and Institutional Instruments” (Proposal/Contract no.: 511231-2), for the economic and scientific support.
CemOA
: archive
ouverte
d'Irstea
Doc Name: Deliverable ID: WP 2.1 D2.1-4.pdf Date: 14/02/2008
Dissemination level: PU – Final Report 14
Reference:
Bossel, H. (1999). Indicators for Sustainable Development: theory, methods, applications. A report to the Balaton Group. Manitoba, Canada: International Institute for Sustainable Development.
Caeiro, S., Patinho, M., Costa, M. H., & Ramos, T. B. (1999). Sado Estuary Ecosystem: A management methodology. Paper presented at the International Conference on Sustainable Management of Coastal Ecosystems, Porto, Portugal.
Gustavson, K. R., Stephen C.L, & Ruitenbeek, H. J. (1999). Selection and modeling of sustainable development indicators: a case study of the Fraser River Basin, Britisch Columbia. Ecological Economics(28), 117-132.
Jorge, M. R., Lourenço, N., Machado, C. R., & Rodrigues, L. (2002). Measuring, monitoring and managing sustainability in Indian coastal areas: the socioeconomic dimension. Paper presented at the Littoral 2002. The Changing Coast
Loubier S., Hammani A., Mailhol J-C., Preziosi E., Inman D., Wyngaert I., et al. (2008). Report: State Of Water Stress in Different Sectors in the Test Sites Areas and Current Strategies to Cope with Water Stress. Tadla, Morocco: AquaStress Project.
Pahl-Wostl, C. (2002). Towards sustainability in the water sector- the importance of human actors and processes of social learning. Aquatic Sciences, 64, 394-411.
Preziosi, E., Bauer, M., Koundouri, P., Tarnacki, K, Vivona,R., Van den Wyngaert, I. (2008). Report: State Of Water Stress in Different Sectors in the Test Sites Areas and Current Strategies to Cope with Water Stress. Sardinia: AquaStress Project.
Rekolainen, S., Kämäri, J., & Hiltunen, M. (2003). A conceptual framework for identifying the need and role of models in the implementation of the Water Framework Directive Intl. J. River Basin Management, 1(4), 347-352.
Sullivan, C., Meigh, J., & Lawrence, P. (2005). Application of the Water Poverty Index at Different Scales: A Cautionary Tale. Agriculture Ecosystems and the Environment.
Sullivan, C. A., Manez, M., Schmidt, S., Moors, E., Preziosi, E., Loubier, S., et al. (2007). Report on Water Stress Indicators: AquaStress Project.
Sullivan, C. A., Meigh, J. R., & Fediw, T. S. (2002). Derivation and Testing of the Water Poverty Index Phase 1. Final Report May 2002. Volume1 - Overview. Oxfordshire: Centre for Ecology & Hydrology. Wilson, E. O. (1998). Consilience: The unity of knowledge. New York: Alfred A. Knopf INC.
CemOA
: archive
ouverte
d'Irstea
Annex
Table 5: out of the D2.1-3 (online available)
The Water Stress Index (WSI) is generated through a combination of two parts: the Integrated
Sectoral Water Stress Index (ISWSI), which captures the level of water stress in the different
sectors, and the Potential Margin (PM), which is an assessment of the available water resource supply. The potential margin indicates the degree of dependency on local and imported water, and the safety margins remaining available. By combining these two together, the WSI is derived as follow:
PM
ISWSI
WSI
=
[1]The two components of the WSI thus incorporate the demand and the supply elements of the water situation, and are represented respectively by the ISWSI and Potential Margin (PM). First component of the WSI
The Integrated Sectoral Water Stress Index, (ISWSI) shows the level of water stress across the different sectors and the type of stress associated with each sector. The major anthropogenic sectors to be considered within water management decisions are: domestic, agricultural, industrial, and tourism (which also includes services). In addition to these four sectors the environment is included, to ensure that a certain degree of water is allocated to the environment to enable ecological integrity.
For each of these five sectors the possible sources of stress have been identified and summarized in five categories:
water quantity, water quality,
institutional and adaptive capacity, infrastructure and
social and economic equity.
The ISWSI has been constructed using is a composite index approach:
E T i Ag D E E T T I I Ag Ag D D
w
w
w
w
w
I
w
I
w
I
w
I
w
I
w
ISWSI
+
+
+
+
+
+
+
+
=
[2]Where wi is the weight given to the sector i. We agreed that
0
<
ISWSI
<
1
Ii is the water stress index for each of the component sectors, ie. Domestic (D), Agriculture (Ag), Industry (T) Tourism services (T) and the Environment (E).
Doc Name: Deliverable ID: WP 2.1 D2.1-4.pdf Date: 14/02/2008
Dissemination level: PU – Final Report 15
CemOA
: archive
ouverte
d'Irstea
The indicators are first normalised to values between 0 and 1 and then aggregated to form a
Sectoral Water Stress Index. Each of the sectoral water stress indices is also a composite
index, made up of selected indicators (one or more for each category). Since the structure of indicators suggests that the sensitivity of the model to any one indicator will be relatively small, slight variations in any one of the indicators chosen should not create a significant impact on the overall ISWSI score.
Second component of the Water Stress Matrix: PM
The concept of the Potential Margin aims to represent how close the water resources system is approaching its natural endowment limits, including, where relevant, any imported water. The Potential Margin (PM) is calculated as a ratio between the RRR (as defined above) and the supply side of the water balance (NBE+IMP):
IMP
+
NBE
RRR
=
PM
o
< PM
<
1
This measure is based on the components of a simple water balance:
RRR
EXP
TER
IMP
NBE
+
=
+
+
Where:NBE = the total Natural Baseline Endowment. This refers to all naturally available water
resources for any site or area, which should include both renewable surface water and groundwater. It should take into account all the components of the balance which are naturally available due to the effective precipitation inside the test site area, as well as all the waters which enter naturally into the system: river discharge from upstream, groundwater flow (potentially usable), spring discharge, etc.
IMP = imports (geographical movement of water to the site). This includes the water which is
imported from outside the test site (diversions, desalinated water etc).
TER = Total Exploited Resource. It represents the water which is currently withdrawn for use
(consumed or eventually given back to the system) inside the test site by human activities (domestic, industrial, agricultural). The environmental water needs inside the test site should be included as well. This amount will depend on a ‘political’ decision, and it will affect ecological conditions locally; and downstream. Requirements to preserve environment downstream is included in the export (EXP) component.
EXP = exports. This considers the volume of water which is committed to downstream users
including the environment.
RRR stands for Residual Renewable Resource. This is the amount of water in the test site that
is left in the local system, which has not been yet consumed by local or downstream users. This amount is obtained subtracting both TER and EXP from NBE and IMP:
)
+
+
=
NBE
IMP
TER
EXP
RRR
-
(
NBE + IMP are what would be defined in Economics as supply; and TER + EXP demand.
Doc Name: Deliverable ID: WP 2.1 D2.1-4.pdf Date: 14/02/2008
Dissemination level: PU – Final Report 16
CemOA
: archive
ouverte
d'Irstea
Doc Name: Deliverable ID: WP 2.1 D2.1-4.pdf Date: 14/02/2008
Dissemination level: PU – Final Report 17
To clearly define the water resources of a specific site, the following is taken into account: boundaries of the surface and groundwater system, time variability in connection with change (e.g. climate change) and temporal representativeness (e.g. droughts and floods).
CemOA
: archive
ouverte
d'Irstea