HAL Id: hal-01989664
https://hal.archives-ouvertes.fr/hal-01989664v2
Submitted on 22 Jan 2019HAL is a multi-disciplinary open access archive for the deposit and dissemination of sci-entific research documents, whether they are pub-lished or not. The documents may come from teaching and research institutions in France or abroad, or from public or private research centers.
L’archive ouverte pluridisciplinaire HAL, est destinée au dépôt et à la diffusion de documents scientifiques de niveau recherche, publiés ou non, émanant des établissements d’enseignement et de recherche français ou étrangers, des laboratoires publics ou privés.
Lateral variations of the midcrustal seismicity in western
Nepal: Seismotectonic implications
R. Hoste-Colomer, L. Bollinger, H Lyon-Caen, L. Adhikari, C. Baillard, A.
Benoit, M. Bhattarai, R. Gupta, Eric Jacques, T. Kandel, et al.
To cite this version:
R. Hoste-Colomer, L. Bollinger, H Lyon-Caen, L. Adhikari, C. Baillard, et al.. Lateral variations of the midcrustal seismicity in western Nepal: Seismotectonic implications. Earth and Planetary Science Letters, Elsevier, 2018, 504, pp.115-125. �10.1016/j.epsl.2018.09.041�. �hal-01989664v2�
1
TITLE: Lateral variations of the midcrustal seismicity in western Nepal:
1seismotectonic implications
2AUTHORS and Affiliation:
3Hoste-Colomer, R.
1,2,
Bollinger, L.
1, Lyon-Caen
2, H., Adhikari, L.B.
3, Baillard, C.
1,2, Benoit, A.
1,2,
4
Bhattarai, M.
3, Gupta, R.M.
3, Jacques, E.
4, Kandel, T.
3, Koirala, B.P.
3, Letort, J.
1,2, Maharjan,
5
K.
3, Matrau, R.
4, Pandey, R.
3and C. Timsina
3.
6
Corresponding author: hoste.roser@gmail.com
7Address:
81
CEA, DAM, DIF, F-91297 Arpajon, France
9
2
Laboratoire de Géologie, Ecole Normale Supérieure/CNRS UMR 8538, PSL Research
10
University, Paris 75005, France
11
3
Department of Mines and Geology, National Seismological Center, Kathmandu, Nepal
12
4
Institut de Physique du Globe de Paris, Sorbonne Paris Cité, Université Paris Diderot, UMR
13
7154 CNRS, Paris, France
14
Highlights
15- First temporary seismological network in western Nepal resolves the local earthquakes
16
hypocentres along the downdip end of locked segments of the Main Himalayan mega-Thrust
17
(MHT).
18
2
- Clustered seismicity develops at the intersection between the megathrust and contacts
19
between Lesser Himalayan tectonic slivers.
20
- Seismic swarms migrate at 50 m/day at the transition zone.
21
- The local earthquakes reveal ramps and flat geometry of the megathrust highlighting a new
22
segmented fault model for West Nepal.
23
3
Abstract
25
The midcrustal seismicity along the Himalayas depicts some lateral variations. This seismicity
26
is often related to stress build up, at depth, along the downdip extent of the fault segments
27
producing large and great earthquakes. To better characterize these variations, we deployed
28
the first temporary seismological network in West Nepal (HiKNet)
for a period of 2 years
as a
29
complement to the Nepalese national network. We used automatic picks, manually
30
validated, to perform absolute and relative location of the earthquakes. The resulting
31
catalog contains 2190 local events, shallow to midcrustal (8 – 16 km). The
comparison
32between the seismicity and the geologic balanced cross-sections shows that most
33
earthquakes occur within the
hanging wall
of the Main Himalayan Thrust fault nearby ramps
34
or suspected contacts between Lesser Himalayan slivers. Some of the events associated with
35
these geological structures are clustered within weeks-long earthquake swarms with seismic
36
envelopes migrating at 35-50 m/day. These transients are possibly related to fluid migrations
37
or geodetically unresolved slow slip events. The lateral variations of some of the structures
38
associated to this seismicity are likely partially controlling the extent of the coseismic
39
ruptures during intermediate earthquakes that break partly the locked fault zone, in a similar
40
way to what was reported after the Mw7.8 2015 Gorkha-Nepal earthquake. A better
41
characterization of the faults segmentation
, including a better location and extent of the
42seismogenic segments at depth,
is an important input for seismic hazard studies.
43
44
4
1. Introduction
46
Large and great earthquakes
(respectively M7+ and M8+)
often coexist along oceanic and
47
continental subduction zones, partially or totally rupturing the locked updip-end of the
48
megathrust fault systems. The endpoints of these earthquake ruptures can sometimes be
49
related to the presence of persistent rupture barriers, which prevent rupture from
50
propagating from one fault segment to another along the thrust fault system. The most
51
frequently invoked causes for their existence, along-strike and downdip, have been
52
associated to local mechanical properties or structural reasons. Indeed, some of these
53
barriers along oceanic subductions fall within regions of low interseismic coupling at the
54
periphery of locked fault patches (e.g. Prawirodirdjo et al., 2010; Métois et al., 2012 ; Saillard
55
et al., 2017), with a mechanical behavior that may reflect the influence of the thermal and
56
petrophysical structures (e.g. Satriano et al., 2014). They are also likely to be influenced by
57
the geometry of either the subducting slab and/or the overriding plate (e.g. Dominguez et
58
al., 1998; DeShon et al., 2005).
59
Despite the many studies conducted along strike in the Himalayas, the most iconic of the
60
continental subductions, the Main Himalayan Thrust (MHT) system segmentation remains
61
poorly understood. However, historical studies and paleoseismological surveys in
central-62
eastern Nepal revealed the coexistence of both large and great earthquakes, partially or
63
totally rupturing the ~90 km-long locked fault zone from its downdip end to the surface
(e.g.
64in Bollinger et al., 2016; Wesnousky et al., 2017)
. Furthermore, the presence of subducting
65
basement highs and basins, and lateral variations of the Lesser Himalaya structure and
66
exhumation, suggest the presence of a strong and persistent mechanical and structural
67
heterogeneities along the plate boundary (e.g. Bollinger et al., 2004; VanDerBeek et al.,
5
2016). Finally, the study of the 2015Mw7.8 Gorkha earthquake revealed that its rupture was
69
influenced by structural heterogeneities (Hubbard et al., 2016; Wang et al., 2017). Some of
70
these along-dip and along-strike MHT heterogeneities appear to be revealed by the close
71
examination of the midcrustal seismicity- produced during the interseismic and/or
post-72
seismic periods (Letort et al., 2016; Baillard et al., 2017; Hoste-Colomer et al., 2017). The
73
almost continuous midcrustal seismicity belt described along the whole Himalayan range
74
(e.g. Pandey et al., 1995; Kumar et al. , 2006; DelaTorre et al., 2005 ; Monsalve et al., 2006 ;
75
Mahesh et al., 2013 ; Diehl et al., 2017), may therefore reveal other structural
76
heterogeneities and/or possible variations in stress build up. The region encompassing the
77
largest spatial variations is located in Western Nepal, in the supposed trace of the great
78
1505AD earthquake
(e.g. Yule et al., 2006; Hossler et al., 2015; Bollinger et al., 2016)
, a
79
region that has never been monitored previously using a dense local seismological network.
80
The
Birendranagar
Regional Seismological Center (RSC),
Surkhet
, has been monitoring there
81
the seismicity since 1994 locating more than 20 000 local earthquakes
with a network of up
82to 9 stations
(Figure 1)
. The midcrustal seismic pattern appears rather heterogeneous
83
(Pandey et al., 1999)
, the seismicity being distributed in a pitchfork shape with three
84
seismicity belts: Bajhang (west), North Karnali (northeast) and South Karnali (southeast)
85
(Figure 1). However, the relation between this seismicity and the local structures is unclear
86
because of the large uncertainties associated to the depth of the local earthquakes.
87
In order to better resolve the relation between the regional seismicity and the geological
88
structures, we deployed a temporary seismological network above the midcrustal seismic
89
clusters in Western Nepal for a period of two years. The records were processed using a
90
workflow including 1) automatic picking and primary locations, 2) manual picking
91
refinements and 3) double difference relocation. We then analysed the results and
6
confronted them to the geological structures. The spatio-temporal distribution of the
93
seismicity allows us to interpret the seismotectonic context and propose a segmentation
94
schema of West Nepal
.
95
2. The Himalaya Karnali Network (HiKNet)
96The Himalaya Karnali NETwork was deployed from November
,
2014 to September
,
2016
97
through Western Nepal. The network geometry was defined according to the distribution of
98
the seismicity and by maximizing logistic efficiency to install and revisit the remote sites
99
(Figure 1). The network was made of 15 seismic stations distributed in 3 sub-arrays with an
100
inter-stations distance set to the expected depth of the earthquakes (~10-20 km). This
101
condition was well respected for the western and southern belts. However, because of the
102
difficult accessibility to the northern area and the limited number of stations, we privileged a
103
group of 4 stations
(MA10, GH25, SJ26, JL27)
as close as possible to the seismicity of the
104
North Karnali seismicity belt as well as an additional station north
(SM15)
in order to enlarge
105
the aperture of the network. The network was composed of 8
Güralp
CMG40 and 7
Lennartz
106Le3D5s intermediate period seismometers, coupled to Nanometrics Taurus digitizers. The
107
instruments were protected from monsoon rain and animals (see monument details in
108
Hoste-Colomer, 2017). Sites of the stations were close to the bedrock, south orientated and
109
relatively far from local noise sources. Because telemetry was not an option given the
110
telecommunication availability in the remote regions covered by the network, the status of
111
the stations and the signals recorded were only known after revisits of the stations (3 revisits
112
were scheduled: April
,
2015, October
,
2015 and April
,
2016 before dismantling). During the
113
first year, almost all stations recorded continuously during the dry season while 1/3 of them
114
failed after the first revisit or during the summer monsoon. The second year of deployment,
7
most of the stations recorded continuously even during the summer monsoon. Technically,
116
no major problems affected the stations (See Supplementary Material S1).
117
In this study we processed the data from
December 1, 2014
and
October 10, 2015
118(Supplementary Figure S1)
. In addition to the signals acquired at the temporary stations, we
119
benefited from the data recorded at the seismic stations by the RSC permanent
120
seismological network for the same period of time. Combining both networks allowed us to
121
increase the number of stations to 24.
122
3. Methods
123First, we pre-processed the seismic records with an automatic procedure applied using
124
Seiscomp3 developed by GEOFON program, Helmholtz Centre Potsdam, GFZ German
125
Research Centre for Geosciences and Gempa GmbH.
We run Seiscomp3 using the off-line
126mode.
For this step we used LocSat locator and iasp91 velocity model within the workflow
127
described in Supplementary Material S2. The magnitude of the seismic events is the local
128
magnitude (MLv) obtained by measuring the maximum amplitude on the vertical component
129
(see Seiscomp3, 2013).
130
In order to refine the hypocenters within the seismic catalog,
we revised manually the phase
131picks
and we relocated the events with the Hypo71 locator (Lee and Lahr, 1975) using the
132
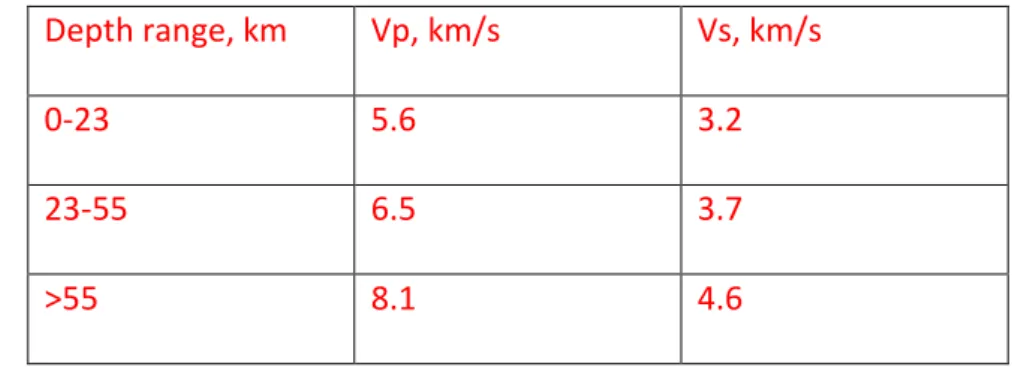
local velocity model used at the Nepalese Regional Seismological Center (Pandey, 1985;
133
1995,
See Table in supplementary data
).
We weighted the stations depending on their
134epicentral distance.
1358
Earthquakes from the revised catalog appeared then to be locally spatially clustered (Figure
136
2). Earthquakes inside these clusters were further relocated using the double-difference
137
algorithm HypoDD (Waldhauser and Ellsworth, 2000).
138
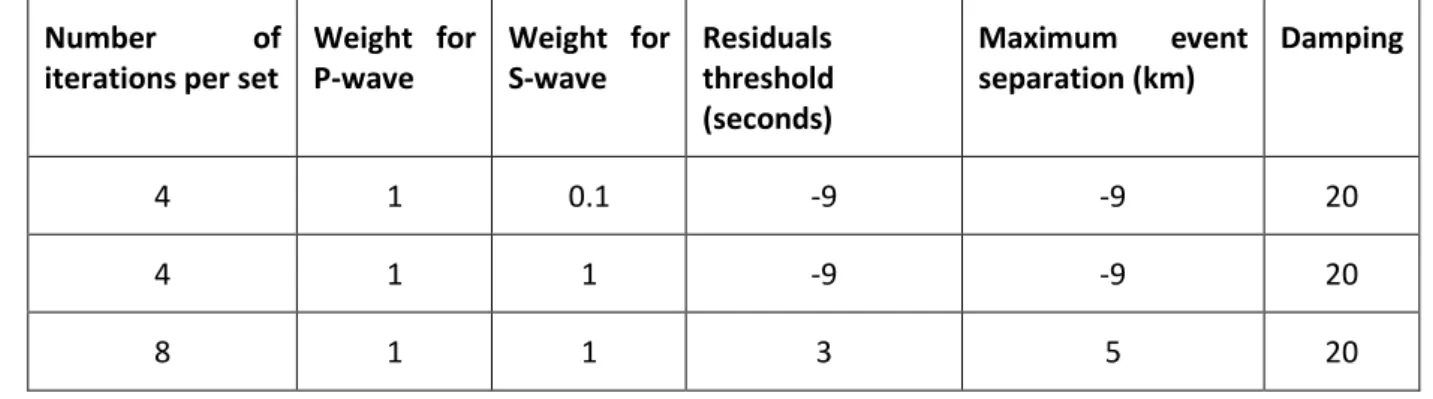
The first step in the relative relocation is the selection of pairs of events at every station. We
139
select for Zone S and Zone W (Figure 2) pairs of events with a maximum hypocentral
140
distance of 5 km and a maximum number of neighbors per event of 10, limiting as much as
141
possible the pairs to the closest neighbors. Moreover, in order to define an event as a
142
neighbor, we set a minimum number of links of 12 for Zone W and 10 for Zone S (Figure 2).
143
These values are rather conservative. The set of stations taken into account also influences
144
the relocation process. Here we limited the distance between the event pair and the station
145
to 80 km in Zone W and 70 km in Zone S. These distances are suitable to focus on the data of
146
the closest stations and to keep a good azimuthal coverage of stations over an event pair.
147
The second step is the relocation itself. The same set of parameters was used for Zone W
148
and Zone S. We performed the relocation using P- and S-phases, the velocity model of
149
Pandey (1985), and we resolve the relative relocation using the LSQR inversion. We define
150
three sets of iterations described in Supplementary Material S2. Note that we relocated
151
individually each cluster.
152
153
4. Results and Discussion
1544.1. Characteristics of the seismicity catalog
1559
Among the 6500 earthquakes detected automatically between
December 1, 2014
and
156
October 10,
2015
, 2190 earthquakes reviewed manually fall in close proximity to the
157
network. The quality and density of the hypocenters are variable depending upon their
158
position within the seismic network. Indeed, the best located events and the highest rates of
159
events are in Zone W and Zone S, two regions with respectively 9 and 4 seismic stations
160
(Figure 2).
161
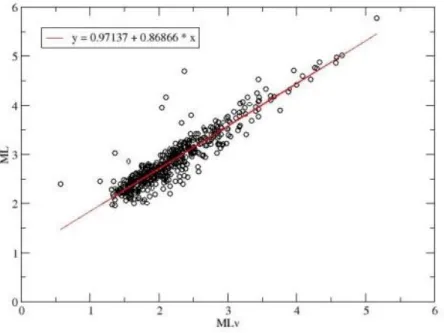
The magnitude MLv of the reviewed earthquakes ranges from 0.1 to 5.2, corresponding to
162
magnitude MLRSC
1.0 and 5.5 of the RSC catalog (Supplementary Material S3). Among these
163
earthquakes, 93 % were associated to magnitudes MLv≤2.0 and are therefore smaller than
164
the completeness magnitude (Mc) of the RSC catalog (Pandey, 1999) which is MLRSC~2.0. The
165
histogram shows a maximum number of events MLv~1.0, indicating that the Mc is larger or
166
equal to 1.0 (Figure 3). Moreover the Gutenberg-Richter (GR) distribution is linear from
167
MLv=4.4 until MLv=1.4 (Figure 3) where the curve
presents
a break-in-slope. Therefore we
168
estimate that the completeness magnitude of the catalog in MLv is approximately 1.4. The
b-169
value obtained for the entire catalog is 0.75+/-0.05 (Figure 3), which is in the range of
b-170
value (0.75-0.95) previously obtained by Pandey et al., 1999 from the permanent western
171
network catalog.
172
4.2. Lateral variations of the seismicity
173The spatial variations of the seismicity recorded during the first-year of the temporary
174
experiment include
most
of the spatial features revealed by the 30-years seismicity recorded
175
at the RSC network (Figure 1). Among them, the ‘pitchfork geometry’ of the midcrustal
176
seismicity clusters (Figure 2). It includes a main seismicity belt in Bajhang area which divides
10
eastward in two belts, in the river Karnali area. These two belts are labeled respectively
178
North and South Karnali seismicity belts.
179
During the first year of the temporary experiment, the Bahjang seismicity belt and the South
180
Karnali seismicity belt were particularly active, producing many well located events below
181
the network (Figure 2). These two seismicity belts show different characteristics, from their
182
position and extent along the Main Himalayan thrust fault to the depth of their events.
183
Indeed, the main seismicity belt in Bahjang area begins ~65 km north from the MFT and
184
extends northward over a mere 45 km spread (Figure 2). This seismicity belt appears
185
persistent, though dominated by the generation of a few seismic clusters (See section 4.5).
186
The hypocentral depths of the events fall within 10 and 18-20 km with an average around 13
187
km. The South Karnali seismicity is located significantly further south than the average
188
midcrustal seismic cluster, 40 km north from the MFT (20-30 km north from the MBT) and
189
extends northward only over a ~15 km-large region (Figure 2 and 4). The rate of earthquakes
190
is significantly lower than in the Bahjang belt, the seismicity appears sparser. Despite this
191
apparent discontinuity, its confrontation with the RSC catalog that covers the last 20 years,
192
suggests that this belt extends a parallel, a few kilometers south, from the trace of the
193
contact between the Dadeldhura klippe and the Lower Lesser Himalaya. The hypocentral
194
depths of the earthquakes there are significantly shallower with depths ranging from 8 to 15
195
km with an average around 10 km.
196
North of this southern Karnali seismicity belt, the network recorded few events within a
30-197
40 km-wide region which separates it from a North Karnali region where the seismicity was
198
found more scattered and comprising no seismic clusters
in the time period analyzed
(Figure
199
2). Note that the completeness magnitude of the catalog in this region is higher (Mc~1.5)
11
than in the regions previously described (see Supplementary Material S4). In addition, the
201
hypocenters are less resolved here due to a lower number of phases picked by events and a
202
larger azimuthal gap. Indeed, MA10, SM15, GH25, SJ26 and JL27 are further away from the
203
midcrustal cluster there than elsewhere within the seismic network (Figure 2). It is therefore
204
more difficult to characterize the geometry of this North Karnali seismicity belt with the data
205
available.
206
The first order spatial variations of the seismicity described above, from West to East, are
207
accompanied by significant variations of the surface geology. Indeed, the geological surveys
208
which contributed to map the area documented lateral variations of the exposure and
209
geometry of the Lesser and Greater Himalayan rocks (Figure 4) as well as variations of the
210
faults and geological structures affecting them (e.g. Amatya and Jnawali, 1994; Robinson et
211
al., 2006).
212
Epicenters are mostly located within zones where Lesser Himalayan rocks are exposed
213
(Figure 4). These zones specifically correspond to regions where antiformal stacks of Lesser
214
Himalayan slivers developed. Large klippen of Greater Himalayan rocks affinity – among
215
them the large Dadeldhura klippe - were preserved within large perched synclinoriums in
216
between these zones of prominent Lesser Himalayan antiforms.
217
We therefore focus on possible relations between the seismicity and both active and
218
inherited tectonic structures.
219
We document these relations hereafter through two cross-sections within the seismicity: a
220
western cross section through the Bahjang seismic cluster and a second cross section further
221
east, in the Karnali river area, through the Northern and Southern Karnali seismic clusters.
12
Both are confronted to the balanced cross sections of Robinson et al., 2006, deduced from
223
the surface geological and structural mapping.
224
4.3. Seismicity and its relation with structures at depth, Western cross section
225The hypocenters projected on the western cross-section, through a 20 km-swath of the
226
seismicity crossing Chainpur-Bahjang (RB-RBB cross section Figure 4), fall between 9 and 18
227
km, at short distance from the MHT trace deduced from the balanced cross-sections (Figure
228
5). The depth is also similar to the ~15 km-deep Low Velocity Zone imaged from receiver
229
function analysis below Bajhang area, interpreted to coincide with the MHT shear zone at
230
depth (Subedi et al., 2018). Note that both observations on the depth of the MHT in the
231
region are similar but determined independently. The depth of the MHT along this section is
232
therefore estimated to be reliable.
233
Most of the hypocenters are spread over a distance of approximately 40 km falling mainly in
234
the vicinity of the lower decollement level of the MHT or at close distance within its hanging
235
wall (Figure 5). Indeed, the southern extent of this 40 km-long seismicity spread, composed
236
of more than 400 small earthquakes clustered within a 7 km-long region at midcrustal scale,
237
coincides with the presence of a ~5 km-high midcrustal ramp, which separates the main
238
upper and lower flats of the megathrust system ( Robinson et al., 2006 ; figure 5).
239
Two smaller seismic clusters, incorporating respectively more than 100 and 300 events
240
within regions 1.5 and 3 km-long, located ~10 and 20 km northward, fall at the base of the
241
complex stack of Lesser Himalayan (LH) tectonic slivers. Their locations coincide with the
242
suspected position of contacts between the tectonic slivers of the hinterland dipping duplex,
243
which constitutes the main LH duplex of the balanced cross section (Figure 5a).
13
4.4 Seismicity and its relation with the structures at depth, along an Eastern cross section
245through the Karnali region
246As mentioned earlier, the seismicity eastward, in the river Karnali region, is different than
247
further west, in Bahjang area. The seismicity belt of the North Karnali region, poorly
248
represented in 2015 given the absence of intermediate events or seismic swarms, develops
249
110-160 km north from the MFT, below a northward embayment of the high topography.
250
The absence of dense seismic cluster developing there in 2015 as well as the uncertainties
251
associated to the hypocentral locations did not allow us to associate the seismicity to any
252
specific structures. However, the balanced cross-section proposed by Robinson et al., 2006
253
document the presence of a ramp, 120 km-north from the MFT, below a complex Lesser
254
Himalayan duplex which coincides approximately with the location of midcrustal North
255
Karnali hypocenters (Figure 5c).
256
Some of the events located by the temporary experiment could be related to the activation
257
of the ramp and or to seismicity located at the contact between LH tectonic slivers within at
258
least a section of the duplex that develops further North (Figure 5c). Some of the
259
intermediate earthquakes located there in the past where clearly thrust type events (e.g.
260
27/11/2001 mb5.5 and 5.3, source global CMT project), advocating for stress build up and
261
episodic ruptures on the Main Himalayan Thrust fault lower flat and/or the midcrustal ramp.
262
However, the northern part of this region, at least, presents also past earthquakes ruptures
263
on active transtensional faults that make the regional context rather complex (Nakata et al.,
264
1984; Murphy et al., 2014).
265
Southward, the downdip extent of the upper flat of the MHT, 85 to 110 km from the MFT,
266
was seismically quiescent in 2015. This observation confirms, at lower completeness
14
magnitude levels and with higher resolutions, the observations made by RSC (e.g. Pandey et
268
al., 1999) that this area was seismically quiescent – at least during the last 23 years covered
269
by the permanent network in the region.
270
Despite this quiescence, the South Karnali seismicity belt develops 40 km southward, less
271
than 30 km from the MBT. Further south, 3 clusters were documented in 2015. Two of them,
272
cluster KS for Kusapani and DK for Dailekh, are located within the 20 km-wide swath covered
273
by the Karnali cross section Figure 5c. They fall 12 km from each other and occurred at
274
similar distances from the leading-edge of the Dadeldhura Thrust sheet (Figure 5). On
275
average, the hypocenters of the Kusapani cluster were located 12.5 km-deep, 3 km deeper
276
than the earthquakes located below Dailekh (located 9 km-deep) (Figure 5). These
277
hypocentral depths are shallower and better constrained than the depths determined with
278
the permanent network for the southern Karnali belt. Indeed, four temporary seismic
279
stations were located above the two clusters, while the permanent network is not optimally
280
positioned for determining precisely the depth of the seismicity, the contributing stations to
281
the small earthquakes located in the south Karnali cluster being all positioned southward.
282
The relocated earthquake clusters fall within short distances from Robinson et al., 2006 Main
283
Himalayan Thrust upper decollement, with KS cluster slightly (3-4 km) in its footwall and DK
284
cluster on its main trace. These two clusters fall also below the main frontal antiformal stack
285
of LH rocks (Figure 5d). The northern limb of this antiform is the locus of a strong incision.
286
Harvey et al., 2015 described there a region of high denudation and mapped remnants of
287
uplifted flat surfaces (described at 3000-4000m) preserved northward on top of the
288
Dadeldhura klippe (Figure 5d). These observations complemented by the documentation of
289
strong incision along the northern rim of the Dadeldhura thrust sheet are consistent with the
15
present-day activity of a flat-ramp-flat-ramp-flat MHT at depth related to the recent
291
development of a young duplex horse 60 km from the MFT (Harvey et al., 2015).
292
The denudation of the reliefs at the southern rim of the Dadeldhura klippe documented by
293
Harvey et al., 2015 is focused slightly north of the KS and DK clusters epicenters (Figure 5).
294
The clusters fall also in between the southern rim of the Dadeldhura klippe to the north and
295
the axis of an anticlinal fold to the south (Amatya and Jnawali, 1994). This anticlinal fold is
296
mapped precisely between Kusapani and Dailekh clusters, an area along which this anticlinal
297
is prominent (Figure 5). This anticlinal and the young duplex horse that is suspected beneath
298
this area may develop above a local active ramp of the MHT. This structure is most probably
299
at the origin of the anticlinal fold mapped in the area. The local relations between this ramp,
300
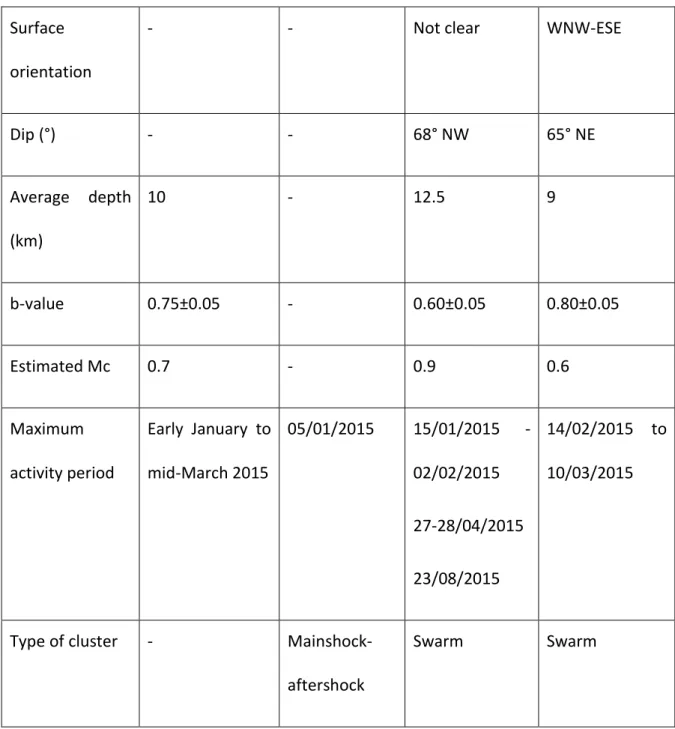
suspected at 10-15 km depths, and the seismic clusters located beneath Dailekh and
301
Kusapani are not easy to ascertain: the seismicity is discontinuous and its hypocenters do
302
not define a clear northward dipping plane but two 60° dipping planes respectively toward
303
the NE and NW for Dailekh and Kusapani. Note that this ramp is in a similar structural
304
position than the ramp mapped along the southern extension of the Gorkha earthquake
305
under the south western extension of the Kathmandu klippe (Khanal and Robinson, 2013;
306
Hubbard et al., 2016) or under the easternmost part of Nepal (Schelling and Arita, 1991).
307
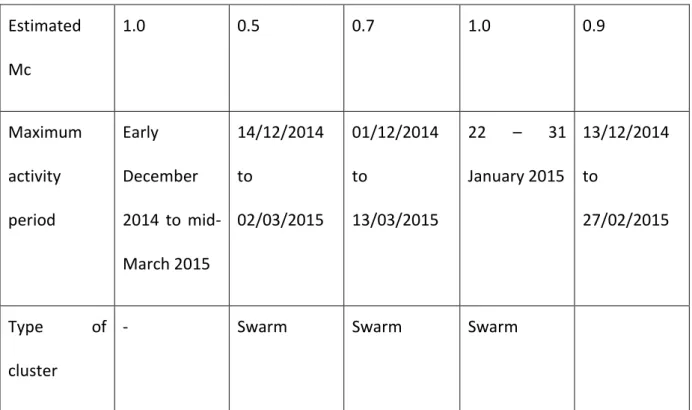
4.5. Seismicity impulses and migrations
308The spatiotemporal analysis of the catalog revealed several significant time variations of the
309
seismicity rate at regional scale. The seismicity rate above Mc, around 3 events per day
310
during the first month, suddenly increased in late January. It then reached a peak at 60
311
events per day on January the 22
ndand remained high during the following weeks. From
312
March to September 2015, the activity slowed down to ~1.5 events per day (Figure 6). A
16
closer look at local scale demonstrated that most of the local increases of the seismicity rate
314
are associated to the development of 6 main seismic clusters. None of these clusters
315
developed consecutively to the occurrence of the largest earthquakes (e.g. events with
316
ML>4 on Figure 6). In addition, the mainshock of each cluster never happened at the onset
317
of the local activity (e.g.
Figure 7
) and the clustered activity happened to migrate through
318
time. The best resolved example of migrations occurred within cluster A (29.50°N, 81.05°E).
319
The sequence of earthquakes began there on 14/12/2014 and migrated bilaterally. The
320
southeast and northwest-ward migrations of the envelope of earthquakes propagated
321
respectively during 36 and 14 days between 50 and 35 meters/day (
Figure 8
and 9). This
322
migration could be related to fluid diffusion or to the propagation of a local transitory slow
323
slip event along some sections of the MHT and/or at the contact between the tectonic slivers
324
in its hangingwall. However, to date, no transitory signal potentially related with slow slip
325
events have been detected within the cGPS time series available (e.g. Ader et al., 2012). This
326
suggests that, if these events exist, they are below the actual resolution of the cGPS velocity
327
field. The alternative or complementary scenario involving fluid diffusion is possible. Indeed,
328
the apparent migration velocities estimated are within the range of what was observed at
329
places where seismicity is suspected to be related to fluid circulation at the downdip end of
330
active fault segments (e.g. Duverger et al., 2015) (Figure 5). Scenarios involving a pore
331
pressure migration within 1D poroelastic model (Shapiro et al., 1997) reproduce the overall
332
evolution of the seismicity front, considering hydraulic diffusivities at 0.1 and 0.05 m
2/s.
333
These hydraulic diffusivities are within the range of values previously determined in similar
334
contexts (e.g. Pacchiani and Lyon-Caen, 2010; Duverger et al., 2015 and references herein).
335
Another argument supporting this scenario is that the presence of fluids at midcrustal
336
depths in this region is not surprising. Indeed, metamorphic fluids (brines, CO2, among
17
others) are suspected due to the metamorphic reactions occurring at depth. Their presence
338
is suspected to contribute to the high conductivity region observed in a similar structural
339
position under Kathmandu (Lemonnier et al., 1999) in the vicinity of a Low Velocity Zone of
340
the MHT (Nabelek et al., 2009). These fluids, migrating within the fractured/permeable
341
midcrustal environment of the MHT shear zone as well as along subsidiary faults in its
342
hangingwall, could explain, at least partially, the spatiotemporal evolution of the seismic
343
swarms.
344
4.6. Implications on the segmentation of the megathrust
345Midcrustal seismicity as well as the geology present lateral and downdip variations in
346
western Nepal probably related to along strike variations of the geometry of the MHT.
347
Significant variations in the deep geometry of the MHT could be responsible for a
348
segmentation of the fault rupturing at depth. The presence of barriers could influence the
349
rupture dynamics in a similar way than what has been described for the 2015 Gorkha
350
earthquake (e.g. Elliott et al., 2016; Hubbard et al., 2016; Baillard et al., 2017; Hoste-Colomer
351
et al., 2017).
352
We have several reasons to think that large and great earthquakes might coexist in west
353
Nepal, like they coexist in central Nepal where large and great earthquakes partially
354
(1833AD, 2015AD) or totally rupture the MHT (1255AD, 1344AD, 1934AD) (e.g. Bollinger et
355
al., 2016). Indeed, the region ruptured during the great earthquake (M8+) in 1505AD. This
356
event generated a coseismic slip locally greater than 20 meters (Yule et al., 2006) and a
357
rupture identified at three paleoseismological sites excavated from the Nepal-India border
358
until near Jajarkot klippe (Hossler et al., 2015), along more than 200 km-long stretch of the
18
range, 50 to 100 km from the brittle-ductile transition zone. This region also ruptured during
360
smaller earthquakes including the 1916 M7 earthquake (Bilham et al., 2017).
361
These observations are consistent with ruptures affecting large segments.
362
In Central Nepal, some structures at depth interfered with the progression of the coseismic
363
rupture of the Gorkha earthquake (Hoste-Colomer et al., 2017). Among these structures,
364
deep ramps along the MHT controlled the Gorkha earthquake rupture extent (Hubbard et
365
al., 2016). The pluri-kilometric MHT deep ramps (~4 km) which develop under the South
366
Karnali, below the southern extent of the Dadeldhura klippe or the southern extent of the
367
north Karnali window are therefore structures that most likely control the extent of
368
intermediate and/or large ruptures. This ramp is slightly more developed at depth than the
369
2-3 km deep ramp described by Hubbard et al., 2016 in Kathmandu area. Therefore the
370
intermediate South Karnali ramp and the structural ramp under the North Karnali Lesser
371
Himalayan Duplex delineate three distinct segments / MHT flats in Karnali region (K1, K2, K3
372
on Figure 10). In Bajhang area the structural midcrustal ramp separates two flats : (B1) a
373
frontal part including the upper flat of the MHT, fully locked during last years and (B2) a
374
deeper flat underlying the Bajhang seismicity belt which falls within a transition zone
375
(partially locked and/or affected by fluid migrations and connected to the Karnali Zone).
376
The ramps between North and South Karnali areas (between K1 and K2 and K2 and K3)
377
would likely influence a frontal progression of an earthquake rupture in a similar way as the
378
southern deep ramp that was described along the southern extension of the Gorkha
379
earthquake rupture.
380
West of the Karnali region, in Bajhang area, the structural segmentation is less pronounced.
381
The area is more complex, comprising significant lateral variations affecting the geometry of
19
the Lesser Himalaya Duplex, lateral ramps and a complex succession of seismic clusters,
383
suggesting that this region is a transition zone between the Darchula and Karnali regions.
384
The surfaces of each of these segments (i.e. K1, K2, K3, B1 and B2) are approximately
385
comprised between the surfaces ruptured by the Kodari and the Gorkha earthquakes (Figure
386
10). A seismic slip deficit around 10 meters likely accumulated since the last great
387
earthquake in 1505AD in that region according to the present day slip rate on the fault
388
(Jouanne et al., 2017; Stevens and Avouac, 2015). Large or great earthquakes rupturing
389
partially or totally the MHT in the area, locally releasing the total slip deficit accumulated
390
since 1505AD would respectively produce earthquakes of magnitude ~7.9≤Mw≤~8.2 and
391
Mw~8.5 depending on the number of segments ruptured (according to the relations of
392
Kanamori (1977) between seismic moment – rupture surface – slip and seismic moment –
393
seismic moment magnitude) (Figure 10). A more infrequent larger earthquake, rupturing
394
more than the stretch of the Himalaya on which our study focuses, must also be considered.
395
All these scenarios should be integrated in future seismic hazard studies in order to better
396
assess the seismic risks in the region.
397 398
5. Conclusions
399The 15 stations of the HiKNet seismological network temporarily complemented the national
400
network, contributing to a better hypocentral resolution of the regional Western Nepal
401
seismic events. Among the many seismic events detected within the network between
402
December 1st 2014 and October 10th 2015, 2190 local earthquakes were manually
403
reviewed. The best events were then re-localized using absolute and relative relocation
404
schemes. The general pattern of earthquake distributions deduced confirms the existence of
20
significant lateral variations of the epicenters first revealed by the regional network (Pandey
406
et al., 1999). The main seismicity belt which develops at the foot of the high Himalayan
407
range in Bhajang area –at depths now resolved between 10 and 18/20 km- divides in two in
408
the Karnali area. The northern branch develops within a northward topographic embayment
409
and presents a rather scattered seismic activity during the period considered. The southern
410
one occurs at the front of the reliefs that develop south of the Karnali klippe –at depths
411
between 8 and 15 km.
412
In addition to scattered events, the seismicity belts include densely clustered seismic events
413
within pluri-kilometric-long swarms lasting a few days or weeks.
414
When confronted with the local geology, the earthquakes appear structurally controlled.
415
These earthquakes, when considered altogether, appear mostly clustered in the immediate
416
vicinity of the Main Himalayan Thrust fault as well as along the intersections between the
417
megathrust faults and the contacts between Lesser Himalayan tectonic slivers.
418
In addition, the examination of the time structure of the swarms reveals migrations of the
419
earthquakes. Both fluids, through pore pressure diffusion and/or transient slip events could
420
be associated to these earthquake migrations. To date, no transitory slow slip events have
421
been documented by the analysis of the cGPS time series (e.g. Ader et al., 2012). If these
422
events exist, they are below the actual resolution of the cGPS velocity field. Pore pressure
423
diffusion appears to be a likely contributor to some earthquake migrations within cluster, a
424
simple model of pore-pressure diffusion reproducing the bilateral 30-50 meters/day
425
apparent migration of the seismicity estimated along one of the main earthquake swarms.
21
In addition, the lateral variations of the earthquake pattern and its structural control may
427
translate possible seismic coupling variations, not yet properly resolved by the GPS velocity
428
field, still sparse in the region (e.g. Jouanne et al., 2017 ).
429
Whatever the earthquake engine involved in the spatiotemporal variation of the regional
430
seismicity, the earthquake pattern reveals a structural segmentation of the thrust by
pluri-431
kilometric midcrustal and frontal ramps. The interseismic locking of the area and the
432
presence of historical devastating earthquakes associated to the presence of this structural
433
segmentation suggest that this zone has a potential for producing both large and great
434
earthquakes and therefore constitutes a serious seismic hazard for western Nepal and the
435
adjoining region in Northern India.
436
437
Acknowledgements
438This work was performed within the framework of Roser Hoste-Colomer’s Phd thesis. The
439instruments temporarily deployed in Nepal belong to the French national pool of portable
440instruments RESIF-Sismobs work and was supported by the ANR-BHUTANEPAL. We thank
441Rodolphe Cattin, PI of the ANR-Bhutanepal, for the project organization and exchanges with
442the other work packages, and György Hetényi for the feedback on the GANSSER
443seismological array in Bhutan. The work was hosted at the Yves Rocard Joint Laboratory
444(ENS, CNRS, and CEA/DASE). We also thank the department of mines and geology, which
445provided some logistical support. We finally acknowledge the crucial contribution of Pierre
446Duperray, which provided efficient Seiscomp3 support.
447448 449
22
REFERENCES
450
Ader, T., Avouac, J.P., Liu-Zeng, J., Lyon-Caen, H., Bollinger, L., Galetzka, J., Genrich, J.,
451
Thomas, M., Chanard, K., Sapkota, S.N., Rajaure, S., Shrestha, P., Ding L. and Flouzat, M.,
452
2012. Convergence rate across the Nepal Himalaya and interseismic coupling on the Main
453
Himalayan Thrust: Implications for seismic hazard, Journal of Geophysical Research, 117,
454
B04403, doi: 10.1029/2011JB009071.
455
Amatya and Jnawali, 1994. Geological map of Nepal 1:1000000, Department of Mines and
456
Geology.
457
Baillard, C., Lyon-Caen, H., Bollinger, L., Rietbrock, A., Letort, J. and Adhikari, L.B., 2017.
458
Automatic analysis of the Gorkha earthquake aftershock sequence: evidences of structurally
459
segmented
seismicity,
Geophysical
Journal
International,
209,
1111-1125,
460
doi:10.1093/gji/ggx081.
461
Bilham, R., Mencin, D., Bendick, R. and Bürgmann, R., 2017. Implications for elastic energy
462
storage in the Himalaya from the Gorkha 2015 earthquake and other incomplete ruptures of
463
the
Main
Himalayan
Thrust,
Quaternary
International,
462,
3-21,
464
doi:10.1016/j.quaint.2016.09.055.
465
Bollinger, L., Avouac, J.P., Beyssac, O., Catlos, E.J., Harrison, T.M., Grove, M., Goffé, B. and
466
Sapkota, S., 2004. Thermal structure and exhumation history of the Lesser Himalaya in
467
central Nepal, Tectonics, 23, TC5015, doi:10.1029/2003TC001564.
468
Bollinger, L., Tapponnier, P., Sapkota, S.N. and Klinger, Y., 2016. Slip deficit in central Nepal:
469
omen for a repeat of the 1344 AD earthquake?, Earth, Planets and Space, 68:12,
470
doi:10.1186/s40623-016-0389-1.
23
DeCelles, P.G., Robinson, D.M., Quade, J., Ojha, T.P., Garzione, C.N., Copeland, P. and Upreti,
472B.N., 2001. Stratigraphy, structure, and tectonic evolution of the Himalayan fold-thrust belt
473in western Nepal, Tectonics, 20 (4), 487-509.
474de la Torre, T. L., and Sheehan, A. F., 2005. Broadband seismic noise analysis of the
475
Himalayan Nepal Tibet seismic experiment. Bulletin of the Seismological Society of America,
476
95(3), 1202-1208.
477
DeShon, H.R., Engdahl, E.R., Thurber, C.H. and Brudzinski, M., 2005. Constraining the
478
boundary between the Sunda and Andaman subduction systems: Evidence from 2002 Mw
479
7.3 Northern Sumatra earthquake and aftershock relocations of the 2004 and 2005 great
480
earthquakes, Geophysical Research Letters, 32, L24307, doi:10.1029/2005GL024188.
481
Diehl, T., Singer, J., Hetényi, G., Grujic, D., Clinton, J., Giardini, D., Kissling, E. and GANSSER
482
Working Group, 2017. Seismotectonics of Bhutan: Evidence for segmentation of the Eastern
483
Himalayas and link to foreland deformation, Earth and Planetary Science Letters, 471, 54-64.
484
Dominguez, S., Lallemand, S. E., Malavieille, J., and Von Huene, R., 1998. Upper plate
485
deformation associated with seamount subduction, Tectonophysics, 293, 207 – 224.
486
Duverger, C., Godano, M., Bernard, P., Lyon-Caen, H. and Lambotte, S., 2015. The 2003-2004
487
seismic swarm in the western Corinth rift: Evidence for multiscale pore pressure diffusion
488
process along a permeable fault system, Geophysical Research Letters, 42, 7374-7382,
489
doi:10.1002/2015GL065298.
490
Elliott, J.R., Jolivet, R., Gonzalez, P.J., Avouac, J.P., Hollingsworth, J., Searle, M.P. and
491
Stevens, V.L., 2016. Himalayan megathrust geometry and relation to topography revealed by
492
Gorkha earthquake, Nature geoscience, 9, doi:10.1038/NGEO2623.
24
Grandin, R., Vallée, M., Satriano, C., Lacassin, R., Klinger, Y., Simoes, M., and Bollinger, L.,
494
2015. Rupture process of the Mw=7.9 2015 Gorkha earthquake (Nepal): insights into
495
Himalayan megathrust segmentation, Geophysical Research Letters, 42, doi:
496
10.1002/2015GL066044.
497
Harvey, J.E., Burbank, D.W. and Bookhagen, B., 2015. Along-strike changes in Himalayan
498
thrust geometry: topographic and tectonic discontinuities in western Nepal, Lithosphere,
499
doi:10.1130/L444.1.
500
Hossler, T., Bollinger, L., Sapkota, S.N., Lavé, J., Gupta, R.M. and Kandel, T.P., 2016. Surface
501
ruptures of large Himalayan earthquakes in Western Nepal: Evidence along a reactivated
502
strand of the Main Boundary Thrust, Earth and Planetary Science Letters, 434, 187-196,
503
doi:10.1016/j.epsl.2015.11042.
504
Hoste-Colomer, R., Bollinger, L., Lyon-Caen, H. and Burtin, A., 2017. Lateral structure
505
variations and transient swarm revealed by seismicity along the Main Himalayan Thrust
506
North of Kathmandu, Tectonophysics, 714-715, 107-116, doi:10.1016/j.tecto.2016.10.004.
507
Hoste-Colomer, R., 2017. Lateral variations of seismicity along the Himalayan megathrust in
508
Nepal, PhD thesis, PSL Research University.
509
Hubbard, J., Almeida, R., Foster, A., Sapkota, S.N., Bürgi, P. and Tapponnier, P., 2016.
510
Structural segmentation controlled the 2015 Mw 7.8 Gorkha earthquake rupture in Nepal,
511
Geology, 44 (8), 639-642, doi:10.1130/G38077.1.
512
Jouanne, F., Mugnier, J.L., Sapkota, S.N., Bascou, P. and Pecher, A., 2017. Estimation of
513
coupling along the Main Himalayan Thrust in the central Himalaya, Journal of Asian Earth
514
Sciences, 133, 62-71, doi:10.1016/j.jseaes.2016.05.028.
25
Kanamori, H., 1977. The Energy Release in Great Earthquakes, Journal of Geophysical
516
Research, 82(20), 7B0286, 2981-2987.
517
Khanal, S. and Robinson, D.M., 2013. Upper crustal shortening and forward modeling of the
518
Himalayan thrust belt along the Budhi-Gandaki River, central Nepal, International Journal of
519
Earth Science (Geol Rundsch), 102, 1871-1891.
520
Kumar, S., Wesnousky, S.G., Rockwell, T.K., Briggs, R.W., Thakur, V.C. and
521
Jayangondaperumal, R., 2006. Paleoseismic evidence of great surface rupture earthquakes
522
along the Indian Himalaya, Journal of Geophysical Research, 111, B03304.
523
Lee, W.H.K., and Lahr, J.C., 1975. Hypo71 (revised): a computer program for determining
524
hypocenter, magnitude and first motion pattern of local earthquakes, U.S. Geological Survey
525
Open-File Report 75-311, 1-113.
526
Lemonnier, C., Marquis, G., Perrier, F., Avouac, J. P., Chitrakar, G., Kafle, B., Sapkota, S.N.,
527
Gautam, U., Tiwari, D. and Bano, M., 1999. Electrical structure of the Himalaya of central
528
Nepal: High conductivity around the mid‐crustal ramp along the MHT, Geophysical Research
529
Letters, 26(21), 3261-3264.
530
Letort, J., Bollinger, L., Lyon-Caen, H., Guilhem, A., Cano, Y., Baillard, C. and Adhikari, L.B,
531
2016. Teleseismic depth estimation of the 2015 Gorkha-Nepal aftershocks, Geophysical
532
Journal International, 207, 1584-1595, doi:10.1093/gji/ggw364.
533
Mahesh, P., Rai, S.S., Sivaram, K., Paul, A., Gupta, S., Sarma, R. and Gaur, V.K., 2013.
One-534
dimensional reference velocity model and precise locations of earthquake hypocenters in
535
the Kumaon-Garhwal Himalaya, Bulletin of the Seismological Society of America, 103 (1),
536
328-329, doi:10.1785/0120110328.
26
Métois, M., Socquet, A. and Vigny, C., 2012. Interseismic coupling, segmentation and
538
mechanical behavior of the central Chile subduction zone, Journal of Geophysical Research,
539
117, B03406, doi :10.1029/2011JB008736.
540
Monsalve, G., Sheehan, A., Schulte‐Pelkum, V., Rajaure, S., Pandey, M. R., and Wu, F., 2006.
541
Seismicity and one‐dimensional velocity structure of the Himalayan collision zone:
542
Earthquakes in the crust and upper mantle. Journal of Geophysical Research: Solid Earth,
543
111(B10).
544
Murphy, M. A., Taylor, M. H., Gosse, J., Silver, C. R. P., Whipp, D. M. and Beaumont, C., 2014.
545
Limit of strain partitioning in the Himalaya marked by large earthquakes in western Nepal,
546
Nature Geoscience, 7(1), 38-42.
547
Nábělek, J., Hetényi, G., Vergne, J., Sapkota, S.N., Kafle, B., Jiang, M., Su, H., Chen, J., Huang,
548
B-S. and Hi-CLIMB team, 2009. Underplating in the Himalaya-Tibet Collision Zone Revealed
549
by the Hi-CLIMB Experiment, Science, 325, 1371-1374.
550
Nakata, T., 1982. A photogrammetric study on active faults in Nepal Himalayas, Journal of
551
Nepal Geological Society, 2, special issue, 67-80.
552
Nakata, T., Iwata, S., Yamanaka, H., Yagi, H. and Maemoku, H., 1984. Tectonic Landforms of
553
several active faults in the western Nepal Himalayas, Journal of Nepal Geological Society, 4
554
(special issue), 177-200.
555
Pacchiani, F. and Lyon-Caen, H., 2010. Geometry and spatio-temporal evolution of the 2001
556
Agios Ioanis earthquake swarm (Corinth Rift, Greece), Geophysical Journal International,
557
180, 59-72, doi:10.1111/j.1365-246X.2009.04409.x.
27
Pandey, M.R., 1985. Seismic model of central and eastern lesser Himalaya of Nepal, Journal
559
of Nepal Geological Society, 3(1-2), 1-11.
560
Pandey, M.R., Tandukar, R.P., Avouac, J.P., Lavé, J. and Massot, J.P., 1995. Interseismic strain
561
accumulation on the Himalayan Crustal Ramp (Nepal), Geophysical Research Letters, 22,
562
751-754.
563
Pandey, M.R., Tandukar, R.P., Avouac, J.P., Vergne, J. and Héritier, T., 1999. Seismotectonics
564
of the Nepal Himalayas from a local seismic network, Journal of Asian Earth Sciences.,
17(5-565
6), 703-712.
566
Prawirodirdjo, L., McCaffrey, R., Chadwell, C.D., Bock, Y. and Subarya, C., 2010. Geodetic
567
observations of an earthquake cycle at the Sumatra subduction zone: Role of interseismic
568
strain
segmentation,
Journal
of
Geophysical
Research,
115,
B03414,
569
doi:10.1029/2008JB006139.
570
Robinson, D.M., DeCelles, P.G. and Copeland, P., 2006. Tectonic evolution of the Himalayan
571
thrust belt in western Nepal: Implications for channel flow models, Geological Society of
572
America Bulletin, 118 (7/8), 865-885, doi:10.1130/B25911.1.
573
Saillard, M., Audin, L., Rousset, B., Avouac, J-P., Chlieh, M., Hall, S.R., Husson, L. and Farber,
574
D.L., 2017. From the seismic cycle to long-term deformation: linking seismic coupling and
575
Quaternary coastal geomorphology along the Andean megathrust, Tectonics, 36, 241-256,
576
doi:10.1002/2016TC004156.
577
Satriano, C., Dionicio, V., Miyake, H., Uchida, N., Violette, J-P. and Bernard, P., 2014.
578
Structural and thermal control of seismic activity and megathrust rupture dynamics in
28
subduction zones: Lessons from the Mw 9.0, 2011 Tohoku earthquake, Earth and Planetary
580
Science Letters, 403, 287-298, doi:10.1016/j.epsl.2014.06.037.
581
Schelling, D. and Arita, K., 1991. Thrust tectonics, crustal shortening, and the structure of the
582
Far-Eastern Nepal Himalaya, Tectonics, 10, 5, 851-862.
583
Seiscomp3, 2013. GFZ Potsdam, gempa GmbH,
http://www.seiscomp3.org
, access date:
584
March 29
th2017.
585
Shapiro, S.A., Huenges, E. and Borm, G., 1997. Estimating the crust permeability from
fluid-586
injection-induced seismic emission at the KTB site, Geophysical Journal International, 131(2),
587
F15-F18, doi:10.1111/j.1365-246X.1997.tb01215.x.
588
Stevens,V.L. and Avouac, J.P, 2015. Interseismic coupling on the main Himalayan thrust,
589
Geophysical Research Letters, 42, 5828–5837, doi:10.1002/2015GL064845.
590
Subedi, S., Receiving function imaging in western Nepal EGU2018-7610
591
van der Beek, P., Litty, C., Baudin, M., Mercier, J., Robert, X., and Hardwick, E., 2016.
592
Contrasting tectonically driven exhumation and incision patterns, western versus central
593
Nepal Himalaya. Geology, 44(4), 327-330.
594
Wang, X., Wei, S., and Wu, W., 2017. Double-ramp on the Main Himalayan Thrust revealed
595
by broadband waveform modeling of the 2015 Gorkha earthquake sequence, Earth and
596
Planetary Science Letters, 473, 83-93.
597
Waldhauser, F. and Ellsworth, W.L., 2000. A double-difference earthquake location
598
algorithm: method and application to the Northern Hayward Fault, California, Bulletin
599
Seismological Society of America, 90 (6), 1353-1368.
29
Wesnousky, S. G., Kumahara, Y., Chamlagain, D., Pierce, I. K., Karki, A., & Gautam, D. (2017).
601Geological observations on large earthquakes along the Himalayan frontal fault near
602Kathmandu, Nepal. Earth and Planetary Science Letters, 457, 366-375.
603Yule, D., Dawson, S., Lavé, J., Sapkota, S., and Tiwari, D., 2006. Possible evidence for surface
604
rupture of the Main Frontal Thrust during the great 1505 Himalayan earthquake, far-western
605
Nepal, in AGU Fall Meeting Abstracts, S33C-05, 1, 5.
606
30
Figures
608
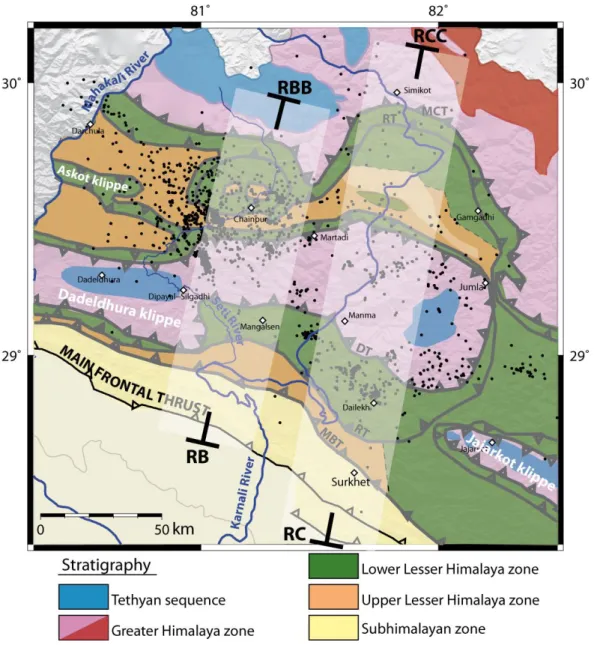
Figure 1
609Figure 1.
Seismicity map of western Nepal (Mid and Far Western Regions) with the main
tectonic structures.
Purple lines: MFT and active faults of Nakata, 1982; Gray lines: surface
traces of
MBT and MCT
.
Red and green triangles: seismic stations of the permanent and
temporary networks. Blue triangles: for GPS stations. Black points are the : earthquake
epicenters located at RSC for the period 1993-2012. White diamonds:
main cities referred in
the text.
B, NK, SK, respectively for Bahjang, North Karnali and South Karnali seismic belts.
610611
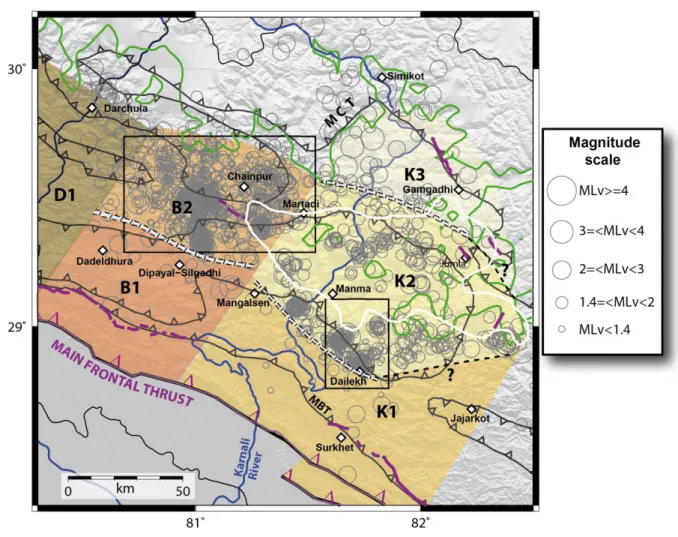
Figure 2
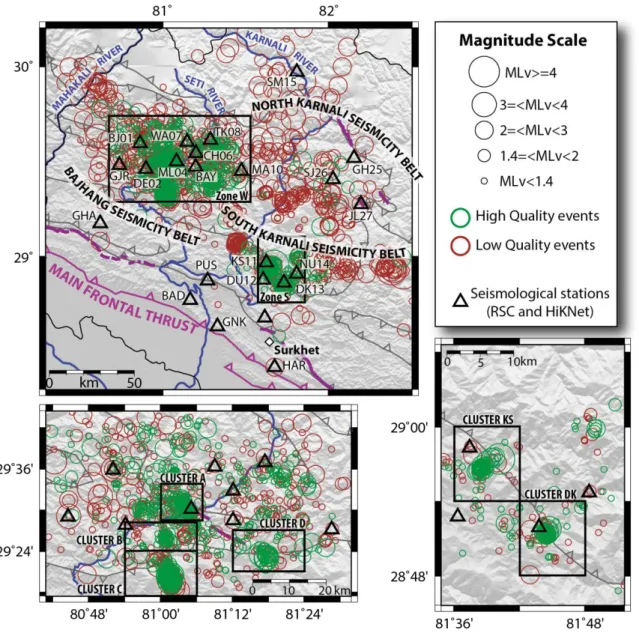
61231
Figure 2.
Microseismicity map of western Nepal recorded between December 2014 and
November 2015. Epicenters from Hypo71 absolute location. Green circles represent the high
quality events (P-phases ≥ 6, S-phases ≥ 3, RMS ≤ 0.4 and ERH and ERZ ≤ 2 km), brown circles
are the low quality events (P-phases < 6 or S-phases < 3 or RMS > 0.4 seconds or ERH and ERZ >
2 km). See Figure 1 for further references concerning the tectonic structures.
613
Figure 3
61432
Figure 3. Magnitude distribution for the whole catalog. (a) Magnitude histogram of the events in
MLv. (b) Gutenberg-Richter distribution with a b-value=0.75±0.05. The completeness magnitude
Mc is estimated at Mc~1.4.
615
616
33
Figure 4
618
Figure 4. Tectonic map of west Nepal. Main geological and tectonic units are colored
according to Robinson et al., 2006. The faults correspond to the Main Frontal Thrust (MFT),
the Main Boundary Thrust (MBT), the Ramgarh Thrust (RT), the Dadeldhura Thrust (DT) and
the Main Central Thrust (MCT). Black dots correspond to the seismicity of this study.
Cross-section tracks correspond to Figure 5.
34
Figure 5
620(a)
(b)
(c)
(d)
(e)
35
Figure 5. (a) Section through a 20 km-swath of the seismicity across Chainpur (Bajhang) (see
RB-RBB on Figure 4 for location). Balanced geological cross section from Robinson et al.,
2006. Note that the geological cross-section falling 5 km eastwards from the track was
projected. Color code is the same as Figure 4. (b) Zoom of the balanced cross-section (a). Red
and green triangles respectively stand for the permanent and temporary seismic network
along the swath. (c) Section through a 20 km-swath of the seismicity across Dailekh (Dailekh)
and Simikot (Mugu) (see RC-RCC Figure 4 for location). Balanced geological cross section
from Robinson et al., 2006. (d) Zoom of the balanced cross-section (c). Morphotectonic
observations from Harvey et al., 2015. Surface anticlinal folding from Amatya and Jnawali,
1994. (e) Alternative geological cross section involving an active midcrustal ramp consistent
with the spatial structure of the seismicity .
621 622 623 624 625 626 627 628 629 630
36
Figure 6
631
Figure 6. Cumulative number of events for the entire catalog (bold red line) and for the
different seismic clusters
(referred on Figure 2)
. Each catalog is cut to its completeness
magnitude (see Supplementary Material S4).
632