HAL Id: hal-01549157
https://hal.archives-ouvertes.fr/hal-01549157v2
Submitted on 26 Sep 2017
HAL is a multi-disciplinary open access
archive for the deposit and dissemination of
sci-entific research documents, whether they are
pub-lished or not. The documents may come from
teaching and research institutions in France or
abroad, or from public or private research centers.
L’archive ouverte pluridisciplinaire HAL, est
destinée au dépôt et à la diffusion de documents
scientifiques de niveau recherche, publiés ou non,
émanant des établissements d’enseignement et de
recherche français ou étrangers, des laboratoires
publics ou privés.
Towards cutting force evaluation without cutting tests
Sébastien Campocasso, Gérard Poulachon, Stéphanie Bissey-Breton,
Jean-Philippe Costes, José Outeiro
To cite this version:
Sébastien Campocasso, Gérard Poulachon, Stéphanie Bissey-Breton, Jean-Philippe Costes, José
Out-eiro. Towards cutting force evaluation without cutting tests. CIRP Annals - Manufacturing
Technol-ogy, Elsevier, 2017, 66 (1), pp.77-80. �10.1016/j.cirp.2017.04.023�. �hal-01549157v2�
Towards cutting force evaluation without cutting tests
S. Campocasso
a,1,*, G. Poulachon (2)
a, S. Bissey-Breton (3)
b, J.P. Costes
a, J.C. Outeiro (2)
a a Arts et Metiers, LaBoMaP, Rue Porte de Paris, 71250 Cluny, Franceb CEA, DAM, Valduc, 21120 Is-sur-Tille, France
1 Currently at Université de Toulon, Lab. COSMER, CS60584, 83041 Toulon Cedex 9, France
Mechanistic cutting force modelling generally involves coefficients identification from machining tests. In order to develop multi-material cutting force models avoiding identification, several studies have tried to link cutting forces to mechanical properties from databases, whose relevance remains questionable. In this study, the cutting coefficients obtained by inverse identification from turning tests are compared with properties obtained from several mechanical tests. The correlations show that cutting forces can be estimated, without cutting tests, using hat-shaped shear tests. The originality of the approach is the behaviour proximity of the five machined materials used: thermal and mechanical treated pure coppers, brass and bronze.
Cutting, Force, Material
1. Introduction
In 1998, a CIRP keynote paper [1] reported that most of the manufacturers preferred to use machining databases, instead of predictive models, due to the large variety of machining operations. Nowadays, cutting force estimation still requires experimental data obtained by instrumented cutting tests, generally using expensive multi-components dynamometers. In most of cases, cutting experiments are considered to be unavoidable if the machined material is changed.
Nevertheless, since the beginning of cutting modelling activities, many researchers tried to correlate cutting forces with mechanical characteristics of the work material. Among the first, in 1950, Lapsley et al. [2] tried to use tensile data, but the analysis was done only for one material. Later, Hastings et al. [3] compared cutting forces with high-speed compression test data from the literature, and also for a single material. In 1985, Armarego and Whitfield [4] mentioned that many researchers tried without success to eliminate cutting experiments from cutting force prediction, slowing down research efforts in this way. Notwithstanding, tensile tests and high-speed compression tests are still used nowadays in metal cutting studies, either to evaluate the machinability [5] or to characterise the mechanical behaviour of the work material for machining simulations [6]. Recently, a study tried to correlate specific cutting forces and tensile properties, both from the literature, using an empirical approach [7].
In the present article, the conclusions are established on an energy approach and a comparison with hat-shaped shear tests, seeing that the energy spent in the primary shear zone has been estimated to be up to 67 % of the total by Astakhov and Xiao [8].
Hat-shaped specimens have been proposed by Hartmann et al. in 1981 [9] (as reported in [10]) to study shear loads. Even if hat-shaped experiments are more representative of the cutting process, Changeux [11] noted that there are some differences considering the hydrostatic stress, the shear strain rate – even in high-speed experiments –, and mostly the dimensions of the deformed volume introducing scaling and thermal effects. Despite these differences, these tests are quite simple and were widely
used for the last twenty years to characterise the behaviour of work materials, especially for metal cutting simulations [12, 13]. At a macroscopic scale, Hofmann and El-Magd [14] observed that the deformation work (or strain energy) per unit volume and the shear strain at fracture obtained by hat-shaped tests can be correlated with the chip breakability of the machined material.
In this study, five copper-based alloys, presented in Section 2, are used to clarify whether it could be possible or not to predict cutting forces from mechanical testing. For this purpose, the cutting coefficients obtained by inverse identification, as explained in Section 3, are compared with the mechanical properties obtained by tensile and hat-shaped experiments presented in Section 4. In particular, the comparison is based on an energy approach, whose results are detailed in Section 5.
2. Experimental approach and work materials
The originality of the proposed approach lies in the use of several materials which can be machined in the same conditions with reduced tool wear and with some behaviour similarities.
Initially, three pure coppers (Cu-OFE) have been studied under different metallurgical and mechanical states [15]:
- The first one corresponds to a standard cold-rolled copper
(denoted Cu-Standard in this article), which is already work hardened;
- The second one (denoted Cu-Annealed) has been annealed
by a heat treatment at 450°C during 2 h;
- The last one was strengthened by using Equal Channel
Angular Extrusion process (denoted Cu-ECAE).
These three work materials are expected to have exactly the same elastic and thermal properties, being the closest machined materials conceivable. Later, the results have been completed by adding two standard copper alloys: a bronze (CuSn12) and a brass (CuZn39Pb2), and also by evaluating the repeatability of the measurements, as exposed in this article.
The dimensions of all the blanks were imposed by the ECAE tools, which allows 35 mm diameters cylindrical samples to be treated (Fig.1(a)), and used afterwards to manufacture the testing specimens.
(a)
(b)
Figure 1. The five tested materials: (a) Machined samples (ϕ 35 mm);
(b) Hat-shaped specimens (ϕ 14 mm) after compression.
3. Analysis from cutting tests
3.1. Experimental set-up and set of experiments
Due to the small diameter of the samples, it was not possible to perform orthogonal cutting tests in turning configurations (disk or tube). Therefore, only longitudinal turning tests have been conducted using a single round carbide insert (Sandvik RCGX1204M0-ALH10) for all the tests, whose cutting edge
radius rn has been estimated to be about 17 ±2 µm.
The turning tests have been performed on a 2-axis lathe (Somab, model Transmab 400) with flood lubrication. Cutting forces have been measured using a Kistler 9121 dynamometer together with a Kistler 5019 charge amplifier. Signals have been digitised by a NI PCI-6221 data acquisition card and treated in DasyLab software.
For each machined material, a set of five turning tests has been repeated three times, paying attention that there has been no interaction between tool wear and machined material. The five
couples of cutting parameters (f, ap) are represented in Fig. 2 and
correspond to finishing conditions as shown by the hmax iso-lines.
Figure 2. Set of five cutting experiments, at constant Vc = 250 m/min.
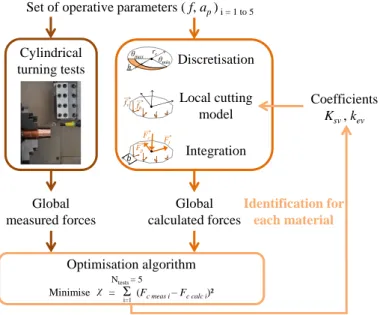
3.2. Inverse identification of the local cutting force model
The cutting forces are modelled using the edge discretisation principle, graphically represented in Fig.3: the global cutting force
component Fc is calculated by summing up the contribution of the
local cutting forces fv (parallel to Vc) applied along the cutting edge,
as expressed in Equation (1).
Figure 3. Principle of the inverse identification.
The local forces are expressed as a linear function of the uncut chip thickness h, as shown by Equation (2), using two cutting coefficients Ksv and kev. The first term is assumed to be linked to the
shearing process, while the second should represent the edge effect (also called ploughing effect) [4].
𝐹𝑐 𝑐𝑎𝑙𝑐= ∫ 𝑓 𝜃𝑚𝑎𝑥
𝜃𝑚𝑖𝑛 𝑣(𝜃) . 𝑟𝜀 d𝜃
(1)
𝑓𝑣(ℎ) = 𝐾𝑠𝑣 . ℎ(𝜃) + 𝑘𝑒𝑣
(2)
The principle of the discretisation methodology together with the uncut chip thickness calculation as a function of θ are detailed in reference [16].
The two coefficients (Ksv and kev) have been determined by
inverse identification, as graphically explained in Fig. 3, by comparing modelled and measured global forces consisting in minimising the objective function χ as expressed by Equation (3). This identification has been done three times for each work material from each set of force measurements.
𝜒 = ∑5𝑖=1 ( 𝐹𝑐 𝑚𝑒𝑎𝑠 𝑖− 𝐹𝑐 𝑐𝑎𝑙𝑐 𝑖)²
(3)
The averages of the three identified values for each material are given in Table 1 together with the standard deviations. It should be noted that the specific cutting force Kc can be calculated as a
function of h from Equation (2) by dividing fv by h. The chosen
cutting model is thus able to return the so-called “size effect” [17] for each material.
Table 1 Identified coefficients of the mechanistic model for the five
machined materials. Material (N/mm²) Ksv (N/mm) kev Cu-Annealed 1416 ±74 21.5 ±1.5 Cu-Standard 1369 ±95 20.2 ±3.3 Cu-ECAE 923 ±121 15.8 ±1.9 Bronze 884 ±92 11.5 ±2.7 Brass 675 ±13 6.5 ±0.21
The aim of the mechanical tests presented in Section 4 is to determine the possibility of finding mechanical data which can be
directly linked to the cutting coefficient Ksv – which represents the
specific energy of the shearing process during cutting.
0 0.05 0.1 0.15 0.2 0.25 0.3 0.35 0 0.25 0.5 0.75 1 1.25 hmax= 0.02 mm hmax= 0.04 mm hmax= 0.06 mm hmax= 0.08 mm hmax= 0.1 mm hmax= 0.12 mm hmax= 0.14 mm f (mm/rev) ap (m m ) iso h max (mm) 0 0.05 0.1 0.15 0.2 0.25 0.3 f p a max h rε= 6 mm Ff Fp Fc fh fv θmax b rε θmin h Ff Fp Fc fh fv θmax b rε θmin h Ff Fp Fc fh fv θmax b rε θmin h Cylindrical turning tests Global measured forces Discretisation Local cutting model Integration Global calculated forces Coefficients Ksv, kev Optimisation algorithm
Set of operative parameters ( f, ap)i = 1 to 5
Identification for each material
Minimise = Σ(Fc meas i – Fc calc i)²
i=1
Ntests = 5 χ
4. Mechanical characterisations
The three pure coppers were characterised using tensile, high-speed compression and hat-shaped shear tests, as well as hardness measurements [15]. Tensile test results are briefly summarised in section 4.1, while an extended campaign of hat-shaped tests is presented in section 4.2.
4.1. Tensile tests
The tensile tests have been performed only for the three pure coppers on an Instron tensile machine (Model 1185) at a constant speed of 1 mm/min. The dimensions of the cylindrical specimens (ϕ 10 mm) fulfilled the ISO6892:2009 standard.
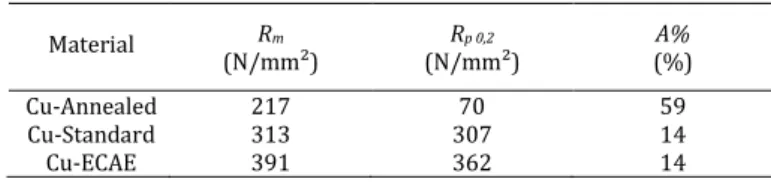
Only one test has been performed for each material. The results are presented graphically in Fig. 4 and the main obtained properties are summarised in Table 2.
Figure 4. Stress-strain curves of the tensile tests.
Ultimate and yield strengths alone are clearly not representative of the cutting forces, since the trends are opposite. Therefore, the calculation of cutting forces from tensile databases seems to be impossible, as proven with the three pure coppers – closest machined materials as possible.
Table 2 Measured tensile properties of the three pure coppers.
Material Rm
(N/mm²) (N/mm²) Rp 0,2 (%) A%
Cu-Annealed 217 70 59
Cu-Standard 313 307 14
Cu-ECAE 391 362 14
4.2. Shear tests using hat-shaped specimens
Since preliminary tests conducted in 2013 [15] on the three pure coppers have shown a possible correlation between cutting coefficients and hat-shaped data, these conclusions have been consolidated by including the two copper alloys.
The main dimensions of the specimens are given in Fig. 5, while complementary specifications can be found in [15]. These dimensions have been selected regarding past studies [10, 13-14] and should result in a cylindrical shear band of 0.1 mm thickness (shown in Fig. 5) when compressing the hat-shaped specimen.
The specimens have been compressed between two anvil plates on the Instron Model 1185 machine, as shown in Fig. 6, at a constant translational speed of 1 mm/min and at room temperature. The displacement has been measured by an inductive displacement transducer (HBM 1-WI/10MM-T) and the force using the load cell of the machine with a 50 kN calibration. A 25 N preload has been applied before starting each test.
Figure 5. Hat-shaped specimen dimensions.
Three tests have been performed for each material. The results are presented in Fig. 6 by force-displacement curves, since the determination of stress-strain curves requires an analysis of the samples at micro-scale – through micrographs for example [11].
As for tensile results, it could be noted that the maximal force alone, and consequently the maximal shear stress, is not sufficient to predict the cutting forces.
Figure 6. Force-displacement curves of the hat-shaped shear tests.
From these curves, the energy required for the whole test can be calculated by the integral of the force along the displacement (area under the curve) up to fracture, as it is commonly used to study blanking processes [18].
Then, this energy is divided by the theoretical deformed volume
(equal to 6.84 mm3) in order to calculate a deformation work per
unit volume or volumetric strain energy, denoted uHS (Table 3),
which can be compared with the cutting coefficient Ksv.
Table 3 Hat-shaped volumetric strain energies up to fracture.
Material uHS (N/mm²) Cu-Annealed 4561 ±159 Cu-Standard 4460 ±41.1 Cu-ECAE 3423 ±95.1 Bronze 3581 ±73.4 Brass 1972 ±40.4
The values of the data show similar trends of cutting and hat-shaped energy criteria as functions of work material. That is why an energy approach at a macroscopic scale has been followed for the prediction of cutting forces presented in the next section. 5. Cutting force evaluation from hat-shaped data
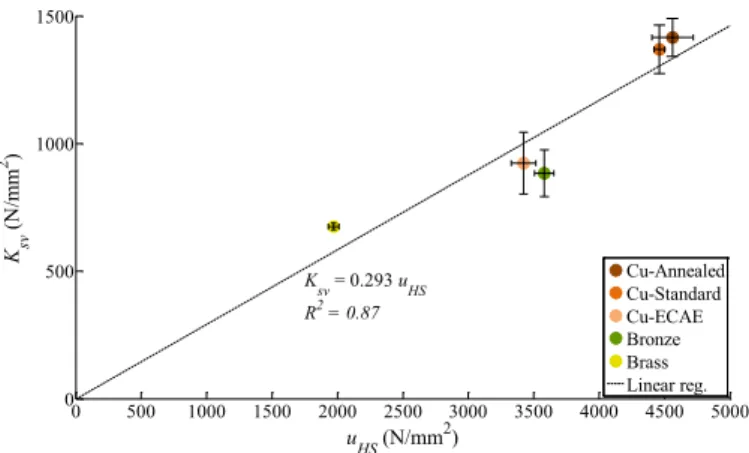
Fig. 7 shows a correlation between hat-shaped strain energies
uHS and cutting coefficients Ksv, with a linear regression. The linear
fit is in quite good agreement considering measurement repeatability. In the future, hat-shaped shear tests at higher loading speeds will may improve this correlation.
0 10 20 30 40 50 60 0 50 100 150 200 250 300 350 400 (%) (M P a) Cu-ECAE Cu-Standard Cu-Annealed 0 0.5 1 1.5 2 2.5 3 3.5 0 5000 10000 15000 20000 Displacement (mm) Com pre ss ion forc e (N ) Bronze Brass Cu-ECAE Cu-Standard Cu-Annealed
Figure 7. Correlation between cutting coefficients and hat-shaped
volumetric strain energies.
Following this observation, the final step of the study is the comparison between measured cutting forces and predictions obtained only from the hat-shaped data. For this purpose, the
cutting coefficients Ksv and kev have been calculated as following:
Ksv = 0.293 uHS and kev =Ksv . rn in a first approximation. Then, the
cutting forces have been modelled using the edge discretisation methodology, for the five couples of cutting parameters. The comparison between the predicted values and the averages of the three corresponding measured forces is presented in Fig. 8.
Figure 8. Correlation between measured and predicted cutting forces.
Cutting force estimations are between -10 % and +30 %, except for one point where the force is overestimated about 50 %. These differences must be kept in proportion, since the dispersion of cutting force measurements from a laboratory to another may vary up to 50 % – as demonstrated in 2000 by a round robin test [19].
Considering that these estimations can be obtained without
cutting tests once the ratio between Ksv and uHS is known, the use
of hat-shaped data can be an interesting way to establish a database for cutting force prediction and even for machinability classification if chip breakability is included. In this way, machined material groups will be defined depending on the ratio between the cutting coefficients and the volumetric hat-shaped strain energy. As this ratio may vary when changing the strain rate, the temperature or the dimensions of the samples, hat-shaped experiment standards should be defined in the future.
6. Conclusion
In this article, five work materials have been characterised in terms of cutting forces and mechanical properties. Results confirm that tensile properties cannot be used to predict cutting forces, as reported in the literature. On the other side, the possibility of
roughly evaluating cutting forces from hat-shaped data has been demonstrated through an energy approach.
Considering the total displacement during hat-shaped tests could also allow the chip breakability of the work material to be estimated. Indeed, brass chips are short fragmented, bronze ones are long fragmented, whereas pure coppers chips are long and continuous (even for the ECAE copper with the cutting parameters used in this study).
Future work should try to confirm these conclusions by applying the proposed methodology to a wide range of machined materials. The results could be helpful for a lot of practical applications where materials are rapidly changing, such as titanium and nickel based alloys for aeronautic industry. Indeed, for these leading applications, material compositions and treatments are frequently changing in order to improve the material characteristics, sometimes at the expense of manufacturers.
The effects of strain rate and temperature should also been studied, with a statistical treatment of the data correlation, in order to confirm if the hat-shaped experiment can become a standardised test to evaluate the machinability of materials. References
[1] Van Luttervelt, C.A., Childs, T.H.C., Jawahir, I.S., Klocke, F., Venuvinod, P.K., Altintas, Y., et al., 1998, Present situation and future trends in modelling of machining operations - Progress report of the CIRP Working Group ‘Modelling of Machining Operations’, CIRP Ann. – Manuf. Technol., 47/2:587-626.
[2] Lapsley, J.T., Grassi, R.C., Thomsen, E.G., 1950, Correlation of plastic deformation during metal cutting with tensile properties of the work material, Trans. ASME, 72/7:979-986.
[3] Hastings, W.F., Oxley, P.L.B., Stevenson, M.G., 1974, Predicting a material's machining characteristics using flow stress properties obtained from high-speed compression tests, Proc. Inst. Mech. Eng., 188:245-252.
[4] Armarego, E.J.A, Whitfield, R.C., 1985, Computer based modelling of popular machining operations for force and power prediction, Ann. CIRP, 34/1:65-69. [5] Settineri, L., Priarone, P.C., Arft, M., Lung, D., Stoyanov, T., 2014, An evaluative
approach to correlate machinability, microstructures, and material properties of gamma titanium aluminides, CIRP Ann. – Manuf. Technol., 63/1:57-60. [6] Iturbe, A., Giraud, E., Hormaetxe, E., Garay, A., Germain, G., Ostolaza, K., Arrazola,
P.J., 2017, Mechanical characterization and modelling of Inconel 718 material behavior for machining process assessment, Mater. Sci. Eng. A, 682:441-453. [7] Schultheiss, F., Bushlya, V., Zhou, J., Stahl, J.E., 2014, Influence of the workpiece
material properties on the cutting forces. Proc. of the 6th Swedish Production Symposium.
[8] Astakhov, V.P., Xiao, X., 2008, A methodology for practical cutting force evaluation based on the energy spent in the cutting system, Mach. Sci. Technol., 12/3:325-347.
[9] Hartmann, K.H., Kunze, H.D., Meyer, L.W., 1981, Metallurgical effects on impact loaded materials, In Shock waves and high-strain-rate phenomena in metals (pp. 325-337), Springer US.
[10] Beatty, J.H., Meyer, L.W., Meyers, M.A., Nemat-Nasser, S., 1990, Formation of controlled adiabatic shear bands in AISI 4340 high strength steel, US Army Materials Technology Laboratory, No. MTL-TR-90-54.
[11] Changeux, B., 2001, Loi de comportement pour l'usinage. Localisation de la déformation et aspects microstructuraux, Ph.D. thesis, Ecole Nationale Supérieure d’Arts et Métiers.
[12] Abouridouane, M., Klocke, F., Lung, D., Adams, O., 2012, A new 3D multiphase FE model for micro cutting ferritic–pearlitic carbon steels, CIRP Ann. - Manuf. Technol., 61/1:71-74.
[13] Hor, A., Morel, F., Lebrun, J.L., Germain, G., 2013, An experimental investigation of the behaviour of steels over large temperature and strain rate ranges, Int. J. Mech. Sci., 67:108-122.
[14] Hofmann, U., El-Magd, E., 2005, Behaviour of Cu-Zn alloys in high speed shear tests and in chip formation processes, Mater. Sci. Eng. A, 395:129-140. [15] Campocasso, S., 2013, Développement d'un modèle d'efforts de coupe
multi-opérations et multi-matériaux - Application au tournage du cuivre pur dans différents états métallurgiques, Ph.D. thesis, Arts et Metiers ParisTech. [16] Campocasso, S., Costes, J.P., Fromentin, G., Bissey-Breton, S., Poulachon, G., 2015,
A generalised geometrical model of turning operations for cutting force modelling using edge discretisation, Appl. Math. Model., 39/21:6612-6630. [17] Furukawa, Y., Moronuki, N., 1988, Effect of material properties on ultra precise
cutting processes, CIRP Ann. - Manuf. Technol., 37/1:113-116.
[18]Volk, W., Stahl, J., 2015, Shear Cutting, doi:10.1007/978-3-642-35950-7_16823-1, In CIRP Encyclopedia of Production Engineering, Springer Berlin Heidelberg. [19] Ivester, R.W., Kennedy, M., Davies, M., Stevenson, R., Thiele, J., Furness, R.,
Athavale, S., 2000, Assessment of machining models: progress report, Mach. Sci. Technol., 4/3:511-538. 0 500 1000 1500 2000 2500 3000 3500 4000 4500 5000 0 500 1000 1500 K sv = 0.293 uHS R2 = 0.87 uHS (N/mm2) Ksv (N /m m 2) Cu-Annealed Cu-Standard Cu-ECAE Bronze Brass Linear reg. 0 100 200 300 400 0 50 100 150 200 250 300 350 400 450 +30% -30% Fc meas (N) Fc m od (N ) Cu-Annealed Cu-Standard Cu-ECAE Bronze Brass