Publisher’s version / Version de l'éditeur:
Information Bulletin on Variable Stars, 2017-07-03
READ THESE TERMS AND CONDITIONS CAREFULLY BEFORE USING THIS WEBSITE. https://nrc-publications.canada.ca/eng/copyright
Vous avez des questions? Nous pouvons vous aider. Pour communiquer directement avec un auteur, consultez la première page de la revue dans laquelle son article a été publié afin de trouver ses coordonnées. Si vous n’arrivez pas à les repérer, communiquez avec nous à [email protected].
Questions? Contact the NRC Publications Archive team at
[email protected]. If you wish to email the authors directly, please see the first page of the publication for their contact information.
NRC Publications Archive
Archives des publications du CNRC
This publication could be one of several versions: author’s original, accepted manuscript or the publisher’s version. / La version de cette publication peut être l’une des suivantes : la version prépublication de l’auteur, la version acceptée du manuscrit ou la version de l’éditeur.
For the publisher’s version, please access the DOI link below./ Pour consulter la version de l’éditeur, utilisez le lien DOI ci-dessous.
https://doi.org/10.22444/IBVS.6203
Access and use of this website and the material on it are subject to the Terms and Conditions set forth at
V2197 Cyg: a semi-detached eclipsing binary?
Robert H., Nelson; Russell M., Robb
https://publications-cnrc.canada.ca/fra/droits
L’accès à ce site Web et l’utilisation de son contenu sont assujettis aux conditions présentées dans le site
LISEZ CES CONDITIONS ATTENTIVEMENT AVANT D’UTILISER CE SITE WEB.
NRC Publications Record / Notice d'Archives des publications de CNRC:
https://nrc-publications.canada.ca/eng/view/object/?id=02f4692b-70a0-470e-8d48-b874acd905e7 https://publications-cnrc.canada.ca/fra/voir/objet/?id=02f4692b-70a0-470e-8d48-b874acd905e7
Konkoly Observatory Budapest
06 April 2017
HU ISSN 0374 – 0676
V2197 Cyg – A SEMI-DETACHED ECLIPSING BINARY?
NELSON, ROBERT H.1,2; ROBB, RUSSELL M.2,3 1
1393 Garvin Street, Prince George, BC, Canada, V2M 3Z1, email: [email protected]
2
Guest investigator, Dominion Astrophysical Observatory, Herzberg Institute of Astrophysics, National Re-search Council of Canada
3
Department of Physics and Astronomy, University of Victoria, Victoria, B.C., Canada, V8P 2W7
The variability of V2197 Cyg (NSVS 5761314, TYC 3167-1279-1), amongst many oth-ers, was discovered photographically by Margoni & Stagni (1984, hereafter M&S) who gave coordinates, magnitude ranges in B and V , finder charts for all 99 stars, elements (epoch, period), and preliminary light curves for about half the stars (but not for V2176 Cyg, their #58). Andronov et al. (1993) performed U, B, V, R, and I photometry of this and three other M&S stars; they went on in Andronov et al. (1994) to identify the system as an eclipsing variable, also giving the elements (including period = 0.46771 d) and eclipse duration. Skiff (1997) identified the M&S variables with those in the IRAS and GSC catalogues. Hoffman et al. (2008) provided an updated period, quoted 2MASS colours, and classified the system as β Lyrae. Since then, there have been a number of eclipse timings but no light curve analysis.
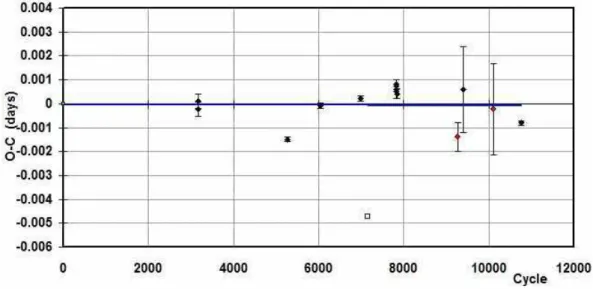
Light curve and radial velocity data have been acquired, but before any analysis could be performed, the first task was to examine the period variation. An eclipse timing differ-ence (O–C) plot using all available data and the elements of Kreiner (2004) is reproduced in Fig. 1.
It will be seen that, even though all data are electronic (PE or CCD), there is a fair amount of scatter–larger than most of the error ranges. Clearly there must be unexplained physical reason for this discrepancy; future accurate data are required to sort out true relationship. In the meantime, the line of best fit must suffice. In view of the fact that all data were taken between cycles 7000 and 9000 (approximately), any errors due to uncertainties in the period are likely to be small.
A slightly different set of elements, specified in equation (1) was used in all phasing. JD (Hel) Min I = 2457514.9187(5) + 0.4657489(1)E (1) In August of 2012, the lead author took 82 frames in V , 79 in RC (Cousins) and 77
in the IC (Cousins) band at his private observatory in Prince George, BC, Canada. The
telescope was a 33 cm f/4.5 Newtonian on a Paramount ME mount; the camera was an SBIG ST-10XME. Standard reductions were then applied. The variable, comparison and check stars are listed in Table 1. The coordinates and magnitudes for all three stars are
2 IBVS6203
Figure 1. V2197 Cyg – eclipse timing (O–C) diagram. Legend: filled circles – photoelectric; black diamonds – CCD. The open square represents a rejected reading.
Table 1: Details of variable, comparison and check stars.
Object GSC RA (J2000) Dec (J2000) V (mag) B − V (mag) Variable 3167-1279 20h50m16.s321 37◦ 56′ 45.′′ 29 12.04(17) +0.17(22) Comparison 3167-0649 20h50m32.s961 37◦ 57′ 48.′′ 77 10.47(4) +0.30(6) Check 3167-1451 20h50m13.s62 37◦ 55′ 54.′′ 3 11.66(na) 1.28(na)
from the Tycho Catalogue (Hog et al. 2000) and the 2MASS catalogue, (Cutri et al. 2003), except for the magnitudes of the check star, for which there was no reference in SIMBAD. In September of 2011, 2013, and 2014, the lead author then took a total of 7 medium resolution (R ∼ 10000 on average) spectra of V2197 Cyg at the Dominion Astrophysical Observatory (DAO) in Victoria, British Columbia, Canada using the Cassegrain spec-trograph attached to the 1.85 m Plaskett Telescope. He used the 21181 grating with 1800 lines/mm, blazed at 5000 ˚A giving a reciprocal linear dispersion of 10 ˚A/mm in the first order. The wavelengths ranged from 5000 to 5260 ˚A, approximately. A log of observations is given in Table 2. (The last value for V2 listed in the table, –270.7 km/s, was not used in the modelling on the grounds that it was deviant by more than 3σ from the curve of best fit; however, it is plotted in Fig. 6 for reference.)
Frame reduction was performed by software ‘RaVeRe’ (Nelson 2009). See Nelson et al. (2014) for further details.
Radial velocities were determined using the Rucinski broadening functions (Rucinski 2004; Nelson 2010b; Nelson et al. 2014). An Excel worksheet with built-in macros (written by him) was used to do the necessary radial velocity conversions to geocentric and back to heliocentric values (Nelson 2010a). The resulting RV determinations are also presented in Table 2. For all the data, the results were corrected typically 5 % up to allow for the small phase smearing. Correction was achieved by dividing the RVs by the factor f = (sinX)/X; whereX = 2π t/P , and where t denotes exposure time and P denotes the orbital period. For spherical stars, this correction is exact; in other cases, it can be shown to be close enough for any deviation to fall below observational errors. The mean
Table 2: Log of DAO observations.
DAO Mid Time Exposure Phase at V1 V2
Image # (HJD−2400000) (sec) Mid-exp (km/s) (km/s)
7849 55808.9875 3561 0.229 –148.0 +159.8 8141 55820.6522 3600 0.274 –142.0 +172.0 8153 55820.9065 3600 0.820 +89.4 –217.9 8217 55825.8105 2876 0.350 –134.4 +140.5 9629 56544.6973 3600 0.857 +77.8 –205.6 9638 56544.8504 3600 0.186 –131.0 +174.0 24359 56906.9975 3600 0.745 +97.9 –270.7
rms errors for RV1 and RV2 were 9.1 and 14.0 km/s, respectively, and the overall rms
deviation from the (sinusoidal) curves of best fit was 12.3 km/s. The best fit yielded the values K1 = 123.0(8) km/s, K2 = 214.3(1.1) km/s and Vγ = −30.8(6) km/s, and thus a
mass ratio qsp = K1/K2 = M2/M1 = 0.574(5).
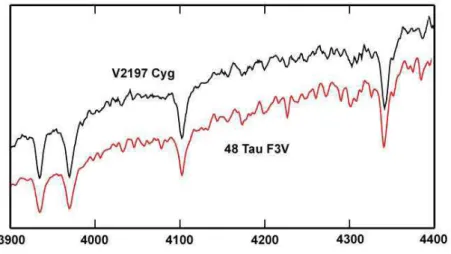
One of the authors (R.M.R.) obtained a spectrum of V2197 Cyg at the Dominion Astrophysical Observatory (DAO) with the 1.85 m telescope and the 2131 Cassegrain spectrograph, operating at a reciprocal dispersion of about 60 ˚A/mm and 0.9 ˚A/px. The start time of the exposure was 2013 June 22 at UT+09:25:33 and lasted 666 s (JD 2456465.8927), corresponding to phase 0.66. The strength of the G-Band and Hydrogen lines indicate F3(±1)V. A comparison spectrum of 48 Boo (F3V) observed with the same configuration is plotted for comparison in Fig. 2, where the spectra have been scaled and offset an arbitrary amount. The spectrum of V2197 Cyg has been smoothed with a 3 point running average. The lines are (left to right) Ca II K-line, Ca II H-line blended with Hǫ, Hδ, and Hγ.
Figure 2. Classification spectra.
Next, the lead author (R.H.N.) used the 2003 version of the Wilson-Devinney (WD) light curve and radial velocity analysis program with Kurucz atmospheres (Wilson and Devinney 1971; Wilson 1990; Kallrath et al. 1998) as implemented in the Windows front-end software WDwint (Nelson 2009) to analyze the data. Using the spectral type of F3V,
4 IBVS6203
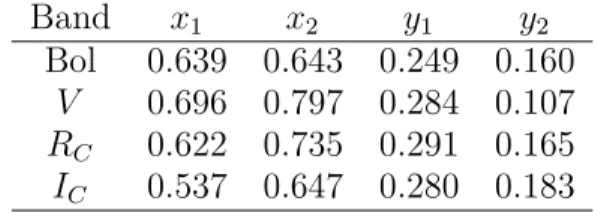
Table 3: Limb darkening values from Van Hamme (1993) for T1= 6820 K and T2= 5037 K.
Band x1 x2 y1 y2
Bol 0.639 0.643 0.249 0.160 V 0.696 0.797 0.284 0.107 RC 0.622 0.735 0.291 0.165
IC 0.537 0.647 0.280 0.183
the tables of Cox (2000), and those of Flower (1996) gave a temperature T1 = 6820±200 K
and log g1 = 4.328 ± 0.012. (The quoted errors refer to one and one half spectral
sub-classes.) An interpolation program by Terrell (1994, available from Nelson 2009) gave the Van Hamme (1993) limb darkening values; and finally, a logarithmic (LD = 2) law for the limb darkening coefficients was selected, appropriate for temperatures < 8500 K (ibid.). The limb darkening coefficients are listed below in Table 3. (The values for the second star are based on the later-determined temperature of 5037 K and assumed spectral type of K2.) Convective envelopes for both stars were used, appropriate for cool stars (hence values gravity exponent g = 0.32 and albedo A = 0.500 were used for each).
From the shape of the light curve, it was clear that the system was in near contact but the difference in the depths of the two minima indicate that the stars are not in thermal contact. Various modes were tried: mode 3 (contact), mode 2 (detached), mode 5 (Algol) and, finally mode 6 (double contact). Convergence was obtained by the method of multiple subsets: (a, Vγ, L1), (T2, q), (i, T2) and (T2, Ω1). The net result was residuals (or,
more correctly, sums of residuals squared) that were nearly identical, making it difficult to choose between the scenarios. A useful procedure was to proceed with mode 6 (because the potentials were fixed from the mass ratio, thereby reducing the number of free parameters), find the optimum using differential corrections, then switch to another mode, making slight adjustments in potentials Ω1 and Ω2 as necessary to satisfy the conditions for that
mode, then proceeding with differential corrections once again. This led to the best minimum. Mode 3 failed because differential corrections wanted increases in potential Ω1 that would force star 1 inside the Roche lobe (i.e., Ω1 > Ωi where the latter is the
inner critical potential), and in any case, the unequal depths of minima precluded this mode. Mode 2 (detached) also failed for the same reason, except that this time, differential corrections wanted potential Ω2 > Ωi, that is for the secondary to be at or inside the Roche
lobe. Therefore only mode 5 (semi-detached) and mode 6 (double contact) remained. In the first set of iterations when the fit was near, the sigmas for each dataset were adjusted, based on the output of WD (viz. computed from the sum of residuals for each dataset plus number of points). The same values were then used throughout in order that results from the different iterations could be compared.
It would seem that mode 5 (semi-detached) gave the best solution, but only by a very small margin. Also, in view of the errors in the data, it seems clear that another data set might well favour a different mode. Therefore one cannot in confidence differentiate between the two modes. On the other hand, all produce virtually identical fundamental parameters—certainly well within the estimated errors.
Detailed reflections were tried, with nref = 2, but there was little—if any—difference
in the fit from the simple treatment. There are certain uncertainties in the process (see Csizmadia et al. 2013; Kurucz 2002). On the other hand, the solution is very weakly dependent on the exact values used.
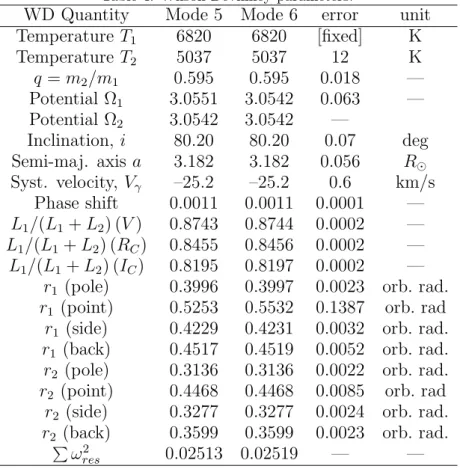
Table 4: Wilson-Devinney parameters.
WD Quantity Mode 5 Mode 6 error unit Temperature T1 6820 6820 [fixed] K Temperature T2 5037 5037 12 K q = m2/m1 0.595 0.595 0.018 — Potential Ω1 3.0551 3.0542 0.063 — Potential Ω2 3.0542 3.0542 — Inclination, i 80.20 80.20 0.07 deg Semi-maj. axis a 3.182 3.182 0.056 R⊙ Syst. velocity, Vγ –25.2 –25.2 0.6 km/s Phase shift 0.0011 0.0011 0.0001 — L1/(L1+ L2) (V ) 0.8743 0.8744 0.0002 — L1/(L1+ L2) (RC) 0.8455 0.8456 0.0002 — L1/(L1+ L2) (IC) 0.8195 0.8197 0.0002 —
r1 (pole) 0.3996 0.3997 0.0023 orb. rad.
r1 (point) 0.5253 0.5532 0.1387 orb. rad
r1 (side) 0.4229 0.4231 0.0032 orb. rad.
r1 (back) 0.4517 0.4519 0.0052 orb. rad.
r2 (pole) 0.3136 0.3136 0.0022 orb. rad.
r2 (point) 0.4468 0.4468 0.0085 orb. rad
r2 (side) 0.3277 0.3277 0.0024 orb. rad.
r2P(back) 0.3599 0.3599 0.0023 orb. rad.
ω2
res 0.02513 0.02519 — —
errors. Therefore third light was eliminated. In spite of the fact that spots might be expected on one or other stars, no attempt was made to include them, as there was no need. It seems likely that any indication of a spot occurring on the secondary would be overwhelmed by the light of the primary.
The two acceptable solutions are presented in Table 4. For the most part, the error estimates are the formal errors provided by the WD routines and are known to be low; the actual errors may be several times the quoted ones. However, it is a common prac-tice to quote these estimates, and we do so now. Also, estimating the uncertainties in temperatures T1 and T2 is somewhat problematic. A common practice is to quote the
temperature difference over—say—1.5 spectral sub-classes (assuming that the classifica-tion is good to one spectral sub-class). In addiclassifica-tion, various different calibraclassifica-tions have been made (Cox 2000, page 388–390 and references therein; and Flower 1996), and the variations between the various calibrations can be significant. Here a spectral type (for star 1) was determined to be F3(±1) sub-classes. Then the uncertainty over one and one half spectral sub-classes gives an uncertainty of ±200 K to the absolute temperatures of each. The modelling error in temperature T2, relative to T1, is indicated by the WD
output to be much smaller, around 12 K.
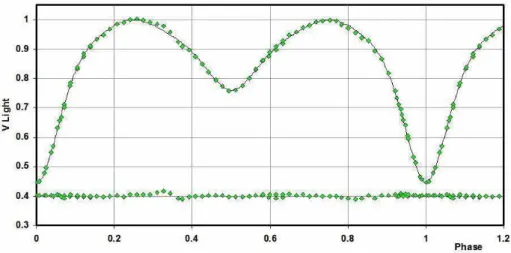
The light curve data and the fitted curves are plotted in Figures 3–5. The residuals (in the sense observed-calculated) are also plotted, shifted upwards by 0.40 units.
The radial velocities and the fit are plotted in Fig. 6. A three-dimensional representa-tion from Binary Maker 3 (Bradstreet, 1993) is depicted in Fig. 7.
6 IBVS6203
Figure 3. V light curves for V2197 Cyg – data, WD fit, and residuals.
Figure 4. RC light curves for V2197 Cyg – data, WD fit, and residuals.
Figure 6. Radial velocity curves for V2197 Cyg – data and WD fit.
Figure 7. Binary Maker 7 representation of the system – at phases 0.75 and 0.97.
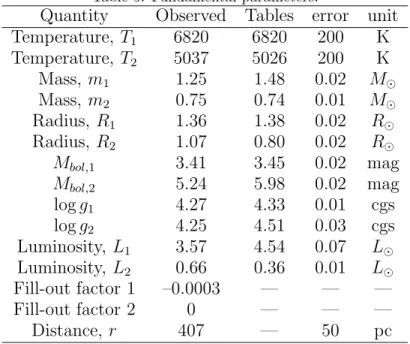
The WD output fundamental parameters and errors are listed in Table 5 using the data from the mode 5 solution (and are virtually identical with those from mode 6). From its temperature, star 2 was assumed to be spectral class K2. Most of the errors are output or derived estimates from the WD routines. From Kallrath & Milone (1999), the fill-out factor is f = (ΩI− Ω)/(ΩI− ΩO), where Ω is the modified Kopal potential of the system,
ΩI is that of the inner Lagrangian surface, and ΩO, that of the outer Lagrangian surface,
was also calculated.
To determine the distance r, the analysis proceeded as follows: first the WD routine gave the absolute bolometric magnitudes of each component; these were then converted to the absolute visual (V ) magnitudes of both, MV,1 and MV,2, using the bolometric
corrections BC = –0.120 and –0.420 for stars 1 and 2 respectively. The latter were taken from interpolated tables constructed from Cox (2000). The absolute V magnitude was then computed in the usual way, getting MV = 3.39 ± 0.12 magnitudes. The apparent
magnitudes in the B and V passbands were B = 12.10 ± 0.01 mag and V = 11.65 ± 0.01 mag (presumed errors), taken from the Andronov et al. (1993). The colour excess (in B–V) was obtained in the usual way, by subtracting the tabular value of B–V (for that spectral class) from the observed value. This gave E[B–V ] = +0.07 ± 0.08 magnitudes.
8 IBVS6203
Table 5: Fundamental parameters.
Quantity Observed Tables error unit Temperature, T1 6820 6820 200 K Temperature, T2 5037 5026 200 K Mass, m1 1.25 1.48 0.02 M⊙ Mass, m2 0.75 0.74 0.01 M⊙ Radius, R1 1.36 1.38 0.02 R⊙ Radius, R2 1.07 0.80 0.02 R⊙ Mbol,1 3.41 3.45 0.02 mag Mbol,2 5.24 5.98 0.02 mag log g1 4.27 4.33 0.01 cgs log g2 4.25 4.51 0.03 cgs Luminosity, L1 3.57 4.54 0.07 L⊙ Luminosity, L2 0.66 0.36 0.01 L⊙ Fill-out factor 1 –0.0003 — — — Fill-out factor 2 0 — — — Distance, r 407 — 50 pc relation: r = 100.2(V −MV−AV+5) pc (2)
The errors were assigned as follows: δMbol,1 = δMbol,2 = 0.02, δBC1 = 0.015, δBC2 =
0.120 (the variation over 1.5 spectral sub-classes), δV = 0.02, all in magnitudes. Com-bining the errors rigorously (i.e., by adding the variances) yielded an estimated error in r of 51 pc.
The distance estimate is in statistical agreement with the value of 320 ± 50 pc from the Gaia Catalogue1 (Gaia Collaboration 2016, Lindegren et al. 2016).
For comparison, the tabular values for the fundamental parameters, taken from Cox (2000) for F3 and K2 main sequence stars, are given in Table 5. Of course, these apply to detached stars, which these are not; however, comparisons are useful. Star 1 is seen to be undermassive and underluminous for F3 (and the same for F4 which has a tabulated mass of 1.44 M⊙ and a luminosity of 4.04 L⊙) while star 2 has a larger radius (which is
to be expected for one that fills its Roche lobe) and a higher luminosity (a function of its larger radius). The luminosities are fairly close but display differences, as one would expect for interacting stars.
In conclusion, the fundamental parameters of this system have been determined, albeit to a somewhat lower level of precision than one would like, mostly due to the uncertainty in the spectral class and the degree of interstellar absorption. Also, more accurate pho-tometric data might enable one to distinguish definitively between the various modes.
Acknowledgements: It is a pleasure to thank the staff members at the DAO (especially Dmitry Monin, David Bohlender, and the late Les Saddlmyer) for their usual splendid help and assistance.
This work has made use of data from the European Space Agency (ESA) mission Gaia 1
Consortium (DPAC, https://www.cosmos.esa.int/web/gaia/dpac/consortium). Funding for the DPAC has been provided by national institutions, in particular the institutions participating in the Gaia Multilateral Agreement.
The eclipse timing (O–C) Excel file may be found online at Nelson (2016).
References:
Andronov, I. L., Chinarova, L. L., Kolesnikov, S. V., Shakhovskoy, N. M.. Shvechkova, N. A., 1993, IBVS, No. 3933
Andronov, I. L., Chikrigin, A. V., Kimeridze, G. N, 1994, Odessa Astron. Pub., 7, 89 Bradstreet, D.H., 1993, “Binary Maker 2.0 – An Interactive Graphical Tool for
Pre-liminary Light Curve Analysis”, in Milone, E.F. (ed.) Light Curve Modelling of Eclipsing Binary Stars, pp 151-166 (Springer, New York, N.Y.)
Cox, A. N., ed, 2000, Allen’s Astrophysical Quantities, 4th ed., (Springer, New York, NY) Csizmadia, S., Pasternacki, T., Dreyer, C., Cabrera, A., Erikson, A., Rauer, H., 2013,
A&A, 549, A9 DOI
Cutri, R.M., et al., 2003, VizieR On-line Data Catalog: II/246 Flower, P. J., 1996, AJ, 469, 355 DOI
Gaia Collaboration, Prusti, T. et al. 2016, A&A, 595, A1 DOI
Hoffman, D. I., Harrison, T. E., Coughlin, J. L., McNamara, B. J., Holtzman, J. A, Taylor G. E., and. Vestrand, W. T., 2008, AJ, 136, 1067 DOI
Høg, E., et al., 2000, A&A, 355, L27
Kallrath, J., Milone, E. F., 1999, Eclipsing Binary Stars–Modeling and Analysis (Springer-Verlag)
Kallrath, J., Milone, E.F., Terrell, D., and Young, A.T., 1998, ApJ, 508, 308 DOI Kreiner, J.M., 2004, AcA, 54, 207
Kurucz, R.L., 2002, Baltic Astron., 11, 101 Lindegren, L. et al., 2016, A&A, 595, A4 DOI Margoni, R., Stagni, R., 1984, A&AS, 56, 87
Nelson, R.H., 2009, Software, http://www.variablestarssouth.org/profilegrid blogs/software-by-bob-nelson/
Nelson, R.H., 2010a, Spreadsheets, http://www.variablestarssouth.org/profilegrid blogs/spreadsheets-by-bob-nelson/
Nelson, R.H., 2010b,“Spectroscopy for Eclipsing Binary Analysis” in The Alt-Az Initia-tive, Telescope Mirror & Instrument Developments (Collins Foundation Press, Santa Margarita, CA), R.M. Genet, J.M. Johnson and V. Wallen (eds)
Nelson, R.H., 2016, Bob Nelson’s O–C Files, http://www.aavso.org/bob-nelsons-o-c-files Nelson, R. H., S¸enavcı, H.V. Ba¸st¨urk, ¨O., Bahar, E., 2014, New Astron., 29, 57 DOI Rucinski, S. M., 2004, IAUS, 215, 17
Skiff, B.A., 1997, IBVS, No. 4431
Terrell, D., 1994, Van Hamme Limb Darkening Tables, vers. 1.1. Van Hamme, W., 1993, AJ, 106, 2096 DOI
Wilson, R.E., Devinney, E.J., 1971, ApJ, 166, 605 DOI Wilson, R.E., 1990, ApJ, 356, 613 DOI