CRISPLANT DEFECTS QUANTIFICATION AND REDUCTION AT AN AMAZON.COM DISTRIBUTION CENTER
By Kashyap Patel B.S., Electrical Engineering
University of Illinois at Urbana-Champaign, 2004
Submitted to the MIT Sloan School of Management and Department of Mechanical in Partial Fulfillment of the Requirements for Degree of
Master of Business Administration AND
Master of Science in Mechanical Engineering In conjunction with the Leaders for Global Operations at the
Massachusetts Institute of Technology June 2010
© 2010 Massachusetts Institute of Technology. All rights reserved. Signature of Author Engineering
ARCHIVES
MASSACHUSETTS INSTITUTE OF TECHNOLOGYJUN 0 8 2010
LIBRARIES
MIT Sloai~Sel-I T-Management MIT Department of Mechanical Engineering May 07, 2010 Certified by
Roy iVlsch, Ph.D. Thesis Advisor Professor of Statistics and Management Science, MIT Sloan School of anagement
Certified by
Senior Research Scientist,
Accepted by
Executive Director of MBA
Stanley Gerslin, Ph.D. Thesis Advisor MIT Departme144f Mechanical Engineering
Debbie Berechman progr IT Sloan School of Management
Accepted by
David E. Hardt, Ph.D. Chairman, Mechanical Engineering Committee of Graduate Students
CRISPLANT DEFECTS QUANTIFICATION AND REDUCTION AT AN
AMAZON.COM DISTRIBUTION CENTER By
Kashyap Patel
Submitted to the MIT Sloan School of Management and Department of Mechanical Engineering on May 07, 2010 in Partial Fulfillment of the Requirements for Degree of
Master of Business Administration and Master of Science in Mechanical Engineering
ABSTRACT
Crisplant is a tilt-tray sortation system used in Reno (RNO 1) fulfilhnent center (FC) to group items by customer orders. On average., crisplant processes about 80% of the total outbound volume through its multipart operation flow. Because of high volume and complex process flow, the majority of defects, in RNO 1 FC. are seen in crisplant costing distribution center (RNO 1) significantly in labor hours. This research paper identifies and quantifies the major defects in crisplant, and outlines the solutions to reduce the cost of handling these defects in RNO 1. The project work thoroughly assesses the entire RNO 1 crisplant operations (induct, sort, pack,
SLAM, and problem solve) through four-phase approach: Understand the crisplant Process Flow,
Develop a Data Collection Framework, Collect and Analyze Data, and Identify/Implement Data Driven Solutions. Lean principles and methodologies were used throughout the project work especially when identifying solutions. For example, opportunities that improved the packing process were identified based on a deep-dive analysis as a part of the Kaizen study.
The project results demonstrated 50% reduction in cost of handling crisplant defects in RNO l. Furthermore, it highlighted opportunities for additional savings by identifying solutions that can also be implemented in other FCs (i.e. SDF 1, TUL 1) with similar operation as RNO 1.
Thesis Advisor: Roy Welsch
Title: Professor of Statistics and Management Science Thesis Advisor: Stanley Gershwin
NOTE ON PROPRIETARY INFORMATION
In order to protect proprietary Amazon information, the data presented throughout this thesis has been altered and does not represent actual values used by Amazon.com Inc. The figures and results do not represent the actual values that were found or calculated during this project work. Any dollar values, process names and/or product information have been disguised, altered, or converted to percentages in order to preserve any valuable information from the competitors of Amazon.com Inc.
TABLE OF CONTENTS
A bstract... 3
Table of Contents ... 7
List of Figures...8
List of Tables ... 8
A cknow ledgm ents ... 9
Chapter 1. Introduction... 11
1.1 Project M otivation... 11
1.2 Problem Statement... 11
1.3 Thesis Overview ... 12
Chapter 2. Industry and Com pany Background ... 13
2.1 Online Retail Industy... 13
2.2 Amazon.com ... 14
2.2.1 Overview... 14
2.2.2 Amazon -The Evolving River... 14
2.2.3 Amazon.com Fulfillment Centers... 16
Chapter 3. RNO 1 Fulfillm ent Center... 20
3.1 RNO1 Process Flow Overview:... 20
3.1.1 Inbound Operation:... 21
3.1.2 Outbound Operation: ... 22
3.1.3 Inventory Control and Quality Assurance (ICQA):... 24
3.2 Crisplant Operation:... 25
Chapter 4. Literature Research... 28
4.1 Fulfillment Operation... 28
4.2 Leaner M eaner Fulfillment Operation ... 30
Chapter 5. Project Approach... 32
5.1 Evolution of Project Objectives ... 32
5.2 Project Approach... 33
5.3 Project through Three Lens view ... 36
Chapter 6. Project R esults & C onclusion:... 40
6.1 Sunmm ary... 40
6.2 Crisplant Defects Identification and Quantification: ... 41
6.3 Root Cause Analysis and Defects Reduction:... 43
Chapter 7. Appendix: ... 53
LIST OF FIGURES
Figure 1: U .S. Online Retail Sector Revenue (* = forecast)... 13
Figure 2: Long, Long Path to Profits ... 15
Figure 3: Am azon Sortable Fulfillm ent Centers ... 17
Figure 4: Non-Sortable Fulfillm ent and Replenishm ent Centers ... 18
Figure 5: RNO1 Operation Process Flow ... 20
Figure 6: RNO 1 Process Path ... 21
Figure 7: RNO1 Inbound Process Flow ... 22
Figure 8: RNO1 Outbound Process Flow ... 23
Figure 9: Crisplant Operation ... 25
Figure 10: Pictures of RNO 1 Sorter and Chute M echanism ... 26
Figure 11: Crisplant Inputs and Outputs ... 27
Figure 12: Project Phases... 33
Figure 13: View of Crisplant Functions... 34
Figure 14: Initial, Current and Future State of Defects ... 40
Figure 15: Snapshot of SPS Tool... 44
Figure 16: Packing Tim e Study ... 44
Figure 17: Chute Rake Operation ... 45
Figure 18: Problem Solving Vicious Cycle ... 46
Figure 19: Hot-picks and Put-back Reduction... 47
Figure 20: Induct Overage Reduction... 49
Figure 21: NoM aps by Induct Station... 51
Figure 22: SPOO Label M isalignm ent Fix... 52
LIST OF TABLES Table 1: Cost Components and Calculation... 41
Table 2: Defects Processing Rate (UPH - Units per Hour) Calculation ... 41
Table 3: M issing SPOO Processing Rate ... 42
Table 4: Paper Picking Rate & Cost ... 42
Table 5: Strays/NoM aps/Induct Overages Processing Rate ... 42
Table 6: Pack-short Processing Rate... 42
Table 7: Chute Jam Handling Rate ... 42
Table 8: Put-back Processing Rate ... 42
Table 9: SPS Tool and Associated Savings ... 43
ACKNOWLEDGMENTS
The research work documented in this paper would not be possible without extensive support, cooperation and encouragement of many generous and smart people. First. I would like to acknowledge my advisors Roy Welsch and Stanley Gershwin for their guidance and support throughout this project. I would also like to acknowledge Amazon for sponsoring my internship and continuing to support the Leaders of Global Operations (LGO) program.
I would sincerely like to thank my supervisor Jim Sharkey at Amazon whose guidance and immense knowledge provided satisfying learning experience. I truly appreciate Jim's unparalleled support throughout the project. I further admire his thought leadership, which played pivotal role in making this project successful. I would also like to thank Kerry Person., Brian Duarte, Nadya Dhalla, Brent Hill and Brian Jordan for sharing their time, resources and insights.
Finally and most importantly, I would like to thank my family for their constant support. I would especially like to thank my fiance, now wife Payal, for managing the wedding
Chapter 1. Introduction
1.1 Project Motivation
Since its inception in 1994, Amazon has matured through multiple identities: from online bookstore to #1 online retailer to the creator of Kindle. From what started as just an online bookstore, Amazon now sells millions of products from music, movies and video games to apparel, jewelry and household gadgets, even Uranium ore. The fast evolution of Amazon as a company can be attributed to its vision': "to be earth's most customer centric company; to build a place where people can come to find and discover anything they might want to buy online."
The product diversification resulted from the aforementioned vision has enabled Amazon to be the world's largest online retailer. This diversification of the product offering, however, has created unique challenges for Amazon's fulfillment operations. Since Amazon started as an online bookstore, the majority of processes and machines, in its early fulfillment centers, were designed to handle only books. Consequently, as product offerings grew tenfold, all the auto sortable fulfillment centers including RNO 1 started to experience a unique set of defects. Until this research project, there has not been a comprehensive, systematic analysis of the defects and these defects were managed through workaround process rather than thorough root-cause analysis.
While RNO 1 and other fulfillment centers alike have continued to perform and meet customer expectations, a robust study of the defects is essential in sustaining RNO l's performance. This project work is a systematic, analytics driven approach to thoroughly understand the frequency and magnitude of defects in RNO 1 crisplant operation.
1.2 Problem Statement
On average, crisplant processes about 80% of the total outbound volume through its
multipart operation flow. Because of the high volume and complex process flow, the majority of IAmazon.com IR Home. (2010).
defects in RNO1 FC are seen in crisplant costing distribution center (RNOl) significantly in labor hours. The research internship seeks to identify and quantify the major defects in crisplant, and reduce the cost of handling these defects in RNOl.
1.3 Thesis Overview
The research project took place at RNO1 Amazon fulfillment center in Fernley, Nevada from February 2009 to August 2009. The thesis document is a result of this internship work, and the
collaboration and cooperation between MIT faculties and Amazon employees. The document is organized as described below.
Chapter 1 describes the project motivations and the problem statement.
Chapter 2 provides overview of online retail industry, Amazon background, and its fulfillment network.
Chapter 3 provides the detailed overview of the RNO 1 fulfillment center including inbound. outbound and crisplant operations.
Chapter 4 presents the literature research specifically in fulfillment operation and applications of lean principles in the operation world.
Chapter 5 highlights the project approach and how the project fits within all three lenses: strategic, cultural and political.
Chapter 6 presents project findings and results. It details all the major defects in RNO1 crisplant along with their root causes and financial impacts.
Chapter 2. Industry and Company Background
2.1 Online Retail Industry
The online retail industry is commonly defined as all the business-to-business (B2B) and business-to-consumer (B2C) sales transactions that are performed through online channels. In
1992, the U.S. Supreme Court freed2 online retailers from collecting sales tax in the states where they were not physically present. The ruling played a critical role in evolving the U.S. online industry to where it is now.
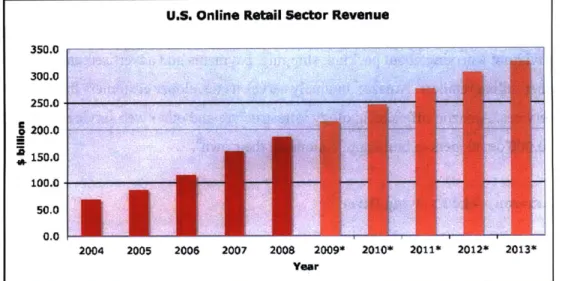
In the year 2008, the U.S. online retail sector grew by approximately 16.60% from the previous year, generating a total of $187 billion. From 2004 to 2008, the U.S. online retail
sector grew at a compound annual growth rate (CAGR) of 28.1% (see Figure 1). In recent years, online retailing is one of the few positives for the retail industry. In fact, online retail is expected to grow at a CAGR of about 11%. Although the online sector seems to be maturing, it still provides strong potential for growth compared to the rest of the retail industry.
Figure 1: U.S. Online Retail Sector Revenue (* = forecast)
2 (The History of E-Commerce, 2009) 3 (Online Retail in the United States, 2009)
The Dot COM Investment Burst in 2000 severally impacted the e-commerce industry. Consequently, several online retail stores went out of business. However, although websites were closing down in Wall Street, the popularity of online purchase was growing among Main Street. Online sales increased by 48% to $43 billion in 20004.
2.2 Amazon.com
2.2.1 Overview
Headquartered in Seattle, Washington, Amazon.com (Amazon) is one of the global
leaders in e-commerce. Since its incorporation in 1994, it has quickly evolved from a
conventional dot-com website to an e-conunerce factory providing a vast array of products and services. Amazon primarily serves three types of customer groups5: consumer customers, seller customers, and developer customers. Amazon offers varieties of products and services to all three customer groups through various channels. For example, Amazon serves consumer customers through its amazon.com and other international retail websites (amazon.ca,
amazon.cn, amazon.fr, amazon.de, amazon.jp, and amazon.uk). For seller customers, Amazon offers services like Selling on Amazon, Fulfillment by Amazon, Checkout by Amazon and Advertise on Amazon. These complete sets of services enable seller customers to sell their products without worrying about packing. shipping, payments and advertisements. Furthermore, unlike other online retailers, Amazon uniquely serves its developer customers through a portfolio of web services. Amazon offers technology infrastructure and other web services that enable about 330,000 developers to build applications on their own".
2.2.2 Amazon - The Evolving River
Work Hard. Have Fun. Make History - philosophy on which Jeff Bezos has built the e-commerce giant, Amazon. In its short 14 years history, Amazon has matured through multiple
4 (The History of E-Commerce, 2009)
5 (Dow Jones Company Report Amazon.com, Inc., 2010) 6 (Amazon Services -Amazon Business Solutions, 2010)
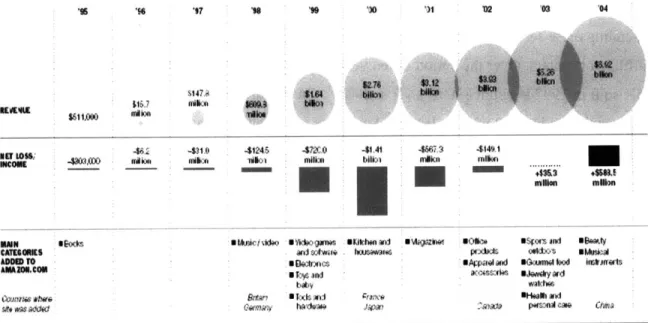
identities: online bookstore to #1 online retailer to the creator of Kindle. From what started as just an online bookstore, Amazon now sells millions of products from music, movies and video games to apparel, jewelry and household gadgets, even Uranium ore7.Known as both the best and the worst of the dot-com era, Amazon has emerged out of all odds. Bears of dot-com era
were certain about the collapse of Amazon and Bezos - Amazon.bomb and Amazon.toast were a
few names used to describe the future of Amazon at the times. The company turned a corner when it recorded its first profit in year 2004 after long journey of burning cash (see Figure 2).
'5 1 17 'I 1 V0 1 '02 '4
s147.4
$611.000
46. -531.0 41245 471200 41,41 4667.3 41491
4903.(00 mlon mic ioi milbi WWII b Noon
* f Uimn
mlnMW SEac *MusicI do sydnogeanes @Kinhenand @*Wgazne 6oIe *spors and Dw~.ty
CA1160IIS and sofwto housawtaes prxhts Ovkto-s *MusIa
AD= To -Electones §Apiid o umw Wtod instmarts
A T2. and c sJe ry ard
baby watchae
tMogn tw. & ntan Tods and rrance OHeaMa and
sg was ad ~ad Gmiy hA'dwr Jswa 2oa pro cae Chma
Sowca-arp yWpeu- * M neuervw-rOW
Figure 2: Long, Long Path to Profits9
Innovation has been the core of Amazon's success and Bezos & Company has often shocked both Wall Street and Main Street through its innovative offerings (i.e. Fulfillment by Amazon). Nothing, however, went beyond the public imagination like Kindle, Amazon's e-reader. Although it is not the first of its kind in the world of e-book readers, Kindle certainly has been the greatest hit, selling hundreds of thousands of units since its launch in November 2007. With Kindle, Jeff Bezos has potential to do to the book publishing industry what Steve Jobs has
done to the music industry through Apple iPod and iTunes. Some might call this potential (Images SI Inc., 2010)
8 (Hamilton, 2004) 9 (Rivlin, 2005)
evolution in the $24 billion book publishing industry dangerous, but according to Bezos "What's very dangerous is not to evolve"'0.
2.2.3 Amazon.com Fulfillment Centers
Fulfillment centers (FCs) are the backbone of any online retailer and they play critical role in providing quality customer service. For Amazon, the comprehensive network of its fulfillment centers (FC) is one of its core strengths. In fact. Amazon has developed such a robust and complete set of filfillment software and hardware that it now earns additional revenue by extending these services to other big retailers (i.e. Target). As Amazon evolved, so did its
fulfillment centers. Over the period of ten years. Amazon domestic warehouse space grew from 85K sq ft in 1997 to about 8900K sq ft in 2007". On the international front. Amazon opened its first warehouse in 1998 when it launched websites in UK and Gennany. In 2007, its international warehouse space grew to about 4700K sq ft from 42K in 1998.
Amazon now has an extensive network of domestic and international fulfillment centers. Primarily there are four types of fulfillment centers: Sortable, Non-Sortable, Small Sortable, and Replenishment.
Sortable Fulfillment Centers:
Sortable FCs are capable of combining multiple items. There are two types of Sortable FCs in the network: Auto Sort and Manual Sort. The major difference between the two types is the way products are sorted. In Auto Sort FCs, an automatic machine, called crisplant2. is used to sort multiple products, whereas. in Manual Sort FCs associates manually scan and sort each item. Both FCs have their advantages and disadvantages. In Auto Sort FCs, the Crisplant capacity can become a bottleneck, especially during high volume peak seasons, since the
10 (Penenberg. 2009) 11 (Quittner, 2008)
majority of products have to flow through the crisplant. On the other hand, capacity can easily be increased or decreased, in Manual Sort FCs, by adjusting the number of associates.
Figure 3: Amazon Sortable Fulflment Centers i
The product dimensions limit the types of products that can be processed through the Auto Sortable FCs. Since products are conveyed in the plastic rectangle type containers, Auto Sortable FCs can only handle products that can fit into these totes. For example, Auto Sortable FCs usually handles smaller products like books, media, iPods etc.
13 (Zachary, 2008)
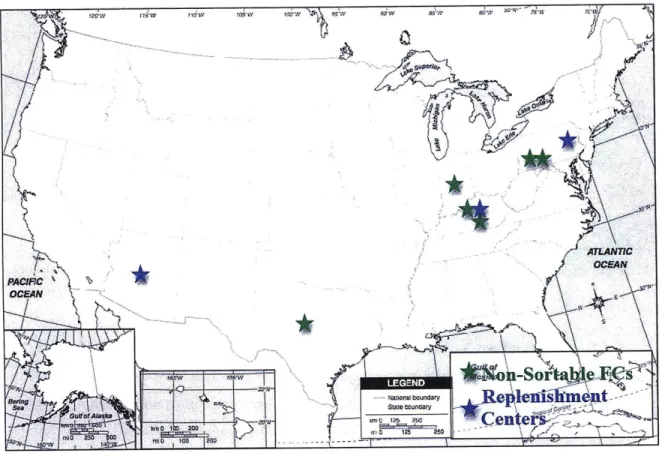
Non-Sortable Fulfillment Centers:
Non-Sortable FCs handle almost any products that are too large to handle in Sortable FCs. These products are usually big kitchen appliances, large electronics, furniture and other
large equipments. For most cases, multiple items for same orders are shipped separately because it is not economically beneficial to combine multiple items and repackage into one order. Furthermore, since products are large in size, they sometimes are shipped in their original boxes. However, some products are re-boxed and shipped in Amazon packing.
Figure 4: Non-Sortable Fulfillment and Replenishment Centers14
Small Sortable Centers:
Although Sortable and Non-Sortable FCs are the most common, there are a few small sortable centers in the Amazon FC network. The small sortable centers were built to essentially store the fast moving items close to customers so Amazon can serve its customer better. Hence. most of the small sortable centers are located near metropolitan areas. So instead of shipping fast moving inventory from multiple normal FCs, small sortable centers store and ship these items to the customers in timely manner.
Replenishment Centers:
The replenishment centers (RCs) act as a buffer in the distribution channel. There are two primary functions of replenishment centers. They receive products from vendors and they also move products between the fulfillment centers. The replenishment centers smooth out the fluctuations in the demand and they also allow Amazon to operate the network at lower safety stock.
Chapter 3. RNO1 Fulfillment Center:
3.1 RNO1 Process Flow Overview:
The internship project took place at the Fernley, Nevada (RNO 1) fulfillment center, which opened in February 1999. RNO1 is about 800,000 square feet with over ten miles of
conveyors15. RNO1 plays major role in meeting Amazon customer demands. RNO1 is one of the
three Auto Sortable FCs in the Amazon domestic FC network. Coffeyville, KS (TUL1) and Campbellsville, KY (SDF1) are the other two Auto Sortable FCs in the network.
Vendor Returm VASC I Prep
Cuacso Supplers Unload, check in, inventory
placesm odrCaselpalle
Sortaiton/Cflsplant
06 sort SLAM
Scan Label Apply Manifest Package is sealed, shipping label applied
Figure 5: RNO1 Operation Process Flow1 6
From receiving to shipping, RNOl has multiple departments and process paths. Largely RNOl operations can be separated into two sub-operations: Inbound and Outbound. In addition
15 (Filing Amazon's Tall Orders, 2005)
there are two auxiliary departments, Problems Solving and ICQA (Inventory Control and Quality Assurance) that supports entire RNO1 operation. Unlike ICQA, Problem Solving is not a stand-alone department but rather embedded into every function. On the other hand, ICQA is
centralized and its major function is to independently assess and control the quality within the RNO 1 operation.
Inbound Operation Outbound Operation
C Dock RSS Inventory Picking Packing Shipping
suppliers Customer
Tnventnrv Conntrol and Oniality Awqanrance (TCOA) k. Prnhlem Rnlvino 7
Figure 6: RNO1 Process Path
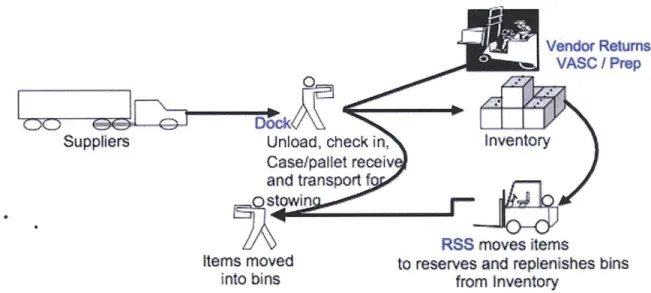
3.1.1 Inbound Operation:
Inbound operation is triggered when product delivery is received by the FC. Inbound is responsible for receiving, docking, stocking, and stowing all the items coming into the FC. Dock
and RSS (Replenish, Stock and Stow) are two major departments in inbound. Usually there are four different ways products are received at the dock: case receive, pallet receive, transship and each receive. Upon receiving the products through one of the aforementioned receive paths; they are stored in the staging area/inventory. RSS moves all the products from the staging area into either reserve bins17 or prime bins". Most of the inventory items are moved into a tote and then an inbound associate stows one item at a time from the tote to a bin. There are two primary goals of inbound operation. First, receive inventory promptly so that customer orders can be fulfilled without any delay. Second, remove as many defects as possible at the receive stage in order to
eliminate larger impacts downstream.
17 A bin that holds extra inventory
Vendor Returns VASC0 /
Prep-E~Dckc
L
Suppliers Unload, check in, Inventory
Caselpallet receiv and transport f stowin
RSS moves items
Items moved to reserves and replenishes bins
into bins from Inventory
Figure 7: RNO1 Inbound Process Flow
3.1.2 Outbound Operation:
Outbound plays the crucial role in delivering customer orders on time. In RNO 1, customer orders can be classified into two types: Single item orders and Multi item orders. Single item orders are processed through Single Process Path, whereas Multi orders are processed through an automated sortation system called crisplant or levimatic.
Outbound operation is triggered when a customer order is placed and dropped into RNO1 for delivery. Outbound operation is made of four major functions: Picking, Sorting, Packing and Shipping. There is also a designated Problem Solving department in all four major functions that handles the majority of defects and processes dwelling orders when necessary.
As indicated in the process flow diagram, Picking is the beginning of the order fulfillment process in RNO1. Associates who work in the picking department are known as Pickers. Each picker is assigned a specific area called picking zone. There are multiple picking zones within the RNOI FC. There could be multiple pickers in one picking zone depending on the picking demand and available associates. Each picker is given a specific picking path, which in most cases is identified by the picking software based on the open orders and available associates. Because of the optimization of the picking path, two items of the same customer
order could be picked at different times. These items will be matched downstream in the sorting process. Based on its contents, a tote leaving from the picking department goes through one of the five process paths: crisplant, Single TEKHO, SMoL's, Gift Wrap and Transship.
bFu and Places thOm Places order
on conveyors
SCin ms a toutes I Boxed orders
to ssp ths S convy to SLAM
FCA~svimanNDFI
Mu o c sn bued to i Bond orders
SortaOn orvey to SLAM
Scan Labe Appl ant Package is seeleW, sh*ppen lab apphed Fgure 8: RN 1 Outbound Process Flow
Crisplant handles all totes carrying multi items orders and sorts items by orders so that they can be processed through packing. Please refer to crisplant section for more details.
Orders with single Toys, Electronics, Kitchen, Home and Office items are handle through the Single TEKHO process paths. Single TEKHO is one of the few process paths that run
parallel to crisplant. The primary objective to run Single TEKHO is to offload some customer demands from crisplant because there is no point in sorting single item orders.
SMoL (Small Multies on Levimatic) is another parallel process to the crisplant. Excluding few differences, the SMoL process path is essentially a manual version of the crisplant, designed to handle orders that contain only CDs and DVDs. Incoming totes carrying CDs and DVDs are manually sorted by orders through a rebin process. These sorted orders are
then fed into the automatic packing machine called Levimatic 9. There are two advantages of processing orders through SMoL instead of crisplant. The combination of manual sorting and automatic packing increases the throughput while reducing the shipping cost.
Some customer orders are gifts and therefore require special processing. Totes carrying gift orders are sent to the Gift Wrap department where they are manually sorted and packed. The demand for the Gift Wrap process paths changes significantly during holidays (i.e.
Thanksgiving, Christmas, Valentines Day etc.).
Transship is significantly different from the rest of the aforementioned process paths. Transship does not process any customer orders but rather orders for other fulfillment centers. Since these are intra FC orders they do not require special sorting or packing. Usually, all transship items are picked into the same totes and items are then sent to an appropriate FC in totes instead of boxes.
3.1.3 Inventory Control and Quality Assurance (ICQA):
As shown in Figure 6, ICQA oversee the entire RNOl operation from the quality standpoint. ICQA is not directly involved in processing the customer orders instead it ensures that a right item is picked, packed and shipped to a right customer. Primarily ICQA works with individual department to improve necessary processes in order to keep the RNO I quality metrics (i.e. free replacement rates) in check.
Moreover, ICQA also processes customer returns. These are the orders that were usually returned, refused or undelivered. After processing each customer returns, items are either put back into the inventory (if sellable) or into damage bins (if unsellable). Inventory control is another critical fumction of ICQA. The goal of the inventory control is to ensure that the virtual inventory matches with the physical inventory. Consequently, ICQA associates conduct regular audits to identify and eliminate any inventory defects.
19 Levimatic is a high-speed automatic material handling equipment used to pack CDs & DVDs without requiring
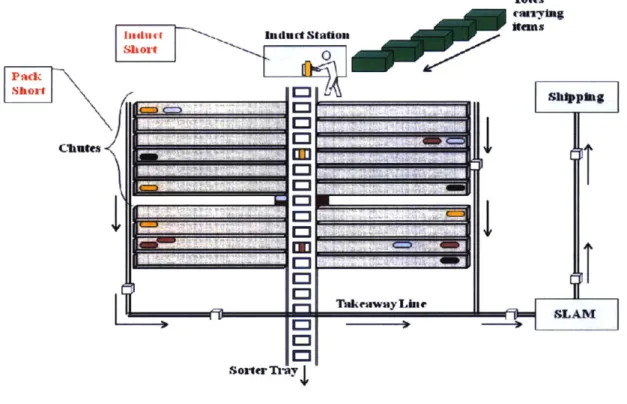
3.2 Crisplant Operation:
Totes emty"g
In duEt Induct Station
Short Pack Sdpi
IMI
I LI'
TakeawayLbSe 1=1 SorterTrayIFigure 9: Crisplant Operation
Crisplant is the core of RNOl outbound operation. Crisplant is essentially a tilt-tray mechanism used in the auto-sortable Amazon FCs (i.e. RNOl) to group the shipment items for packing. On average, crisplant processes about 80% of the total outbound volume. Because crisplant processes such a high volume and has a complex process flow (induct, sort, chute, & slam), it has been a significant challenge for RNO1 to reduce defects without negatively impacting productivity. Furthermore, of all the defects in outbound process flow, the majorities are crisplant specific and are seen with significantly higher frequency in crisplant than in other departments. Thus, the scope of the project was limited to the crisplant operation.
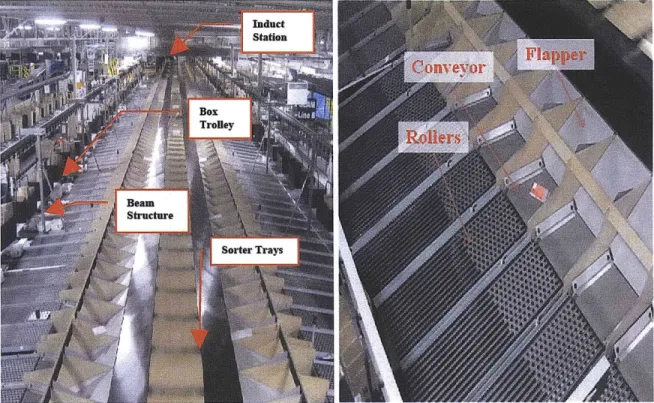
-Figure 10: Pictures of RNO1 Sorter and Chute Mechanism
As shown in Figure 9, totes carrying items from picking arrive at the induct station in crisplant, which is the first step of the crisplant operation. There are four major functions in the RNOl crisplant: Inducting, Sorting, Chuting (Packing), and SLAM.
At an induct station, an inductor" removes an item from a tote, and scans it, and then places the item on the inductor belt. The inductor belt then conveys the item onto a sorter tray. The sorter tray circulates around the crisplant and tilts an item into a designated chute, which is called sorting. Every open customer order in the crisplant has a designated chute, assigned by software. The designated chute will turn on a visual indicator when all items of the assigned order are tilted. Upon turning on the visual indicator, a chuter1 packs out an order from the chute into a box and moves the box onto a conveyor. The box travels to the next step in the process called SLAM (Scan Label Apply Manifest). SLAM is the last processing step in crisplant
20 Inductor is an associate who performs the inducting job function in crisplant.
operation. Boxes from the chuting arrive in SLAM for final quality check and packaging (i.e. shipping slip, dunnage etc.).
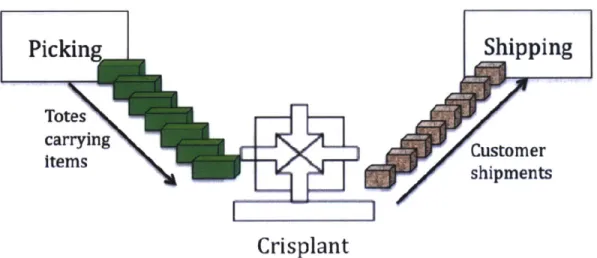
Totes N carrying
items Customer
shipments
Crisplant
FIgure 11: Crisplant Inputs and Outputs
In summary, crisplant sorts out all the incoming items by customer orders, pack them into a box and send them to shipping.
Chapter 4. Literature Research
4.1 Fulfillment Operation
The Business-to-Consumer (B2C) fulfillnent process (e-fulfillment) is fairly a new industry practice. However, in last 20 years, it has received much attention as the online industry has emerged and the company like Amazon has started focusing on its fulfillment operation as a competitive advantage. In fact, when Amazon was burning cash very quickly in its early days, it turned its attention towards improving the fulfillment operation as a means to reduce the cost and improve the customer experience. In recent years. both academic and industry have thoroughly researched the fulfillment strategy and operation in light of continuously evolving online industry. Unlike brick-and-mortar, B2C e-fulfillment is all about each individual item and individual customer orders where speed and accuracy plays a far more important role.
In the outbound fulfillment operation. speed and accuracy start from picking. Defects originated in picking have the potential to propagate and amplify in downstream processes and become more costly. Consequently, e-cominerce fulfillment centers constantly optimize the picking process. Primarily there are four types of picking methods widely used in industry: discrete, zone, batch and cluster. Please see (Sanez, 2000) for detailed descriptions of these picking methods. Furthennore, there are various picking technologies, pick/put-to-light,
pick-to-display. RFT (radio-frequency terninals), and wireless speech recognition systems. Robust distribution management system coupled with one of these effective picking methods reduces the defects in picking2 2. They help pickers pick the right items and right quantity on the first attempt.
As mentioned in the previous section, the majority of customer orders for e-conmerce fulfillment centers are small in size. However, these FCs compensate for small individual order size (compare to traditional warehouse) with extremely large order quantity. For instance, RNOl ships out millions of orders per year but with relatively small number of items per order. The small order size and large order quantity place unique demand on fulfillment operations (i.e. sortation) and its ability to manage such a flow of orders at high productivity with minimum or
no defects. A robust, high volume sorter capable of operating at fast speed enables batch picking, which in turns reduces direct labor and improves throughput. For small to medium volume
operation, FC uses pop-up wheel, pop-up belt, right angle transfers, push diverters and sliding shoe type sorters23. FCs also utilize sorter operation in the shipping department to minimize shipping costs. Usually, sliding shoe and push diverters are most frequently used in shipping operation. Larger FCs (like RNO1) have greater need for high speed, high volume sortation, hence, they most commonly use tilt tray, sliding shoe or cross-belt type sorters.
RNOl in particular uses a tilt tray type sorter. A tilt tray sorter is essentially a series of trays that travel in a loop. Products are inducted on to the trays, which physically tilt the item into the specific destination chute. Please see RNOl crisplant operation for more details. The other more common type is the sliding shoe sorter. These are versatile because they can be used
in various applications including diverting for pick zones, shipping, and order accumulation. These sorters have small knob-like shoe devices measuring approximately 6-inches in length. A series of these shoes slide in unison across the center of a moving conveyor, gently guiding product down spurs or chutes24.RNO 1 also has sliding shoe type sorter in the outbound
operation. Cross-belt sorters have a similar design to tilt trays but use short belts set perpendicular to the sortation system's accumulation chutes. As an item approaches its
destination, the belts power on, gently rolling the item into the chute. A fulfillment center of Adidas in Gennany uses cross belt type sorter-.
Flexibility is also essential in fulfilhnent centers (FCs). Due to the continuous
evolvement of the online retail industry, FCs that ship books and CDs today may fid themselves shipping canned food and trousers. Consequently, processes, especially sortation, in FCs must be adaptive to the increasing portfolio of product types without generating defects or impacting overall productivity. More and more FCs are concentrating on improving their sorter operation to minimize defects while improving productivity. "What we are seeing is that end users are trying
to squeeze as much out of their sortation systems as possible. They're looking for ways to get more out of their existing systems and looking for ways to nin them smarter" says Gregg
(Michael Tarn et al, 2003)
24
(Modem Materials Handling, 2000) 5(Modem Materials Handling, 2000)
Vandenbosch, global product manager for Dematic (616-931-6600, www.dematic.us). In fact, FCs are relying on enhanced sortation software to identify the defects26.
In summary, it is clear from the research study that sorting is one of most complex and critical processes in FC operation, which needs to be managed properly in order to achieve desired performance. Identifying key components of the sortation process and thoroughly
evaluating how they fit in the overall outbound operation are essential for a successful fulfillment operation.
4.2 Leaner Meaner Fulfilment Operation
In wake of the recent year financial crisis, even fulfillment centers and warehouses are shifting focus to an internal operation, adopting lean practices while continuing to cut costs. In fact, according to Logistics Management's 4 annual Warehouse/Distribution Center (DC) Operation Survey results "the industry continues to hunker down and look internally for ways to cut costs". More preciously the adoption of lean culture increased from 30% in 2008 to 39% in
200927 and RNOl is no exception. Amazon FCs, including RNOl, are turning to lean programs,
like Kaizen and Shingi events, to reduce or eliminate non-value added activities while reducing defects in operation.
Various tools are used to identify and eliminate waste from processes in distribution centers. Value stream mapping during a Kaizen project is one such tool. According to the case
study described in the Lean Supply Chain report. a DC (Distribution Center) of San Diego based Carl Zeiss Vision company utilized value stream mapping to eliminate non-value add steps from the process and reduced the total cycle time28. In addition to improving the process, improving
employees' morale and culture can also lead to decrease in defects. In fact, changing processes and redesigning work cells are just part of Kaizen. The real value of Kaizen lies in its ability to change culture and employees' attitude2 9. At Carl Zeiss Vision DC associates are required to
26 (Lorie King Rogers, 2009) 27(Maida Napolitano, 2009)
2 (Winiam Atkinson, 2009) 2 (Nancy Syverson, 2001)
participate in at least one lean implementation project, in order to generate a sense of
accomplishment among its associates. Similarly. RNO 1 often orchestrates multiple Kaizen/Lean Six Sigma projects and floor associates are encouraged to participate in each project. In fact, a lean implementation project team at RNO 1 consists of diverse set of individuals from operation managers to hourly associates to accountants.
Within Amazon, FCs conduct various Kaizen or Six Sigma type projects for a wide range of objectives: to increase productivity, reduce costs, eliminate defect, increase delivery time, etc. These projects serve as case studies in Amazon lean operation and provide helpful insights and benchmarking practices. For instance, a team at TUL FC demonstrated about 12% reduction in total overages in sortation process. Under project name "Crisplant Exception Chute
-OVERAGE" in year 2004, the team identified key lessons learned such as increase the frequency to pickup overage items, verify items prior to re-induct. and double picking.
Chapter 5. Project Approach
5.1 Evolution of Project Objectives
As mentioned before, crisplant is the heart of RNO1 outbound operation. However, due to diversification of the product offering on Amazon.com websites, fulfillment centers including
RNOl are facing significant challenges in minimizing defects while increasing productivity and meeting customer expectations. In addition, recent emphasis by Amazon, on prompt product delivery to the customers is increasing pressure on fulfillment centers. This aggressive customer delivery targets have enforced FCs (i.e. RNO 1) to focus on reducing non-value add activities by minimizing defects in the operation processes.
For instance, customers can order Amazon products for next day delivery late into the afternoon. In most Amazon Fulfillment Centers (FCs), orders can still be placed within four hours of the last truckload departure to the airport. Due to this late cut-off time for customer orders, the FCs have set up a "factory within a factory" to expedite these orders and resolve other issues with delayed customer orders. This process is known as "chasing" because it uses people to manually locate individual orders instead of relying on the automated processes.
Essentially chasing is a workaround process; hence, it creates a large amount of rework and is inefficient from a labor standpoint. Historically, chasing has occurred repeatedly and has significantly impacted FC's productivity. In fact, initial project objective was to reduce chasing defects from crisplant. However, as preliminary analyses were completed, the project evolved from only looking at chasing to reducing all the major defects in crisplant that hindered productivity.
The crisplant defects represent unique challenges both in organization management and technical aspects because of their magnitude and their potential to significantly impact the customer experience. My role in this project is more of an individual actor. I own the
responsibility to quantify and reduce the major defects in RNO 1 crisplant. However, since the defects are spread out into several groups, it requires close interaction and collaboration with
multiple functional areas from associates to area managers to senior operations mangers, which presents unique management challenges.
5.2 Project Approach
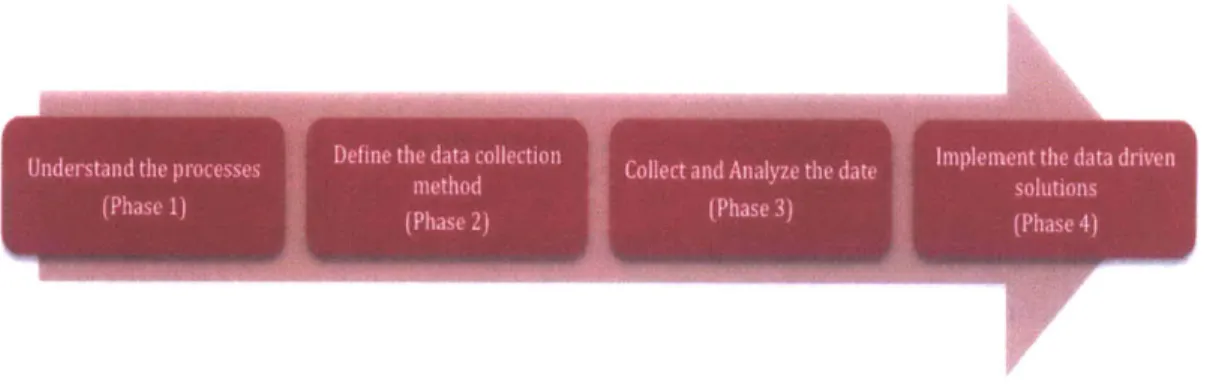
The research project had aggressive goals and extensive scope. However, the following four-phase approach proved to be critical in achieving desired project objectives.
Phase 1: Understand the Crisplant Process Flow Phase 2: Develop the Data Collection Method
Phase 3: Collect and Analyze Data
Phase 4: Implement Data Driven Action Plan.
Figure 12: Project Phases
Phase 1: Understand the Crisplant Process Flow
Crisplant, with a complex process flow, manages about 80% of the total RNOl outbound
volume and plays central role in RNOl outbound operation. Hence, the fundamental understanding of crisplant operation is absolutely critical and the apparent first step for the success of this research project. The phase 1 of the research work was essentially based on "What did you see? What did you hear?" philosophy taught by Professor Steven Spear during Lean/Six-Sigma LGO summer class.
Figure 13: View of Crisplant Functions
Significant hours were spent on the floor with associates just to "see and hear" the crisplant processes (Inducting, Sorting, Chuting & SLAMing). In fact, I recorded lots of videos of
associates performing all the processes in the crisplant. Furthermore, I went through the
necessary trainings and learned to do all aforementioned functions in crisplant. Frequently, after analyzing the recorded videos, I would perform the same processes myself to thoroughly
understand major defects associated with the processes and root causes of these defects.
Phase 2 and 3: Data, Data,'& Data....
In the era of information technology, Amazon now stores more information about its operation than ever before. However, the key is to exploit this data/information storage in a
meaningful manner. In fact, in mpeting on Analytics: The New Science of Wining, Thomas H.
Davenport and Jeanne G. Harris suggest that efficient and effective execution, smart decision-making and the ability to wring every last drop of value from a business process can be gained
through sophisticated use of analytics30. This was essentially the premise of phase two and phase three.
In the past, the lack of an efficient way of collecting and quantifying RNO 1 crisplant defects has been one of the key obstacles in solving these defects. Hence, the second and third phases were largely around data collection and analysis. During these phases, I developed numerous scripts that automatically collected the defects on daily. weekly or monthly basis. These defects were further analyzed through a second set of scripts and VBA macros. As a result of phase two and phase three work, RNO 1. for the first time, was able to identify and quantify all the major defects in its crisplant. The visual metrics prioritized the crisplant defects and set the foundation for phase four work -root cause detection and resolution. Furthermore, inline with Dr. W. Edwards Deming's fourteen key principles of management' and his philosophy of "In God we trust; all other must bring data". these dataset also served as a strong communication tool when convincing upper management on proposed solutions.
Phase 4: Data Driven Solutions!!
The last phase of this research work was essentially implementing the data driven solutions. During this phase both Kaizen and Lean Six-Sigma approaches were used to identify and implement potential solutions. For example, product jam was one of the major defects in
crisplant. The solution was identified as a part of Kaizen work and a pilot approach based on Lean practices was taken when implementing the solution.
"(Davenport & Harris, 2007) 3 (Deming, 2000)
5.3 Project through Three Lens view
Strategic Lens:
The project has a direct impact on two most important factors that influence FC's
performance metric: productivity and customer experience. The high level of corporate strategic goals mainly drives the operations targets for individual FCs. Once Seattle sets the yearly targets, the management at each FC determines their own strategy to achieve these targets. In addition to meeting these targets, performance of each FC is compared against that of other similar type
FCs. Therefore in case of RNOL. strategy is not only to meet or exceed corporate targets but also to ensure that RNOl is adopting best practices by benchmarking performance with SDF1 and
TUL1 (the only two FC's that are similar to RNO 1).
After a few weeks into the internship it was apparent that the project had a direct impact on the FC's bottom line and was aligned with RNO l's overall strategy, which is to reduce the variable/flexible cost per unit shipped. Since defects in crisplant inefficiently consume lots of labor hours, reducing these defects will promptly increase the productivity, which in turn will reduce the cost per unit shipped. Furthermore, associates exceptionally handle these defects, which disrupts their normal workflow. Therefore, everyone, especially senior management, has a high stake in the success of this project.
Although the project has potential to impact the bottom line, it does represent set of unique challenges, which turns out to be one of the major motivations of the project. Since crisplant defects occur for multiple reasons and in several parts of the process flow, there is no
central function group that is responsible for the defects handling. For example, one of the defects known as chasing is performed by a group of individuals who are called problem solvers. Various departments have their own group of problem solvers to manage the chasing that occurs in their groups. At a micro level, the project is expected to reduce the amount of chasing by resolving defects in the processes. However, it is very well possible that chasing may not be
eliminated all together; in which case. the project is expected to identify possible changes both in process itself and the way problem solvers are organized.
As for implementing findings and recommendation. FC's organization is set up such that it does not pose major challenges. Most of the expected changes were around altering the hardware and modifying the way defects are handled. FC has a facility group that basically manages all the changes in the FC's hardware. However, the challenge throughout the project was to ensure that the recommendations were assigned appropriate priority and were
implemented in a timely manner. To remedy this, several strategies were used including adding more resources and leveraging senior management. However, the proposed software changes faced setbacks and could not get implemented in a timely manner, because the software team is based out of Seattle and senior management at the FC doesn't have direct influence over the software team.
Cultural Lens:
Culture observation and experience was the interesting part of the research project. Just like any other big company, Amazon has multiple cultures - culture that breeds from Amazon values and principles (i.e. safety, customer first, hardworking), culture that breeds within various departments (i.e. picking, shipping. packing). However, what is unique is the fact that the project took place at a fulfillment site. an environment with a blue-collar workforce. Consequently, there is management vs. associate culture. What is worth noting is the culture within the associates. FC is one of the very few places where its workforce almost triples (with temporary workers) during holiday seasons and some of these temporary workers convert into pennanent associates. Hence there is a culture of permanent vs. temporary associates. There is a constant drive for meeting the productivity goals.
As for my project, some of the defects (i.e. chasing) are widely known and occurred throughout the RNOl fulfillment center. However, there are slight variations from an individual to individual on the meaning of these defects (i.e. chasing). Most of the associates consider chasing when problem solvers manually pick and pack the order. Senior management sees anything that problem solvers do as chasing - anything that deviates from normal process. The
project, however, has a common symbolic meaning, that is widely accepted by pretty much everyone at RNO1, which is to reduce the cost of handling defects in crisplant.
The project has great significance from the culture standpoint because most of the associates perceive and have accepted some of defects (especially chasing) as their normal job function. This perception mainly breeds from the culture on the FC's work floor. There are designated areas for problem solving and at the beginning of every shift associates are assigned to these areas whose job function is to investigate the delayed orders and chase them if
necessary. Because missing a customer order is not acceptable, this kind of organization culture is necessary on the work floor. However, over time chasing and other defect handling has
become an integral part of the daily activities and as a result problem solvers may end up chasing the orders that actually may not be necessary. So the management challenge of the project is to change some of these behavior and/or perception within the culture of the problem solving.
Every job function has pre-defmed productivity expectations in terms of RE (reasonable expectation) that associates are expected to meet. Since the project has direct impact on the productivity, there is a great opportunity to leverage the RE culture to gain acceptance of new or modified processes, which will enable associates to increase their productivity through better,
faster and easier job processes.
Political Lens:
Because of the strong presence of Amazon's productivity driven culture at RNO 1 FC, everyone is on board when it comes to improving the productivity and customer experience, hence, there are minimal, if any, political conflicts. Although Amazon has grown significantly in recent years, it is still a young company and one of the few big companies that is less
bureaucratic. I have personally experienced this first hand during my work at RNO 1. Even as an intern, I had all the freedom and flexibility to not only come up with new ideas but implement them if they would improve the existing process.
The project has various stakeholders, from general manager to senior operation managers to associates, however despite the diversity of the stakeholders their interests are very much aligned with that of the projects. Because of the diversity of the stakeholders, they all bring different power, which has been beneficial to the project so far. Since the objective of the project was to reduce the cost of handling the defects, it did not change stakeholders' power and
positions. As mentioned before, I was not leading a team for my project; instead my role was more of an individual actor who worked with people from various departments as necessary. This allowed individuals, especially associates, to share their thoughts and options without any pressure or influence.
Chapter 6. Project Results & Conclusion:
6.1 Summary:
As mentioned before, objectives of the project were to identify the root causes of major defects in RNO1 crisplant, quantify the cost of handling these defects and suggest/implement improvements to the current processes to reduce these defects.
In crisplant, the majority of defects are seen in induct, pack (chuting) and problem solve processes, costing RNO1 approximately $10.38 M annually in labor hours (see 6.2 for cost components and calculation). These defects are detailed in the following chart (see Appendix A
for % of defects chart).
Pa0r-PICAS Chute Uam P..t-tback% pack-sth3r:f Sas Hot-ptcks I"~uCT
iverages -INI1iAL WCU~tHLft FUI-URL
K
-- ,R-
k
-Iduct sho~tl No-Maps Miisdng5 000
Figure 14: Initial, Current and Future State of Defects
At the end of the project, cost of these defects were reduced by 12% and have identified solutions to reduce the future cost by another 38%, reducing the total cost3 2 of handling defects
by about 50%, from $10.38 M to $5.22 M, at RNO1 (See Appendix F for details of cost
reduction).
3 2
6.2 Crisplant Defects Identification and Quantification:
As mentioned before, RNO1 was seeking to identify and quantify the major defects in its crisplant. As a result of phase one study, major crisplant defects were identified as shown in following table. Furthermore, using newly developed metrics, project phases two and three quantified these defects both in terms of frequency and handling cost (see Table 1).
Crisplant Defects (one week average) INITIAL
% Defects Defects (a) Paper-picks 0.21% Chute Jam 5.73% Put-backs 0.41% Pack-shorts 3.23% Strays 0.62% Hot-picks 0.89% Induct Overages 0.29% Induct-shorts 0.45% NoMaps 0.22% Missing Spoo 0.31% Total Hours
Total Defect Handling Cost/Week
Total Defect handling Cost/Year
Avg Weekly Units Processed (b) 2070440 2070440 2070440 2070440 1571148 2070440 1571148 2070440 1571148 2070440 Defected Units (c) = (a)*(b) 4286 118736 8393 66893 9726 18436 4589 9317 3441 6392 Rate (UPH) (d) 1.88 61.25 5.84 122.62 19.32 46.26 19.32 46.26 19.32 46.86 Hours (e) = (c)/(d) 2284.46 1938.44 1437.91 545.52 503.52 398.54 237.56 201.41 178.12 136.41 7861.90 $170,603.20 $10,379,498.61 Table 1: Cost Components and Calculation
Function Hot-picks/induct-shorts (re-picks) Missing SPOO PaperPick Strays/NoMaps/Induct Overages PackShort Chute Jam Put-back
Table 2: Defects Processing Rate (UPH - Units per Hour) Calculation Source Feb 1-7 FCLM Table 3 Table 4 Table 5 Table 6 Table 7 Table 8 Rate (Actual) 46.26 46.86 1.88 19.32 122.62 61.25 5.84
A total of ten defects were identified as major crisplant defects: Paper-picks, Chute Jam,
Put-backs, Pack-shorts, Strays, Hot-picks, Induct Overages. Induct-shorts, NoMaps. Missing
SPOO. In addition, processing rates for each of the defects were calculated in order to quantify
total handling cost (see Table 2).
Table 3: Missing SPOO Processing Rate
Table 6: Pack-short Processing Rate
Missing SPOO Time (seconds)
Move Box to Problem Solver 45.92
Investigate Order 76.53
Get a SPOO 6.12
Rescan & Pack an order 71.20
Total Seconds/order 199.76
UPH 46.86
Packshort Pack Short Units
Pack Short UPH
Hours Spent Detecting Pack Short Pack Shorts Resolved by PS
PS UPH 66893.40724 260.1888737 257.10 1726.43 6.35
Table 4: Paper Picking Rate & Cost
Paper Picking
Paper Pick Rate (UPH) 26.23
CycleCount Rate (bin/hr) 64.86
Total Hours 928.43
Total Units 1742
Overall UPH 1.88
Cost/Unit $11.57
Table 5: Strays/NoMaps/Induct Overages Processing Rate
Problem Solving Exceptions Handling
Hours 495.8893828
Total Exceptions Units 3150.230786
UPH 6.35 Strays/NoMaps/Induct Overages Induct UPH 2907.99 Induct Hours 6.11 PS UPH 19.45 PS Hours 913.10 Total Hours 919.20 Overall UPH 19.32 Hours Spent by PS 271.76
Pack Shorts Resolved by Hot-pick 6284.33
Hot-pick UPH 433.44
Induct UPH 2907.99
Hours Spent Hot-picking/Inducting 16.66
Overall UPH 122.62
Table 7: Chute Jam Handling Rate
Chute Jam
% of units created jam 9.43%
Handling Time (sec/jam) 58.772075
UPH 61.25
Table 8: Put-back Processing Rate
Putback Stow UPH 71.90 PS Putback Rate 6.35 Total Units 18436.07 Total Hours 3158.49 Overall UPH 5.84
6.3 Root Cause Analysis and Defects Reduction:
Paper-picks (Current cost $3M annually): The existing paper picking process is completely
manual; hence, it is very inefficient and has the potential to cause IRDR (Inventory Record Defect Rate) errors. During the time of paper picking, a designated picker is given a paper slip with ASIN (Amazon Standard Item Number) and its bin location. Associate takes this paper slip and walks to a designated bin in a pick-mod and brings the item back to the problem solver in the crisplant. So in effect, the problem solver first virtually deletes an item from a bin and then a few minutes later a paper picker physically removes the item and walks it back to the crisplant. Because these two events are happening independent of each other, every paper pick generates a Cycle Count to verify that the right item was picked from the right bin and that the bin is free of inventory errors. On average, each paper pick item takes about a total of XX minutes to pick and validate the inventory, costing RNOl about $11.57 per unit (see Table 4 for unit cost
calculation).
Cost of Paper Picking - BEFORE SPS
Paper Pick Units 1742
Paper Pick Rate (UPH) 26.23
Paper Pick Hours 66.41
Cycle Counts 1742
Cycle Count Rate
(bin/hr) 15.75
Cycle Count Hours 110
Total Hours 177
Overall UPH Cost/Unit
1.88 S11.57
Cost of Paper Picking - AFTER SPS
Paper Pick Units 1742
Paper Pick Rate (UPH) 11.28
Paper Pick Hours 154.4
Cycle Counts 0
Cycle Count Rate (bin/hr) 10.7
Cycle Count Hours 0
Total Hours 154.4
Overall UPH 11.28
Cost/Unit $1.92
Table 9: SPS Tool and Associated Savings
ACTION (Cost reduction $2.6M annually): In absence of an automated tool, problem solvers have to rely on the manual process to meet the expected shipment date. However, with the implementation of the Sort Problem Solve tool (modified for use with crisplant), paper-picking could be automated (like the standard picking process) significantly reducing the need to do cycle counts and reducing the cost of paper picking from $11.57 per unit to $1.92 per unit (see Table 9). Furthermore, through the option to manually generate and cancel hot-picks, this tool
will also eliminate the units that are both automatically hot-picked and manually paper picked (resulting in put-backs).
4, Exarase itez
', val.idate entves
9Procs: ramg
-, srder Ac-zoc Ccas~L
-Mr , rrzc rz cr2a.--, acet;
V.~~~r a~~~n -r:z
Figure 15: Snapshot of SPS Tool
Chute Jam" (Current cost $2.6M annually): Based on a packing time study (see Figure 16), chute jam handling was the top non-value added activity. It would take about XX seconds to clear a chute jam: an associate has to walk to the reach pole location (usually every N chutes), grab a reach pole, clear a jam, reinstate the reach pole and walk back to the chute.
Clear Jam/ Use Clean Items Pole
White Tote Change Zone wrong/missing item
Figure 16: Packing Time Study
For this project, chute jam is defined as when an item is blocking the photo eye on the chute and an associate has to use a reach pole to clear the photo eye by moving the item to the front of the chute.
ACTION (Cost reduction $1.5M annually): To reduce the time needed to clear chute jams, the
Shingi Kaizen team came up with a chute rake (a reach pole built in to every chute) prototype to clear chute jams (see Figure 17 for chute rake details). Based on testing and associates' feedback, rake prototype was improved to make it easier to use, manufacture, and install. The rake will reduce waste in the packing cycle time by eliminating the need for associates to find a reach pole, clear items stuck at the top of the chute, and replace the reach pole to the proper 5S location. This waste elimination will reduce the chute jam handling time to approximately XX seconds per jam, saving total of about N hours/week.
As a ctt I
tIe DVtD ends
up at the front
of the chute
Figure 17: Chute Rake Operation
Put-backs & Hot-picks (Current cost $2.4M annually): Since hot-picks make up the majority
of put-backs, reducing hot-picks will consequently reduce put-backs. A hot-pick is generated when an item is marked as damaged, or the item is marked as missing (pack-short, induct-short)
and the found item is not re-inducted in a given amount of time (late re-induct). About 90% of hot-picks are a result of induct shorts and pack shorts. These are missing items that are not found and re-inducted in time, i.e. late re-induct. Late re-inducts are due to the problem solving vicious cycle (see Figure 18).
L ite
+ idc
Likelihood of + missing ExSD
ling Cust. Exp +
lers Chasing
Re-induct
Reinduct
-Deay unitsPaper
Reinduct +Remducts' ae
Reinduct Handling Hours picks
interval -
D9
Paperpick
Rework
Hotputbck
+ Putbacks +
Figure 18: Problem Solving Vicious Cycle
The above diagram preciously explains how problem solvers unconsciously generate put-backs and hot-picks. Here the '+' sign indicates that two variables are positively correlated, which means an increase in one variable causes an increase in the other variable and vice-versa. For example, as dwelling orders increases the likelihood of missing ExSD (expected shipment
date) increases. Similarly as dwelling orders decrease the likelihood of missing ExSD also decreases. Furthennore, the '-' sign indicates that two variables are negatively correlated, which
means an increase in one variable causes decrease in the other variable and vice-versa. For example, as chasing increases dwelling orders decrease because as problem solvers do more chasing they investigate and pack out dwelling orders.
The analysis highlights the intangible and hence often overlooked reinforcing loops: re-induct delay, paper-pick rework, and hot-pick rework. These three reinforcing loops amplify the problem solving by generating even more work through hot-picks/paper-picks and then put-back.
ACTION (Cost reduction $0.57M annually): To reduce the hot-picks that are generated from
late re-inducts, the hot-pick generation timer was increased, allowing more time to process the re-inducts and also problem solvers were educated on the benefits of re-inducting as often as possible. Based on the preliminary data analysis, these changes reduced the hot-picks and
put-backs as shown in Figure 19. In addition, as noted above, use of the sort problem solve tool (SPS)
will further decrease unnecessary hot-picks that generate put-backs.
Hotpicks Putbacks
Figure 19: Hot-picks and Put-back Reduction
Pack-shorts (Current cost $0.70M annually and Cost reduction $0.23M annually): A pack-short occurs when an expected item is missing from the packable chute. The major reasons for pack-shorts are switcheroos at induct, items that fall under the sorter, and items that fail to successfully divert to a chute.