Detecting Cognitive Impairment from Spoken
Language
by
JUN 13 2019
Tuka Alhanai
LIBRARIES
ARCHIVES
B.S., The Petroleum Institute (2011)
S.M., Massachusetts Institute of Technology (2014)
Submitted to the Department of Electrical Engineering and Computer
Science
in partial fulfillment of the requirements for the degree of
Doctor of Philosophy in Electrical Engineering and Computer Science
at the
MASSACHUSETTS INSTITUTE OF TECHNOLOGY
June 2019
@
Massachusetts Institute of Technology 2019. All rights reserved.
Signature redacted
A u th o r ...
Department of Electrical Engineering and Computer Science
Signature redacted
May
22, 2019
C ertified by ...
...
James R. Glass
Senior Research Scientist
Thesis Supervisor
Accepted by ...
Signature
redacted
'
/CU
Leslie A. Kolodziejski
Professor of Electrical Engineering and Computer Science
Chair, Department Committee on Graduate Students
Detecting Cognitive Impairment from Spoken Language
by
Tuka Alhanai
Submitted to the Department of Electrical Engineering and Computer Science on May 22, 2019, in partial fulfillment of the
requirements for the degree of
Doctor of Philosophy in Electrical Engineering and Computer Science
Abstract
Dementia comes second only to spinal cord injuries in terms of its debilitating effects; from memory-loss to physical disability. The standard approach to evaluate cognitive conditions are neuropsychological exams, which are conducted via in-person inter-views to measure memory, thinking, language, and motor skills. Work is on-going to determine biomarkers of cognitive impairment, yet one modality that has been rela-tively less explored is speech. Speech has the advantage of being easy to record, and contains the majority of information transmitted during neuropsychological exams.
To determine the viability of speech-based biomarkers, we utilize data from the Framingham Heart Study, that contains hour-long audio recordings of neuropsycho-logical exams for over 5,000 individuals. The data is representative of a population and the real-world prevalence of cognitive conditions (3-4%).
We first explore modeling cognitive impairment from a relatively small set of 92 subjects with complete information on audio, transcripts, and speaker turns. We loosen these constraints by modeling with only a fraction of audio (~2-3 minutes), of which the speaker segments are defined through text-based diarization. We next apply this diarization method to extract audio features from all 7,000+ recordings (most of which have no transcripts), to model cognitive impairment (AUC 0.83, spec. 78%, sens. 79%). Finally, we eliminate the need for feature-engineering by training a neural network to learn higher-order representations from filterbank features (AUC 0.85, spec. 81%, sens. 82%). Our speech models exhibit strong performance and are comparable to the baseline demographic model (AUC 0.85, spec. 93%, sens. 65%).
Further analysis shows that our neural network model automatically learns to detect specific speech activity which clusters according to: pause followed by onset of speech, short burst of speech, speech activity in high-frequency spectral energy bands, and silence.
Thesis Supervisor: James R. Glass Title: Senior Research Scientist
Acknowledgments
I am very grateful for the mentorship and guidance I have received from my advisor Dr. James Glass. He allowed me to learn, grow, and pursue my interests. It was his sharp eye that recognized that this project could be interesting, and that there could be a lot of potential to this domain. I am also very grateful to Professor Rhoda Au who helped make this research happen through her open-mindedness and willingness to share data, resources, and experiences.
At The Framingham Heart Study I would like to thank the young and youthful team that helped process the largest dataset we ever had to deal with; Ida Xu, Brynna Wasserman, Maulika Kohli, Nancy Heard-Costa, Yulin Liu, Karen Mutalik, Mia Lavallee, Cody Karjadi, Alvin Ang, and Spencer Hardy.
I am also very grateful for the constructive feedback provided by my thesis com-mittee members Professors Collin Stultz and Roger Mark, as well as Professor Victor Zue, Dr. Stephanie Senneff, Marcia Davidson, and my colleagues past and present at the Spoken Language Systems Group. I also appreciate the mentorship I received over the years from my academic advisor Professor Munther Dahleh.
The work in this thesis not only exists because of essential contributions made by individuals, but also by the momentum of non-profit organizations, and those individuals within who help make meaningful things happen, but are too often not there to experience first-hand the impact of their decisions. I am very grateful to the National Institute of Health and the Framingham Heart Study for allowing this research to exist through their 70+ year operation. I am also very grateful for the foresight the Abu Dhabi Department of Education and Knowledge in sponsoring myself and fellow students. I would like to acknowledge their talented team over the years; Fatema Alhosani, Reem Aijabri, Sultana Alketbi, Maha Basuwaid, and Mona Almansoori.
I would also like to acknowledge Dr. Nadia Alhasani for her guidance and belief in a young lady. I thank Dr. Raed Shubair for his energy and counsel.
Bibliographic Note
Portions of this thesis have appeared in peer-reviewed publications, which are:
" T. Alhanai, R. Au, and J. Glass. "Spoken Language Biomarkers for Detecting
Cognitive Impairment", IEEE ASRU 2017, Okinawa JAPAN.
" T. Alhanai, R. Au, and J. Glass. "Role-specific Language Models for Processing
Neuropsychological Exams", NAACL HLT 2018, New Orleans USA.
Contents
1 Setting the Scene
1.1 C ontributions . . . . 1.2 Thesis Overview. . . . . 2 Background
2.1 Cognitive Impairment and Dementia . . . .
2.1.1 The Value of Detecting Cognitive Conditions 2.2 Biom arkers . . . .
2.2.1 Laboratory Tests to Brain Imaging Scans . . . 2.2.2 Spoken Language . . . . 2.3 The Framingham Heart Study . . . .
2.3.1 Audio Recordings . . . .
2.3.2 Neuropyschological Examinations . . . .
2.4 Challenges of Medical Speech Data . . . . 2.4.1 Protecting Privacy . . . . 2.4.2 High Quality Data Labels . . . ... 2.4.3 Real-world Constraints Define the Research Ti 2.5 C orpus . . . .
2.5.1 Gold Dataset: Fully Annotated . . . .
2.5.2 Silver Dataset: No Transcripts . . . .
rajectory .
2.5.3 Bronze Dataset: All Subjects and No Transcripts
2.5.4 Largest Medical Speech Analysis to Date . . . . .
2.6 Evaluating Model Performance . . . .
25 27 28 29 . . . . 30 . . . . 32 . . . . 34 . . . . 34 . . . . 35 . . . . 38 . . . . 38 . . . . 38 . . . . 40 . . . . 41 . . . . 41 41 . . . . 42 . . . . 43 . . . . 43 . . . . . 44 . . . . . 44 . . . . . 44
2.6.1 Sensitivity and Specificity . . . . 44
2.6.2 Receiver Operating Characteristic Curve . . . . 46
2.6.3 Model Calibration . . . . 48
2.7 Tools of the Trade . . . . 50
3 A Motivating Study 51 3.1 Background ... ... .... ... . . ... 52 3.2 Hypothesis. . . . . 52 3.3 Objectives . . . .. . . . . 52 3.4 M ethod . . . . 53 3.4.1 D ata . . . . 53 3.4.2 Features . . . .. . . . . 53
3.4.3 Model Choice and Evaluation Metrics . . . . 56
3.5 R esults . . . . 59
3.5.1 Demographic Model Coefficients . . . . 59
3.5.2 Speech and Language Features . . . . 61
3.5.3 Selected Features . . . . 63
3.6 Discussion . . . . 64
3.7 Conclusion . . . . 65
4 Role Specific Language Modeling for Diarization 67 4.1 Background . . . . 68
4.1.1 An Automatic Speech Recognition (ASR) System . . . . 69
4.2 Hypothesis . . . . 73
4.3 Objectives . . . . 73
4.4 M ethod . . . . 73
4.4.1 D ata . . . . 73
4.4.2 Outcome of Interest . . . . 74
4.4.3 Model Choice and Evaluation Metrics . . . . 74
4.4.4 Experimental Pipeline . . . . 75
. . . . 75 4.5.2 Results . . . . 4.5.3 Discussion . . . . . 4.6 Experiment 2: Speaker ID 4.6.1 Acoustic Model 4.6.2 Language Model 4.6.3 Lexicon . . . . 4.6.4 Decoding Audio . . 4.6.5 Results . . . . 4.6.6 Discussion . . . . . fro . . . . . . . . m ASR . . . .. . . . . . . . . . . . . . . . . . . . . . . . . . . . . 4.7 Experiment 3: Cognitive ID
4.7.1 Transcript-based Speaker Turn Segmentations . . .
4.7.2 Discarding Transcript-based Speaker Segmentations
4.7.3 Discussion . . . . 4.8 Conclusion . . . . 5 Population-level Modeling
5.1 Background . . . .
5.1.1 Small and Skewed Samples . . . .
5.1.2 Content-dependent features . . . . 5.1.3 Context-dependent Modeling . . . . 5.2 H ypothesis . . . . 5.3 O bjectives . . . . 5.4 Methods . .... . . .. .. . .. . . . .. . . . .. 5.4.1 D ata . . . . 5.4.2 Spoken Language Features . . . . 5.4.3 Confounders . . . . 5.4.4 M odel . . . . 5.5 R esults. . . . . 5.6 D iscussion . . . . 76 77 77 77 77 78 78 79 80 80 80 81 83 84 85 86 86 86 87 87 87 88 88 88 90 91 92 92 4.5.1 Language Model
5.6.1 Including Demographics Improves Model Performance
5.6.2 Interpreting Audio Features . . . .. .
5.6.3 Inferring Speaking Rate . . . .
5.6.4 Differences in Speech Activity and Articulation . . .
5.6.5 'Verbal fluency' Test Most Predictive of Outcome . .
5.7 Conclusion . . . .
6 Representation Learning with Neural Networks 6.1 Background . . . .
6.1.1 Neural Network-based Modeling . . . . .
6.1.2 Inference of Neural Networks . . . .
6.2 Hypothesis . . . . 6.3 Objectives . . . . 6.4 M ethods . . . . 6.4.1 D ata . . . .
6.4.2 Data Processing and Feature Extraction
6.4.3 Performance Metrics . . . . 6.4.4 M odel . . . . 6.5 R esults . . . . 6.6 D iscussion . . . .
6.6.1 Speech and Demographics . . . .
6.6.2 Model Calibration . . . .
6.6.3 Utterance-level Representations . . . . .
6.6.4 Frame-level Representations . . . .
6.6.5 Peaks and Dips . . . .
6.6.6 Spectrogram Clusters in t-SNE Space . .
101 . . . . 102 . . . . 102 . . . . 102 . . . . 104 . . . . 104 . . . . 104 . . . . 104 . . . . 104 . . . . 105 . . . . 105 . . . . 114 . . . . 114 . . . . 114 . . . . 116 . . . . 117 . . . . 118 . . . . 119 . . . . 121
6.6.7 Frame-level Speech Clustering via Euclidean Distance
6.6.8 Neural Network Hyperparameters . . . .
6.7 C onclusion . . . . 93 94 96 96 97 99 123 127 129
7 Conclusions
7.1 Summary of Findings... . . . ..
7.1.1 Reducing Data Labeling Constraints . . . 7.1.2 Findings Beyond Performance . . . .
7.2 Cost Analysis of Model Performance . . . . 7.3 Future W ork . . . . 7.3.1 Personalized Modeling . . . .
7.3.2 Modeling over Time . . . . 7.3.3 Modeling Across Cultures and Languages . 7.3.4 Incorporating Physician Intuition . . . . . 7.3.5 Modeling Context . . . ..
7.3.6 Multi-modal Modeling . . . .
7.3.7 Generating Synthetic Data . . . . 7.4 Reserved Optimism . . . . 131 . . . . . 132 . 132 132 133 135 135 . . . . 135 . . . . 136 . . . . 137 . . . . 137 . . . . 138 . . . . 139 . . . . 140
List of Figures
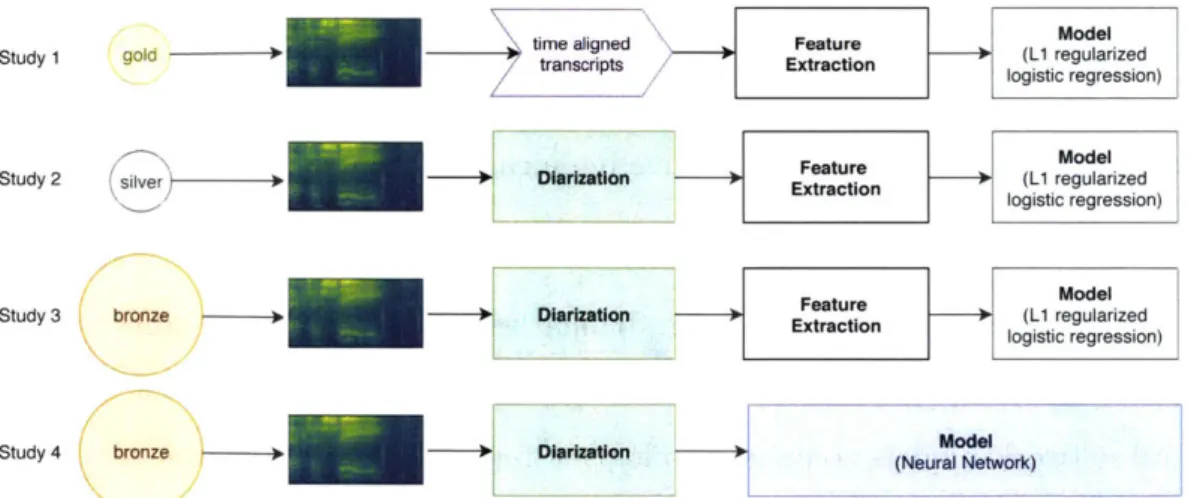
1-1 Overview of studies presented in this thesis. Gold, silver, and
bronze refer to datesets with different levels of annotation quality. . . 28
2-1 Pathological load and cognitive function as a function of time
[Nestor
et al., 2004]. (MCI = mild cognitive impairment) . . . . 32 2-2 Confusion Matrix. The visualization displays the four quadrants ina binary classification task. Classification label '1' indicates cognitive impairment, while '0' indicates healthy. The y-axis corresponds to the actual class labels, while the x-axis corresponds to the predicted class labels. Each quadrant contains information on true negative, false positive, true positive, and false negative. . . . . 45
2-3 Plotting ROC. A-F are operating points for each classification
thresh-old in Table 2.2. AUC (shaded in blue) is 0.83. ROC of random pre-dictions is dotted diagonal line with an AUC of 0.5. . . . . 47 2-4 Calibration. Plot on the left displays predicted probabilities that
tightly follow a linear trend, indicative of a model with good calibra-tion. The plot on the right shows two clustering of probabilities which may result in strong classification performance, but is a model with poor calibration because the points do not evenly fit a linear trend. . 48
3-1 Overview of first study. The study utilizes gold subjects (gold)
with time aligned transcripts (time aligned transcripts) to extract sub-jects' audio and text features (Feature Extraction) and model cognitive
3-2 Modeling Technique and Feature Selection. (1) An initial set of features are selected if they had a statistically significant (p < 0.01)
uni-variate Pearson correlation with the (training set, i.e. N - 1 subjects) out-come. (2) An Elastic-net regularized binomial logistic regression is trained with these features, resulting in further feature selection. Features with non-zero model coefficients (3) are selected. (3) This model is the evaluated on the held out test subject. (4) This training method is repeated for all
leave-one-out (N ) folds. . . . . 57
4-1 Overview of second study. This study utilizes silver subjects
(sil-ver) to automatically diarize audio (Diarization), then extract acous-tic features of subjects' speech (Feature Extraction) to model cognitive impairment (M odel). . . . . 67
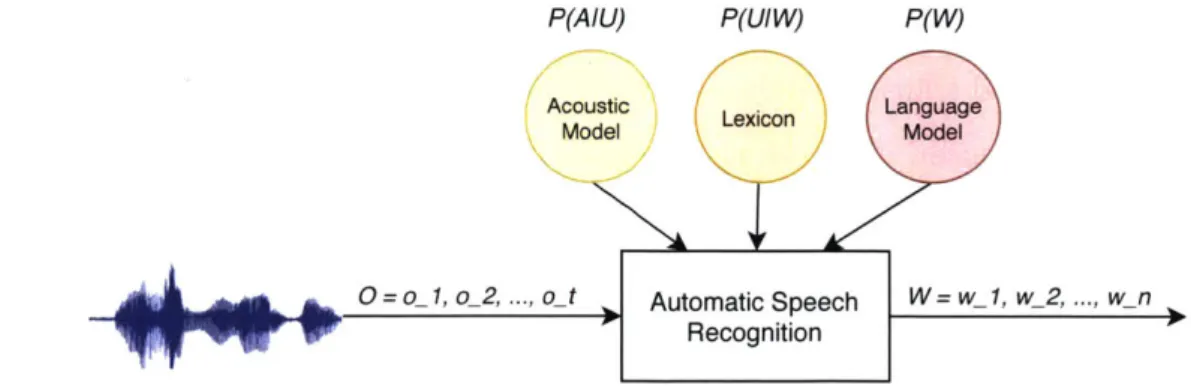
4-2 Automatic speech recognition system. An ASR system takes as
input a sequence of observations and outputs a sequence of words. An ASR system is composed of three components: an acoustic model,
lexicon, and language model. . . . . 70
4-3 Experimental Pipeline. We perform three sets of experiments: (1) determining speaker role from the text transcripts, (2a) diarizing audio with an ASR system that utilizes a role-specific language model (with oracle segmentation of audio), (2b) diarization with automatic
segmen-tation of audio , and (3) determining cognitive impairment based on
the subject's segments of the diarized audio. . . . . 76
4-4 Example Role-based FST. Top path marks the tester's _t language
path. Bottom path marks the subject's _s language path. Language patterns for each speaker role can be represented within a single search
4-5 Heatmap for Modeling Cognitive Impairment for Different Segment Length and Speaker Purity. Heatmap of AUC for cog-nitive impairment model across two thresholds: (y-axis) segment length
(i.e. number of words decoded), and (x-axis) segment purity (i.e. per-centage of words in a segment classified as the subject's). . . . . 81
4-6 Cognitive ID by Number of Segments. Plot of AUC (y-axis) with respect to the number of segments per-subject (by descending order of length) used for modeling their cognitive impairment (x-axis). Red points indicate best performance (AUC 0.72 and 0.75 for oracle and automatic segmentation systems respectively). . . . . 83
5-1 Overview of third study. This study utilizes the bronze dataset
(bronze) automatically diarized to extract subjects' speech segments (Diarization), followed by acoustic feature extraction (Feature Extrac-tion) for modeling cognitive impairment (Model). . . . . 85
5-2 Method. The figure illustrates the three steps required for model-ing cognitive impairment. (a) We first perform diarization to extract segments belonging to the subject. (b) Next we generate higher-order acoustic features to represent the subject's speech patterns. (c) We model cognitive impairment (coded as 1) with leave-one-subject-out cross-validation. . . . . 89
5-3 Class Separation: The figure displays a 2D and 3D plot of subject predictor values colored according to the outcome (blue is healthy, red is impaired). (Left - 2D plot) The features on the x-axis and y-axis are the maximum voicing probability and skew of the 26th filterbank, respectively. (Right - 3D plot) The features on the three axes are the maximum voicing probability, skew of the 26th filterbank, and maxi-mum pitch (FO). The 2D plot displays some separation between the two classes, while the 3D displays more pronounced separation between the two classes. This motivates the use of speaker representations of higher-dimensions to maximize separability. . . . . 90 5-4 Signal Statistics. The plots shows raw filterbank signals (column 1)
and their distributions (columns 2-3). Each row highlights signals with differing means, standard deviations, skewness, and kurtosis. (Column 1) blue corresponds to the signal with the higher value statistics, and the orange with the lower value. (Column 2) displays the distribution of the signals in column 1. (Column 3) displays the distributions nor-malized with respect to all statistics except the one under focus (i.e. first row: p={0.2, 1.0}, p=1. second row: p=0, p={0.9, 3.4}. third row: =0, p=l, 'i={-0.9. 2.5}. fourth row: p=0, P=1, _Y=0, Y2={1. 7,
13 } ). . . . . 9 5
5-5 Distribution Over Time of Features and Speech Activity. (Top) Plot displays the distribution of frame-level features most closely match-ing segment-level feature representation. (Bottom) Plot displays the distribution of speech activity over time. Colors according to subject class outcomes, healthy (blue) and cognitive impairment (red). . . . . 97 5-6 Most Predictive Tests. The figure displays the relative predictive
power (%) of a test with respect to its prevalence in the data. At least 20% of the subjects were modeled with the represented tests. Descriptions of the tests are available in Table 5.3. . . . . 98
6-1 Overview of fourth study. The study in this chapter utilizes the bronze dataset (bronze) which is automatically diarized to extract sub-jects' segments (Diarization). Spectral energy features are extracted
and then used to train a neural network to model cognitive impairment (M odel). . . . . . . . .. 101
6-2 Cumulative Distribution of Data Segment Lengths.
Approxi-mately 50% of the segments are longer than 20 seconds, while approx-imately 90% are longer than 10 seconds. . . . .. 111
6-3 CNN Model. The figure displays the optimum topology found
af-ter hyper-parameaf-ter optimization. The CNN has a batch-normalized input, with 4-layers of convolution, ReLU activations, and global max-pooling of the final output as a 2048 dimensional embedding (collapsed across time) input to the sigmoid classifier. The optimizer is stochastic gradient descent, with learning rate = le-01, momentum = 0.8, and decay = 0. Loss function is binary cross-entropy. The data input is H = 40 (Mel filterbanks), W = 2048 frames (approximately 20 sec-onds), batch size = 160, epochs = 150 and an early stopping criterion of validation loss < le-04 for 5 consecutive epochs. . . . . 113
6-4 Combined CNN and Demographic Model. CNN output prob-ability is an input feature with demographic features into logistic re-gression m odel. . . . . 115
6-5 t-SNE of Utterance-level Embeddings. t-SNE of 2048-dim em-beddings of a random selection of utterances from test set subjects, colored according to ground truth outcomes. Axes are dimensionless. 117
6-6 Probability Profile of Frame-level Embeddings. (Top) Proba-bility profile of feature-map embeddings, (bottom) along with the cor-responding input features (i.e. spectrogram). Increasing probability corresponds to a higher likelihood of cognitive impairment as hypothe-sized by the sigmoid classifier. Each point in the probability profile cor-responds to 1260ms in the spectrogram. The classifier outputs a higher probability of cognitive impairment with increased silence. During this specific test (called trail-making) of the neuropsychological exam the subject is attempting a 'dot-to-dot' like activity to connect consecutive
numbers on a sheet and is speaking out loud during the process. . . . 118
6-7 Distribution of Frame-level Probabilities. The probability values are from before the global max-pooling operation., which are 2048-dim representations at each time-step fed into the sigmoid binary classifier. We can observe some separation between the two classes. . . . 120 6-8 Peak and Dip. A peak and dip are calculated every 2.5 seconds.
Each peak dip captures information that spans 1260ms of the input filterbank feature. . . . 120 6-9 t-SNE of Frame-level Embeddings. t-SNE of 2048-dim frame-level
feature map embeddings colored according to peak (red) or dip (blue) while size is according to probability value. Axes are dimensionless. We can observe that similar probability values cluster together which motivates understanding what the underlying speech patterns may be. 121 6-10 t-SNE Plot of Spectrograms. Plot of spectrograms (1300ms
du-ration) in the t-SNE 2D co-ordinate space of feature map embeddings that elicit peaks when input to the signioid classifier. Clustering of speech activities can be seen in the plot, with some examples of this activity in the form of: speech onset, short burst of activity, spectral energy in high-frequency bands, and gaps of silence between words. . 122
6-11 t-SNE of Speakers, Tests, and Vocabulary. Plots of t-SNE for feature map vectors colored by (a) speaker and (b) neuropsychological test, as well as (c) t-SNE of word2vec word embeddings (colored by peaks and dips). None of the plots exhibit clustering by speaker, test, or words indicating that the features learned by the speech model are independent of speech elicitation source and language usage. . . . . . 124
6-12 k-means SSE elbow plot. We cluster with k ranging from 2 to 50. and focus our analysis for sum of squared error (SSE) less than 1000,
at k= 300. ... ... 125
6-13 Scatter Plot of Cluster Size vs. Variance Plot indicates that
clusters with smaller number of samples have a large range of variances, and vice versa. Bubble size maps to number of samples in cluster, and color maps to intra-cluster variance. We focus our analysis on clusters with the smallest variance to ensure that samples within a cluster are hom ogeneous. . . . . 126
6-14 Representative Spectrograms from k-means Clustering. Spec-trograms from clusters by k-means clustering for k =7300. Each column displays spectrograms from a cluster where the variance (a2) is the
low-est, and where the number of samples in a cluster (N) is greater than 10. Spectrograms displayed are the closest distance to the cluster cen-troid and are speaker independent. Predictive of healthy: The two left columns are mostly from dips (i.e. P is small) and display a rich amount of speech activity. Predictive of impairment: The next two columns (from mostly peaks) are noisy and contain short bursts of speech. The last column (also mostly peaks) displays relatively more speech activity in high-frequency energy bands, with a gap for silence. 127
6-15 Statistics of CNN Hyperparameters. Boxplots capture distribu-tions of model performance across 6 hyperparameters; (a) number of layers, (b) learning rate, (c) regularization type, (d) dropout rate, (e) global pooling operation, and (f) local pooling operation (of the in-terim layers). y-axis is AUC performance evaluated on the test set. Each row is a separate set of experiments. . . . . 130
List of Tables
2.1 Corpus statistics. Each study utilizes data with reduced annotations
and increased number of subjects, and was composed of three sets defined as gold, silver, and bronze. Gold contains 92 subjects with complete transcripts and speaker turn labels. Silver contains the same 92 subjects as the gold, but no transcripts and speaker turn labels. Bronze contains the full set of subjects, with no transcripts or speaker turn labels. . . . . 42
2.2 Computing ROC. The table displays an example of a model that
output probabilities of cognitive impairment for 5 subjects. For each threshold, there is a corresponding TPR and FPR which is used to plot the ROC and calculate the AUC (displayed in Figure 2-3). . . . . 47
3.1 Model Coefficients. Logistic regression model coefficients using global
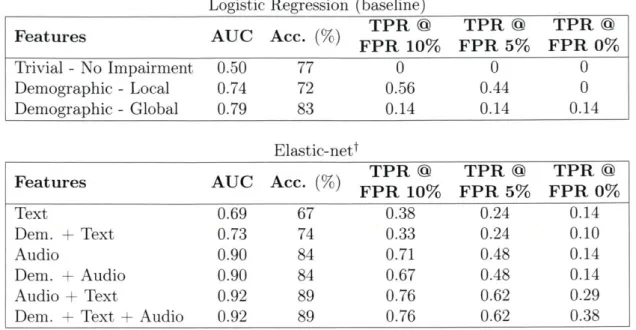
and local demographic features. Note that age is mean-variance nor-malized, hence, a 1 unit increase in age is not a one year increase but a 1 standard deviation increase (15 years). . . . . 60 3.2 Results. The table displays the performance of all models and
fea-ture sets. Top table displays results of logistic regression model utiliz-ing demographic features sets, while bottom table displays results of Elastic-Net regularized models utilizing various combinations of audio, text, and demographic features sets. Combining audio, text, and de-mographic features sets yields the overall best performing model.tAll Elastic-net models are well-calibrated (HL-test > 0.05). . . . . 61
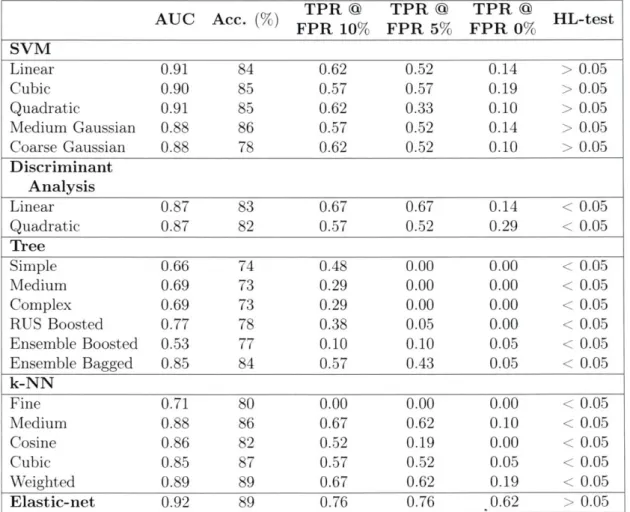
3.3 Full results. Results of all modeling frameworks using all features that were found to be significant during regularization (demographic. text, and audio). Analysis is leave-on-one-out cross-validation. .... 62
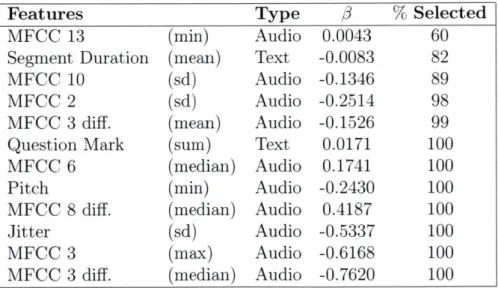
3.4 Selected Features. Features selected from demographic, audio, and
text feature set using Elastic-net regularization (0.92 AUC, a = 0.99, A = 'lambdaise'). The % selected indicates the proportion of leave-one-out folds the feature was selected. . . . . 63
4.1 Results of ASR (Exp. 2(a)-(b)), Speaker ID (Exp. 2(a)-(b)), and Cognitive ID (Exp. 3). The top table displays ASR, diariza-tion, and cognitive modeling when utilizing the full audio. The bottom table displays diarization and cognitive modeling when utilizing a sub-set of the segm ents. . . . . 79
5.1 Results. Audio feature set performs better than demographic feature set. Best model combines both audio and demographic feature sets. tResults have statistically significant improvement (p < 0.001) via t-test in detecting cognitive impairment. . . . . 92 5.2 Model coefficients. Model coefficients of features with 10 largest
ab-solute values in audio + demographic LI regularized logistic regression model. Features are composed of 2 demographics, and 8 audio energy features. . . . . 93
5.3 Description of Tests in the Neuropsychological Exam. The
tests listed correspond to Figure 5-6. . . . 100
6.1 Results. CNN max-pool model exhibits equivalent classification per-formance to the demographic model (AUC 0.85). The CNN mean-pool has the best sensitivity (82%) and is well-calibratedt (HL-test > 0.05). 114
6.2 Logistic Regression Model Coefficients. (Demographic model) Increasing age, male sex, and lower education levels are positively
as-sociated with cognitive impairment. (Demographic model
+
CNN)Including output prediction of max-pool CNN model yields a positive and significant association with the outcome, reduces model coefficients of other features, except for the APOE e4 biomarker, which now has a
Glossary
APOE Apolipoprotein
AUC Area Under the Receiver Operating Characteristic Curve
CI Cognitive Impairment
CNN Convolution Neural Network
DER Diarization Error Rate
HL-test Hosmer-Lemeshow Test
HNR Harmonic-to-noise Ratio
FHS Framingham Heart Study
FPR False Positive Rate
LSTM Long Short-Term Memory
MCI Mild Cognitive Impairment
MFCC Mel-frequency Cepstral Coefficient
ROC Receiver Operating Characteristic Curve
SSE Sum of Squared Error
TPR True Positive Rate
ZCR Zero Crossing Rate
Chapter 1
Setting the Scene
We meet Carol for the first time.
Interviewer: How old are you now? Carol: 65? 65. I think, right?
Interviewer: Yeah.
Three years later ...
Interviewer: How old are you?
Carol: 80? ... No? I don't know. Interviewer: You're actually 67. Carol: 67?
Interviewer: 67. Carol: Yeah?
Two years later ...
Interviewer: What's your husband's name? Carol: My husband's? [laughter]
Interviewer: Your husband's name. Carol: Yeah. [laughter]
Interviewer: The guy sitting to your left. Carol: Yeah. [laughter]
Interviewer: That big guy who loves you. Carol: Yeah. Yeah. Who loves me. [laughter] Carol: [silence]
Carol: *shakes head*
Carol's condition continues to degenerate for the next decade. She loses her abil-ity to speak and move. Her husband, the name of whom she struggles to recall, promises to support and care for her, 'until death do us part'. Many years later, her husband struggles with the difficult reality that the person he once knew is no more. A realization that leads him to suffer from severe depression and to contemplate sui-cide. As a former New York Police Department (NYPD) officer, he reports this was by far the most challenging situation he has ever had to cope with. With their life's savings dwindling, Carol is eventually moved to an elder care nursing home which can provide her with complete 24-hour support1 .
Carol's story illustrates the serious and slow toll dementia can take on the individ-ual and their loved ones. Her story provides a snapshot into the necessity of having comprehensive access to mental, emotional, medical, and financial services. While providing such support is often complex, the ability to detect cognitive impairment can play a critical role in preparing individuals for the long journey ahead. With this thread of the challenge held firmly in our grasp, we will show in this thesis how cog-nitive impairment may be detected from audio recordings of speech alone, a modality that is rich in information and also easy to record.
1Featured on CBS 60 Minutes. Alzheimer's Disease: Following a couple from diagnosis to the final stages of Alzheimer's. April 22nd 2018. https: www.cbsnews.con, news,
1.1
Contributions
This thesis provides the following contributions to the domains of speech, language, medical informatics, and machine learning.
" Modeling at scale: We evaluate the modeling and predictive performance of cognitive conditions at a population level of 5,000+ individuals.
" Operating with real-world limits: We present methods developed on, and evaluated for, real-world conditions where audio recordings are noisy, and ground truth transcriptions are often lacking. We are able to model cognitive impair-ment when only 1.4% of the data has manually generated transcriptions.
* Defining spoken language biomarkers: We present spoken language biomark-ers that are associated with cognitive impairment. While not everyone may have the luxury to code up and input biomarkers into a machine learning algorithm, one may still utilize this information in their personal mental model of the world as they interact with individuals within their sphere.
" Maintaining privacy: We utilize methods in which personal information about speakers (content of what was said) is not necessary and therefore pro-tected. In fact, our language modeling paradigm utilizes no personal informa-tion and allows us to diarize large amounts of audio while maintaining salient information for modeling cognitive impairment.
* Generating interpretable results: We apply techniques that map the asso-ciation between spoken language biomarkers and cognitive conditions. When the associations are not easily drawn from standard models, as is the case of neu-ral network models compared to logistic regression, we show how interpretable information can still be inferred.
1.2
Thesis Overview
This thesis is organized as follows, and builds on methods developed in each chapter. An overview of the studies presented in this thesis displayed in Figure 1-1.
In Chapter 2 we define cognitive impairment, describe prior work on detecting biomarkers (speech and non-speech), and the dataset used in this thesis.
In Chapter 3: Study 1 we model cognitive impairment on an initial cohort of 92 'gold' subjects utilizing fully annotated data (transcripts and speaker labels), and explore a set of audio and text based spoken language biomarkers.
Most of our data has no speaker turn labels, so in Chapter 4: Study 2 we present our audio diarization pipeline that utilizes role-specific language modeling to extract the segments in which a subject was speaking to model cognitive impairment. In Chapter 5: Study 3 we utilize spoken language biomarkers from audio alone to model 5,000+ 'bronze' subjects.
In Chapter 6: Study 4 we explore the use of neural network models that can learn to detect cognitive impairment straight from spectral energy of the audio waveform; eliminating the need for engineering hand-crafted features.
In Chapter 7 we summarize our findings and describe future work.
-d Model
Study 1 gold a
time aligne Feature (L1 regularized
ta t logistic regression)
Stuy 2 siler iarzatonFeature Model
Study 2 Diarization Extraction (L1 regularized
logistic regression)
Model
brone DirizalonFeature
Study 3 bronze Diarization Extraction (L1 regularized
logistic regression)
-
ModelStudy 4 bronze Diarization Neur Netork)
Figure 1-1: Overview of studies presented in this thesis. Gold, silver, and bronze refer to datesets with different levels of annotation quality.
Chapter 2
Background
Synopsis
Cognitive impairment is a noticeable decline in mental abilities which manifests in speech through memory loss, dis-connected thinking, and dis-fluent communication. The impairment may be caused by a variety of factors, such as Vascular dementia (stroke) and Alzheimer's disease, and affects about 4 million people above the age of 60 (1 in 20). The impact and prevalence of cognitive impairment creates a serious psychological and financial burden on patients, families, and greater society.
The medical community have developed structured tests conducted via in-person interviews to evaluate and score the presence for, and severity of cognitive impairment, often referred to as neuropsychological exams. Work is on-going to determine biomarkers of cognitive impairment, from brain imaging scans to laboratory tests, yet one modality for extracting bio-markers that has been relatively less explored, is speech. Speech has the advantage of containing the majority of information transmitted dur-ing neuropsychological exams, and may be recorded passively, usdur-ing an off-the-shelf microphone, and at the convenience of the subject's desired schedule and location.
To determine the viability of speech-based biomarkers, we utilize data collected from the Framingham Heart Study, which contains 7,779 audio recordings of neuropsychological examinations for 5,180 individuals con-ducted over a 10 year period from 2005 to 2015. This data allows us to perform population-level modeling with samples representative of the real-word prevalence of cognitive conditions.
2.1
Cognitive Impairment and Dementia
The word dementia came into circulation in the late 1700s due to its usage by one of the founders of modern psychiatry, Philippe Pinel [Torack, 1983]. It comes from the French/Latin word dimence or demens which means out of one's mind [Hippius and Neund6rfer, 2003, Jellinger, 2010]. Such an expression alludes to how unexplainable the ailment was seen to be. As knowledge expanded and techniques improved, the times were ready for Alois Alzheimer to be one of the earliest individuals to formally record dementia. He first observed "a peculiar severe disease process of the cerebral cortex" in a 56 year-old woman, too young to have been suffering from memory loss due to aging [Hippius and Neund6rfer, 2003]. Here is his description of one of his first patients, 56 year-old Johann F., and an example of an early neuropsychological exam in the history of this evaluation protocol [Moller and Graeber, 1998].
The 56-year-old labourer Johann F. was admitted to the psychiatric clinic on 12 Nov. 1907. There was no history of excessive drinking. Two years before admission his wife died, since then he became quiet and dull. In the previous 6 months he had become forgetful, could not find his way, could not perform simple tasks or carried these out with difficulty. Pupillary reaction normal. Patellar-reflex a little brisk. No signs of nervous palsy. Language strikingly slow, but without articulatory disturbance. Dull, slightly euphoric, impaired understanding. Echoes questions put to him frequently and repeatedly instead of giving a reply. Can only solve very simple calculations after a long delay. he cannot name a matchbox.
In current usage, dementia is defined as a decline in mental abilities that is severe enough to interfere with daily life. Individuals suffering from dementia struggle to recall names of objects and loved ones, string a coherent sentence together, follow a cooking recipe, and even lose the ability to be mobile. Dementia is not a symptom of 'normal aging', but are the observable symptoms of specific pathologies that may develop for many years before they become manifest [Nestor et al., 2004, Braak and
Del Tredici, 2012]. Pathologies that underly dementia include Alzheimer's disease, Vascular dementia, and Lewy Body dementia.
The mechanisms behind these pathologies can be complex and varied, but there is evidence to suggest that some pathologies (such as Alzheimer's) develop in stages [Nestor et al., 2004, Perl, 2010]. This temporal element is more pronounced in the case of stroke patients who exhibit improved motor function along with associated cortical reorganization during recovery [Feydy et al., 2002]. Furthermore, different pathophysiological conditions may manifest with varying levels of impact on cognition [Iadecola, 2010]. Even though the mechanisms causing dementia remain undiscovered, there is some utility in a simplified model to capture the relationship between cog-nitive function and the underlying pathology; as neuro-degeneration becomes more aggressive (i.e. pathological load), then cognitive function declines as a result. Figure 2-1 illustrates cognitive function (blue line) and pathological load (red line, which may be viewed either as a function of time or function of severity), and highlights how normal cognitive function is maintained up to a critical threshold (yellow band), then evolving into mild cognitive impairment (MCI), after which dementia becomes manifest (green band). This simplified model not only serves as a description on the relationship between pathology and cognitive function, but it helps illustrate some of the opportunities available during the different 'stages' of cognitive function (ex-panded upon in 2.1.1), and which affects a significant number of people.
As of 2013, about 4 million people above the age of 60 (1 in 20) were suffering from dementia in the USA alone, and 35 million globally, with these numbers estimated to double every 20 years [Prince et al., 2013]. Dementia is both a physically and financially taxing condition. Individuals may live for over a decade with the condition, which comes second only to spinal cord injuries in terms of debilitating effects. In addition, individuals spend on average $80,000 a year in services and support resulting in $200-$600 billion a year spent in the USA [Hurd et al., 2013, Wimo et al., 2006]. For perspective, the amount spent is the same market value as some of the world's mightiest conglomerates; Coca Cola, Walmart, and Petrochina.
Cognitive function Pathological load
Normal MCI Dementia
Figure 2-1: Pathological load and cognitive function as a function of time [Nestor et al., 2004]. (MCI = mild cognitive impairment)
2.1.1
The Value of Detecting Cognitive Conditions
The objective of this thesis may beg the question: why endeavour to detect cognitive impairment? Generally speaking, we would like to live longer and have healthier lives [Locke and Latham, 2002], so developing techniques to detect cogntive conditions will help extend our life-goal in the following three ways; as a pathway to treatment, as a motivation for lifestyle changes, and as an avenue for prevention.
Pathway to Treatment
Being notified of the presence of dementia can empower the patient and their friends/family to be strategic in acquiring support and services. Dementia is a costly condition with coverage often coming from personal savings or medical insurance (if it exists), so financial planning can help accommodate the condition and minimize its burden [Hirschman et al., 2008]. There are also different strategies patients and family can take when it comes to hospital care. There is evidence to suggest that hospital care in the home can reduce hospital visits and mortality rates since it reduces the stress and risk patients may be exposed to when visiting health-care facilities [Caplan et al., 2006]. There is also the issue of the hidden burden. Dementia is not only debilitating for those suffering from the condition, but it also takes its toll on caregivers such as
friends and family, who often feel that it is their duty to provide their full support, and who over time have to internalize the reality that the person they loved is no more the same person they interact with. A person who may not remember them, or recall past memories and shared experiences. The result is that 80% of caregivers state that they frequently experience high levels of stress and up to 50% of caregivers suffer from depression, which can be severe enough that they contemplate suicide as an outlet from the degenerative situation [Etters et al., 2008].
Motivating Lifestyle Changes
Detecting dementia may also motivate lifestyle changes. Studies have shown that daily engagement in cognitive activities [Hall et al., 2009], a healthy body-mass index (BMI) [Chuang et al., 2016], and bilingualism [Bialystok et al., 2007], can delay onset by months and years. It has also been observed that physical activity and nutrition may reduce the risk of developing dementia. Just three days of exercise a week and eating a fish meal a week keeps the brain at its peak, reducing the risk of dementia by 40% and 70% respectively [Larson et al., 2006, Morris, 2009].
Detection for Prevention
Research in preventative strategies is still young, with several clinical trials having been conducted over the years, but no positive outcomes yet [Mangialasche et al., 2010, Schneider et al., 2014]. What research has found however, is that individu-als who take non-steroidal anti-inflammatory drugs (NSAIDs) consistently, such as aspirin or ibuprofin, have a lower risk of developing dementia [Szekely et al., 2004]. Research on mice has shown that the SIRT3 protein protects brain cells against aging
[Cheng et al., 2016], and that individuals suffering from mixed pathologies have a more damaging outcome than individuals suffering from Alzheimer's alone [Kawas et al., 2015]. This evidence highlights that early detection of the onset of dementia will be critical in encouraging research and development of preventative treatments that are also holistic and considers the interactions between the many different brain related pathologies.
Finally, it is important to consider that while detection has its utility to motivate treatment strategies, the continuous monitoring of dementia is also important as it provides a timely method for decision-making by stakeholders, such as: evaluating the progress of a clinical trial [Grundman et al., 2004], determining the efficacy of medication [Guo et al., 1999], assessing the impact of a lifestyle change [Fratiglioni et al., 2004], establishing a power of attorney [Gregory et al., 2007], and deciding when a patient should move to an advance care facility [Chang et al., 2009].
2.2
Biomarkers
Earlier we highlighted Alois Alzheimer's early experience with a patient suffering from dementia. He came to the conclusion that there was a particular pathology causing the symptoms via autopsy. Even with evidence to suggest that such a malady (cog-nitive impairment outside of normal aging) was observed by and recorded as early as the Greeks, from Plato to Hippocrates [Boller and Forbes, 1998], our sophistication in conclusively diagnosing the pathology still remains with an autopsy of the brain [Clark et al., 2003, Knopman et al.. 2003, Walker et al.. 20071. However, there is a diverse range of work researching biomarkers for detecting dementia and the underly-ing pathology causunderly-ing it, that aim to deduce an individual's cognitive condition while they are alive.
2.2.1
Laboratory Tests to Brain Imaging Scans
Studies of cognitive impairment and dementia have explored multiple modalities of in-formation for assessment and diagnosis. This includes subjective measures of cognitive decline (e.g., patient's response to the question 'Has your memory become worse?') [Saykin et al., 2006, Jessen et al., 2010, Reisberg et al., 2010], medical profile (stroke, cardiovascular disease, blood pressure, etc.) [Newman et al., 2005, Satizabal et al., 2016], education level [Ott et al., 1995, Cobb et al., 1995], brain imaging exams [Au et al., 2006, Jack Jr et al., 2009, Mosconi et al., 2008], apolipoprotein E (APOE) genotype (from plasma samples) [Farrer et al., 1997, Kim et al., 2009, Myers et al.,
1996], atherosclerosis (via ultrasonography) [Hofman et al., 19971, brain-derived neu-rotrophic factor (BDNF) [Weinstein et al., 2014], cerebro-spinal fluid [Shaw et al.,
2009], and other laboratory measures (glucose homeostasis, markers of inflammation, blood homocysteine, folate, vitamin B-12, etc.) [Quadri et al., 2004, Van Himbergen
et al., 2012].
Currently, none of these biomarkers are part of the diagnostic criteria for Alzheimer's disease (as recommended by the National Institute on Aging-Alzheimer's Association workgroups [NIA-AA]), with suggested usage contained to a research setting [McK-hann et al., 2011]. The main reasons behind this constraint on the diagnostic criteria are due to the limited standardization of biomarkers, and because the core clinical criteria already provides good diagnostic accuracy.
2.2.2
Spoken Language
While the studies highlighted in Section 2.2.1 have explored associations between their measures and cognitive outcome, such information has a high barrier of acquisition due to the costly nature of laboratory tests and imaging scans, ranging anywhere from $100 for an APOE gene test [Keshava, 2017], to $4,000 for a brain imaging positron emission tomography (PET) scan (and which may not even be covered by health insurance) [Bahrampour, 2017]. This motivates the exploration of measures that are easier to record and are less invasive, specifically, speech.
Spoken Language as a Vessel for the Shadow of the Mind
Speech is commonly used as a proxy to assess an individual's cognitive state, by both medical professionals and untrained individuals (from friends to family), and is often the first indicator that something is amiss. The ability for spoken communication to relay cognitive health is exemplified through the design and usage of neuropsycho-logical exams to quantify a subject's cognitive state [Kurlowicz et al., 1999]. These exams are conducted one-on-one with a subject, in a structured interview-like format. The examiner poses pre-defined questions to the subject to verbally recall details of a
story, repeat a sequence of digits, define the similarity between two objects, read un-familiar words, and answer questions on general knowledge. Depending on what the subject responded, a score is assigned to quantify their cognitive impairment. Since the standard screening process for cognitive impairment relies on neuropsychological exams, it follows that the speech relaying information from the mind, can in and of itself, be used to model an individual's cognitive state. Indeed, speech contains both linguistic information (i.e. words as a response to questions posed during the exam) as well as prosodic information (i.e. the intonation used to communicate words), of which higher-order information may be extracted (i.e. whether they answered a ques-tion correctly, how long they took to recall a detail, or if they exhibited hesitaques-tion in their response).
Spoken Language is Easy to Record
Speech may also be easily recorded, using an off-the-shelf microphone or one's phone. The accessibility of microphones means speech can be recorded at any place and at any time. Speech recordings are also easy to store, which makes observation of changes over longer periods of time (weeks, months, years) possible.
Spoken Language Features of Cognitive Impairment
Many different patterns and features may be extracted from speech, from intona-tion to language usage. We can categorize features into two categories: text-based features and audio-based features, i.e. what was said and how it was said. Studies utilizing text-based features have modeled a subject's language by capturing patterns of word usage (e.g. part-of-speech tag, and vocabulary-to-total-words ratio) [Ripich et al., 1991, Thomas et al., 2005a], and conversation acts (e.g. response to question, active listening) [Lopez-de Ipinia et al., 2015]. Studies utilizing audio-based features have extracted acoustic information from the speech waveform such as speech/silence segments, onset time of speech, time intervals between words in a sentence as aligned with a transcript [K6nig et al., 2015], as well as prosodic information (e.g. pitch, shimmer, jitter) [Meildn et al., 2014, Lopez-de Ipifia et al., 20151.
Spoken Language Scenarios
Speech data utilized in studies have varied from being highly structured memory and reading tests [Meildn et al., 2014, K6nig et al., 2015, Fraser et al., 2016], to organic, open-ended, conversation-like interactions (e.g. sharing stories) [Atay et al., 2015, Lopez-de Ipifia et al., 2015].
Scale of Speech-based Studies
In terms of scale, studies have varied from utilizing a dozen subjects, to 1,000 [Bot et al., 2016, Wan et al., 2018]. Generally, the ratio between subjects with a cognitive condition relative to healthy controls, does not represent the real-world prevalence of the condition. For example, the largest study yet, with 1,000 subjects [Bot et al., 2016, Wan et al., 2018], had 50% of subjects with the outcome of interest, Parkinson's disease, yet the condition actually has a real-word prevalence of 0.4% (for ages 60 to 69) [Pringsheim et al., 2014]. The advantage of balancing outcomes is that the study focuses on determining the salient features of a condition, in isolation to other conflicting factors introduced by imbalanced data. However, for a model to generalize, it will need be able to operate in scenarios which represent the real-world incidence of conditions, similar to approaches pursued for anomaly detection [Haixiang et al., 2017], where class outcome of the data are proportional to the prevalence of the anomaly being detected, such as e-mail spam, or malicious system attacks which are rare, sporadic, but critical to detect.
Terminology
For the purpose of this thesis we will be using the term cognitive impairment (rather than dementia) to refer to the state wherein an individual has recognizable lapses in recalling memories, deficiencies in motor ability, and speech dis-fluencies attributed to some hidden (abnormal) function in the brain. We use this terminology inline with the ground truth and vocabulary used at the Framingham Heart Study. We will revisit this definition in Section 2.3.2.
2.3
The Framingham Heart Study
In this thesis, we utilized audio recordings of neuropsychological examinations from the Framingham Heart Study (FHS) to model cognitive impairment. The FHS is an on-going longitudinal, multi-generational population study of 15,447 subjects from 1948 to the present [Mahmood et al., 2014]. It was established by the National Heart Act in a time when cardiovascular conditions became the main cause of death in the USA, and poor understanding surrounded it.
Data from this study provides snapshots into the lives and health of individuals in the town of Framingham located in the state of Massachusetts in the USA. Using evaluation criteria developed by the medical community, the data contains detailed information on the mental well-being, personal relationships, socio-economic status, medical history, physical condition, cognitive health, and autopsy reports. Break-through research coming out of the study was able to discern associations between lifestyle behaviors (such as smoking and physical activity) with cardiovascular out-comes [Kannel et al., 1961, Kannel and Sorlie, 1979, Kannel, 2000], and more recently, research was able to map how happiness spreads in an in-person social network
[Fowler
and Christakis, 20081.2.3.1
Audio Recordings
Most relevant to this thesis, the data also contains 7,779 audio recordings of neu-ropsychological examinations for 5,180 individuals conducted over a 10 year period from 2005 to 2015. All this data combined allows for a holistic study, using estab-lished medical baselines, and both structured (medical records, exam format) and unstructured information (spoken language) to assess health and well-being.
2.3.2
Neuropyschological Examinations
Neuropsychological examinations are an important screening tool for the presence of cognitive conditions such as Alzheimer's disease, Parkinson's disease, and Vascular dementia [Elias et al., 2000]. The exam is composed of multiple components that
measure a specific domain of cognition such as: thinking, immediate and delayed memory recall, speech, and physical movement. Each exam component is assigned a score by the tester according to the established rubric, from which an overall score for the severity of cognitive impairment is computed. The scores can be 0 = not demented, 0.5 = mild cognitive impairment, 1 = mildly demented, 2 = moderately demented, and 3 = severely demented. A complete copy of the exam may be viewed in [Satizabal et al., 2016], while some of the tests are highlighted below.
Anna Thompson - Logical Memory Immediate, Delayed, and Recall
An example of a test within the the neuropsychological examination is the logical
memory test where subjects are asked to remember a story about a woman called Anna Thompson. An example of the tester delivering this test is provided below.
Prompt: Well, the first test we'll be doing today I'll be reading you a little
story of about four or five lines. When I'm through I'll ask you to tell me everything that I read to you, are you ready?
Story: Anna Thompson, of South Boston, employed as a scrub woman in an office building, reported at the City Hall Station that she had been held up, on State Street, the night before, and robbed of fifteen dollars. She had four little children, the rent was due, and they had not eaten for two days. The officers, touched by the woman's story, made up a purse for her.
Question 1 (Immediate): Tell me everything that I read to you.
Question 2 (Delayed): Well at the beginning of this test I read a story to you
I'd like you to tell me that story again.
Question 3a (Recall): Okay well now I'm going to ask you some questions
about that story and I'd like you to tell me which one of the three choices in each question is correct. Was the story about a woman a man or an animal?
Question 3b (Recall): Was her name Annie Thomas, Anna Thompson or
Question 3c (Recall): Was she from the Southwest, South Boston or Cape Cod?
East-West - Verbal Paired Associates, Immediate, Delayed, and Recall
For the Verbal Paired Associates Test, the subject is asked to recall the word as-sociated with a given word they've been shown before hand. Similar to the Anna Thompson test, the subject is asked to recall the pair immediately, later in the exam, and from a three-set option. Below as an example of the test prompt.
Prompt: Okay, for this next text I'm going to read you a list of words two at a time when I'm through I will tell you one of the words and then I want you to tell me the word that went with it, so for example if the words were east-west gold-walk then when I say east what would you say ... ?
Abstract Shapes, Digit Sequence, Animals, Clock-drawing and other tests There are several other tests, briefly, these include a test to evaluate visual repro-duction ability. The subject looks at a drawing composed of abstract shapes for 10 seconds, and then reproduce it by hand. Another test is the Digit Span where the subject is asked to recall a sequence of 4 to 9 digit numbers, forwards and backwards. The Animal Fluency test asks a subject to recall as many animals as possible. There is a clock-drawing test where the subject must reproduce a familiar object, a clock from memory, as well as fill in a pre-drawn clock. Yet another test asks a subject to define the similarity between two objects (How are an orange and banana alike? Saw and Axe? Eye and Ear? etc.). There is also a test to evaluate general knowledge (In what continent is Brazil? Who was Amelia Earhart?).
2.4
Challenges of Medical Speech Data
Speech is relatively easy to collect, requiring an off-the-shelf microphone and a data storage plan, however utilizing such a corpus in a medical context presents its own challenges.
2.4.1
Protecting Privacy
Privacy assurances comfort subjects and makes them more willing to share medical information, therefore raw audio recordings are hard to collect and and even more difficult to share because they (often inadvertently) contain identifiable information on the subject (e.g. their name, family details, work location).
2.4.2
High Quality Data Labels
Tools to automatically identify audio have yet to operate with the specificity de-manded by medical institutions (i.e. human parity). It has been demonstrated that speech-to-text systems can be trained to transcribe with human precision on specific data (< 6% word error rate [WER) [Xiong et al., 2017], however such corpora have been available for research and development for over 20 years. The pursuit of gen-erating high-quality transcriptions from audio recordings of individuals with speech dis-fluencies continues to be an on-going area of research [Christensen et al., 2012J, with results fluctuating anywhere from 4% to 90% WER for attempts to automatically transcribe speech of individuals with varying severities of speech impediments.
The alternative to automatic speech transcriptions is to have humans manually transcribe and de-identify the audio. This is too costly to scale as a viable solution; at $100 per audio recording, it would cost on the order of $800K to transcribe all recordings of the Framingham Heart Study.
2.4.3
Real-world Constraints Define the Research Trajectory
These limitations established by the need to maintain privacy of subjects and utilizing data with very limited transcriptions and speaker labels, opens up interesting areas for research, and defines the trajectory of this thesis.
Thus our outcome of interest is to detect cognitive impairment with almost: 1. No transcription information (What was said?).
![Figure 2-1: Pathological load and cognitive function as a function of time [Nestor et al., 2004]](https://thumb-eu.123doks.com/thumbv2/123doknet/14723946.571257/32.917.210.730.95.372/figure-pathological-load-cognitive-function-function-time-nestor.webp)