Altered exocrine function can drive
adipose wasting in early pancreatic cancer
The MIT Faculty has made this article openly available.
Please share
how this access benefits you. Your story matters.
Citation
Danai, Laura V. et al. “Altered exocrine function can drive adipose
wasting in early pancreatic cancer.” Nature 558 (2018): 600-604 ©
2018 The Author(s)
As Published
10.1038/s41586-018-0235-7
Publisher
Springer Science and Business Media LLC
Version
Author's final manuscript
Citable link
https://hdl.handle.net/1721.1/124925
Terms of Use
Article is made available in accordance with the publisher's
policy and may be subject to US copyright law. Please refer to the
publisher's site for terms of use.
Altered exocrine function can drive adipose wasting in early
pancreatic cancer
Laura V. Danai1,13, Ana Babic2,13, Michael H. Rosenthal2, Emily Dennstedt1, Alexander Muir1, Evan C. Lien1, Jared R. Mayers1, Karen Tai1, Allison N. Lau1, Paul Jones-Sali1, Carla
M. Prado3, Gloria M. Petersen4, Naoki Takahashi4, Motokazu Sugimoto4, Jen Jen Yeh5, Nicole Lopez6, Nabeel Bardeesy7, Carlos Fernandez-del Castillo7, Andrew S. Liss7, Albert C. Koong8,9, Justin Bui9,10, Chen Yuan2, Marisa W. Welch2, Lauren K. Brais2, Matthew H. Kulke2,11, Courtney Dennis12, Clary B. Clish12, Brian M. Wolpin2,†, and Matthew Vander Heiden1,2,12,†
1Koch Institute for Integrative Cancer Research and Department of Biology, Massachusetts Institute of Technology, Cambridge, MA 02139, USA
2Dana-Farber Cancer Institute, Boston, MA 02115, USA
3Department of Agricultural, Food and Nutritional Science, University of Alberta, Edmonton, Canada
4Mayo Clinic, Rochester, MN
5University of North Carolina at Chapel Hill, Chapel Hill, NC, Department of Surgery, University of North Carolina at Chapel Hill, Chapel Hill, NC
6University of California San Diego School of Medicine, La Jolla CA
7Massachusetts General Hospital Cancer Center, Harvard Medical School, Boston, MA 8MD Anderson, Department of Radiation Oncology, Houston, TX
9Stanford Cancer Institute, Stanford, CA
10David Geffen School of Medicine at University of California, Los Angeles, CA
11Boston University and Boston Medical Center, Section of Hematology/Oncology, Boston, MA
Users may view, print, copy, and download text and data-mine the content in such documents, for the purposes of academic research, subject always to the full Conditions of use: http://www.nature.com/authors/editorial_policies/license.html#terms
†Correspondence: Brian Wolpin (bwolpin@partners.org) or Matthew Vander Heiden (mvh@mit.edu).
13Co-first authors
Author contributions
L.V.D. designed, performed, and analyzed the animal experiments with input from M.G.V.H. L.V.D., A.B., B.M.W. and M.V.G.H. wrote the manuscript with assistance from all other authors. E.D. and P.J. S. assisted with animal experimentation. A.M. immortalized and A.N.L. isolated PSCs. E.C.L. performed caloric restriction experiments. J.R.M. performed muscle volume measurements and blood measurements. K.R. performed NEFA and glycerol assays. A.B., M.H.R., C.B.C., B.M.W. designed the human study. G.M.P., N.T., M.S., J.J.Y., N.L., N.B., C.F.C., A.S.L., A.C.K., J.B., C.Y., M.W.W., L.K.B., M.H.K., B.M.W. were involved in patient recruitment and patient data collection. C.D. and C.B.C. were involved in human metabolite measurements. A.B. and M.H.R. were analyzed human data. B.M.W. supervised human study.
HHS Public Access
Author manuscript
Nature
. Author manuscript; available in PMC 2018 December 20. Published in final edited form as:Nature. 2018 June ; 558(7711): 600–604. doi:10.1038/s41586-018-0235-7.
A
uthor Man
uscr
ipt
A
uthor Man
uscr
ipt
A
uthor Man
uscr
ipt
A
uthor Man
uscr
ipt
12Broad Institute of MIT and Harvard University, Cambridge, MA
Abstract
Changes in cell and organismal metabolism accompany malignancy1,2. Pancreatic ductal adenocarcinoma (PDAC) is associated with peripheral tissue wasting, a metabolic syndrome that lowers quality of life and is proposed to decrease cancer patient survival3,4. Tissue wasting is a multifactorial disease and targeting specific circulating factors to reverse this syndrome has been mostly ineffective in the clinic5,6. Here, we show that both adipose and muscle tissue loss occur early in pancreatic cancer development. Using syngeneic PDAC mouse models, we show that tumor growth in the pancreas but not in other sites leads to adipose tissue wasting, suggesting that tumor growth within the pancreatic environment contributes to this wasting phenotype. We find decreased exocrine pancreatic function drives adipose tissue loss and pancreatic enzyme replacement attenuates PDAC-associated peripheral tissue wasting. Paradoxically, reversal of adipose tissue loss impairs survival in mice with PDAC. Upon analysis of PDAC patients, we find that adipose and skeletal muscle depletion at the time of diagnosis is not associated with worse survival. Taken together, these results provide an explanation for adipose tissue wasting in early PDAC and suggest that early peripheral tissue loss associated with pancreatic cancer may not impair survival.
Autochthonous PDAC mouse models recapitulate many features of human disease including cachexia7,8. We confirmed severe adipose tissue (AT) and skeletal muscle wasting in advanced disease using two autochthonous mouse models with KrasG12D activation and loss of Trp53 function – either via Trp53 deletion (KP−/−C) or mutant Trp53R172H expression (KPC) (Fig. 1a–f). Because tissue protein breakdown occurs early in PDAC9, we assessed tissue wasting kinetics in the KP−/−C model and found decreased AT mass by 6 weeks of age, a time when pancreatic tissue weight was unchanged and plasma BCAAs, a measure of peripheral tissue wasting9, were modestly elevated (Fig. 1g–i, Extended Data Fig. 1a). AT wasting was greater than skeletal muscle wasting throughout disease progression (Fig. 1g– h), consistent with AT depletion preceding skeletal muscle loss10,11.
Histological analysis of gastrocnemius skeletal muscle (GA) in 6-week-old KP−/−C mice (early KP−/−C) suggested muscle atrophy characterized by decreased myofiber cross-sectional area (Extended Data Fig. 1b–c). Using micro computed tomography (μCT) imaging of the lower leg muscles (GA and soleus), we found decreased muscle volume in early KP−/−C mice (Extended Data Fig. 1d–e). We also observed decreased muscle mass and elevated expression of genes involved in autophagy and ubiquitin-proteosome degradation, suggesting activation of muscle breakdown (Extended Data Fig. 1f–g). Histological analysis of AT also revealed smaller adipocytes and enhanced lipolysis adipocytes in early KP−/−C mice (Extended Data 1h–l), suggesting reduced triglyceride synthesis or triglyceride storage. These results are consistent with enhanced lipolysis12,13 and muscle proteolysis14 in advanced cancer; however, in KP−/−C mice these changes occur by 6 weeks of age, suggesting peripheral tissue loss is initiated early in PDAC.
Although the KP−/−C model has predictable disease progression9, there is widespread pancreatic transformation and cancer progresses in young mice such that tissue depletion
A
uthor Man
uscr
ipt
A
uthor Man
uscr
ipt
A
uthor Man
uscr
ipt
A
uthor Man
uscr
ipt
could involve a failure to gain mass. To determine whether peripheral tissue wasting occurs in other PDAC models with longer time to disease onset, we assessed adipose and skeletal muscle mass in mice where oncogenic KrasG12D alone is activated in the pancreas (KC). KC mice develop premalignant lesions that progress to invasive tumors with advanced age8. In 15-week-old KC mice, an age preceding invasive cancer, we also observe decreased adipose and skeletal muscle mass (Fig. 1j–l, Extended Data Fig. 1m). These data argue peripheral tissue wasting in PDAC is initiated early and prior to frank cancer onset.
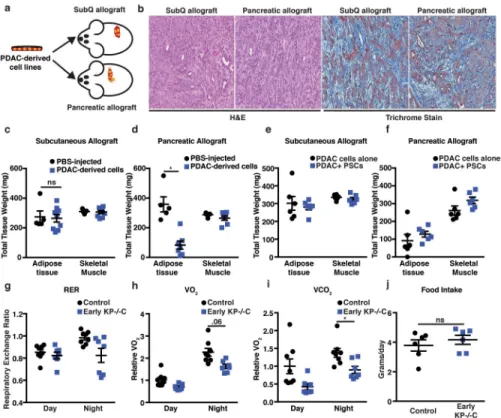
To test whether a PDAC-derived systemic factor mediates early tissue wasting in PDAC, we implanted PDAC cells isolated from autochthonous tumors either subcutaneously or orthotopically into the pancreas of syngeneic mice (Fig. 2a). When implanted into either location, solitary tumors form with similar histological features (Fig. 2b). Although mice were injected with the same number of cells, only the mice bearing orthotopic pancreatic tumors developed marked adipose wasting (Fig. 2c–d). Subcutaneous tumors are deficient in stromal components and may display reduced desmoplasia, although similar trichrome staining is observed in subcutaneous and orthotopic tumors, suggesting similar fibrosis (Fig. 2b). We isolated and immortalized pancreatic stellate cells (PSCs) from syngeneic mice15 and injected PDAC cells alone or with PSCs to form subcutaneous or pancreatic orthotopic tumors and tested whether this major component of the stroma contributes to peripheral tissue loss. Although we found that addition of PSCs did not alter peripheral tissue wasting, tumor location still contributed to tissue wasting (Fig. 2e–f). We next examined secreted factors reported to be elevated in late-stage PDAC and/or known to induce cachexia in other models4,16 and found no differences between control and early KP−/−C mice (Extended Data Fig. 2). These results argue tumor growth in the pancreas, rather than a known systemic circulating PDAC-derived factor, promotes early AT wasting.
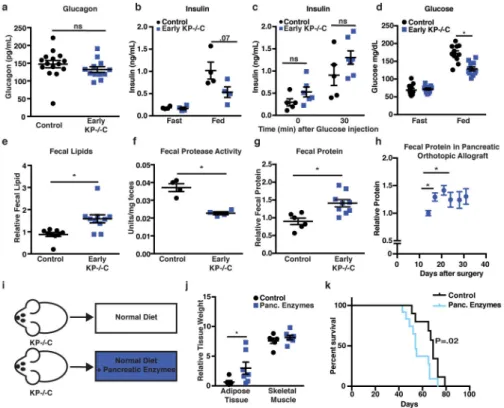
To explore how tumor growth in the pancreas promotes AT wasting, we assessed systemic O2 consumption, CO2 production, and calculated the respiratory exchange ratio (RER). Both control and early KP−/−C mice displayed similar RER (Fig. 2g), arguing against a shift in whole-body fuel source utilization. However, O2 consumption and CO2 production were lower in early KP−/−C mice (Fig. 2h–i), suggesting decreased nutrient oxidation. Because food intake was similar between groups (Fig. 2j), early KP−/−C mice may metabolize less food and altered pancreatic function could explain these findings as well as AT loss. To assess endocrine pancreatic function, we measured plasma glucagon and insulin. While we found no significant differences in glucagon (Fig. 3a), early KP−/−C mice displayed lower fed insulin (Fig. 3b). To test for an insulin secretion defect, we measured plasma insulin after a bolus glucose injection and found no significant differences (Fig. 3c). These results suggest endocrine pancreatic function is not altered in early PDAC; rather, impaired dietary absorption or starch breakdown could cause lower fed insulin levels. Consistent with this idea, we observed lower fed blood glucose levels in early KP−/−C mice (Fig. 3d). Furthermore, reduced insulin levels may promote increased lipolysis and AT loss. To assess exocrine pancreatic function, we measured fecal lipid content and found higher fecal lipids in early KP−/−C mice (Fig. 3e). We also found decreased fecal protease activity and increased fecal protein content in these mice (Fig. 3f–g). Orthotopic implantation of
A
uthor Man
uscr
ipt
A
uthor Man
uscr
ipt
A
uthor Man
uscr
ipt
A
uthor Man
uscr
ipt
PDAC cells also led to increased fecal protein content during disease progression (Fig. 3h). Decreased pancreatic exocrine function could explain why early KP−/−C mice display decreased O2 consumption and CO2 production despite normal food intake, leading to a starvation-like response with mobilization of energy stores from peripheral tissues. Indeed, mice bearing subcutaneous PDAC tumors fed a calorically restricted diet displayed enhanced AT loss compared to skeletal muscle loss and reduced tumor size (Extended Data Fig. 3a–d).
To test whether decreased exocrine pancreatic function contributes to tissue wasting in PDAC, we supplemented a diet with pancreatic enzymes (Fig. 3i). Providing pancreatic enzymes attenuated adipose wasting in PDAC mice (Fig. 3j). Furthermore, while early PDAC mice displayed decreased fed glucose levels (Fig. 3d), pancreatic enzyme
supplemented PDAC mice displayed similar glucose levels to control littermates (Extended Data Fig. 3e). To control for potential food intake differences associated with adding pancreatic enzymes to a diet, we pair fed mice to assure similar food consumption, and again observed attenuated AT loss in PDAC when providing pancreatic enzymes (Extended Data Fig. 3f–i). These results confirm decreased pancreatic exocrine function mediates AT loss and contributes to peripheral tissue wasting in mice with early PDAC.
Cachexia has been proposed to worsen patient survival in various cancers including PDAC3,4. To determine whether AT wasting limits survival in PDAC, we assessed whether pancreatic enzyme supplementation improved disease outcome. Surprisingly, despite reduced AT wasting, pancreatic enzyme supplementation decreased PDAC mouse survival (Fig. 3k), suggesting peripheral tissue wasting may not always limit survival.
To investigate the association of peripheral tissue wasting and patient survival, we identified 782 patients at five U.S. cancer centers with previously untreated PDAC, available clinical and outcome data, and banked blood samples (Extended Data Table 1). We quantified lumbar visceral and subcutaneous AT areas using pretreatment CT scans (Extended Data Fig. S4a)17,18. Although AT area was associated with multiple clinical factors (Extended Data Table 2), no association was found between AT wasting and patient survival in the full population (Table 1) or by disease stage (Extended Data Table 3a).
Studies of muscle wasting and PDAC patient survival have led to conflicting results17,19–22, potentially due to differences in study design. We next used CT imaging to measure lumbar skeletal muscle index (SMI), a marker of muscle mass17,19,20,22. Using established cut-points for sarcopenia14, we found that 65% of patients displayed sarcopenia at diagnosis, and these patients did not have worse survival (Table 1). Interestingly, the prevalence of sarcopenia was not different by disease stage (localized, 64%; locally advanced, 70%; and metastatic disease, 63%; P=0.40). Since an interaction between sarcopenia and BMI was proposed20,22, we evaluated whether sarcopenic obesity was associated with worse patient survival and observed no survival differences (Table 1). Because optimal sarcopenia cut-points are not well defined14, we investigated an agnostic SMI classification into gender-specific quintiles and found no association with patient survival (Extended Data Table 3b). We also examined muscle area and attenuation and did not identify an association of these markers with patient survival (Extended Data Table 3b). Finally, because plasma BCAAs
A
uthor Man
uscr
ipt
A
uthor Man
uscr
ipt
A
uthor Man
uscr
ipt
A
uthor Man
uscr
ipt
elevations reflect tissue wasting in early PDAC9, we evaluated whether plasma BCAAs at diagnosis were associated with reduced survival and did not identify worse outcomes with elevated BCAAs (Extended Data Tables 4–6, Extended Data Fig. 4b). Thus, in this multi-institutional patient population with newly diagnosed, previously-untreated PDAC, we found no evidence that early skeletal muscle or AT wasting was associated with worse survival. Independent of effects on survival, assessing peripheral tissue loss before overt disease onset may help identify PDAC at earlier stages. In mouse models, we found decreased exocrine function contributes to AT wasting. Many PDAC patients experience loss of exocrine pancreatic function23; however, whether decreased exocrine function contributes to wasting in patients requires further study. Furthermore, correction of pancreatic exocrine function in mouse models reduces AT wasting but does not significantly affect muscle loss, suggesting that pancreatic enzyme supplementation is either insufficient to fully restore the nutritional state or additional factors contribute to muscle wasting. These other factors may include stroma-derived inflammatory signals that were not tested in this study. Nevertheless, the findings that a starvation-like state in PDAC mouse models contributes to AT loss and increases survival are in agreement with data suggesting caloric restriction improves PDAC survival24, perhaps via similar mechanisms. Although not examined here, changes in insulin levels may contribute to survival differences upon reversal of a starvation-like state. The finding that pancreatic enzyme supplementation led to worse survival in mice, also suggests peripheral tissue wasting in early PDAC may be distinct from cachexia associated with late-stage disease. Nutritional intervention and pancreatic enzyme replacement are sometimes used in PDAC patients25 and better understanding the mechanisms that cause tissue wasting across cancer types and stages of disease is needed to design interventions that reduce functional disability and improve survival in cancer patients.
Methods
Cell culture
All cells were cultured in DMEM supplemented with 10% FBS (Corning) and 1% penicillin and streptomycin (Corning).
Western blot analysis
Antibodies recognizing pHSL (Ser563) (#4139) and total HSL (#4107) were purchased from Cell Signaling Technologies.
Animal studies
All experiments performed in this study were approved by the MIT Committee on Animal Care (IACUC). Furthermore, for subcutaneous tumor growth, a maximum tumor burden of 2 cm3 was permitted by our IACUC protocol and these limits were not exceeded. All mice in this study were fully backcrossed to the C57Bl/6J background, and housed on a 12-hour light and 12-hour dark cycle, and co-housed with littermates with ad lib access to water and food, unless otherwise stated. Furthermore, all experimental groups were age-matched and assigned based on genotype (or treatment). All animals were numbered and experiments conducted in a blinded manner. After data collection, genotypes were revealed and animals
A
uthor Man
uscr
ipt
A
uthor Man
uscr
ipt
A
uthor Man
uscr
ipt
A
uthor Man
uscr
ipt
assigned to groups for analysis. All measurements were collected from distinct animals, n represents biologically independent samples, and mice were analyzed as tumors were developed. Furthermore, no statistical methods were performed to predetermine sample size. For studies utilizing KrasG12D;Trp53fl/fl; Pdx1-cre (KP−/−C) mice, controls included littermate mice that lacked the cre-recombinase allele, LSL-KrasG12D allele, or both. For studies utilizing KrasG12D;Trp53R172H/+; Pdx1-cre (KPC) mice, control mice included littermates that lacked the LSL-KrasG12D allele or LSL-P53172H allele. For studies utilizing KrasG12D; Pdx1-cre (KC) mice, control mice included littermates expressing the cre allele. For subcutaneous or pancreatic orthotopic tumors, C57Bl/6J mice (000664) were injected with 105 murine PDAC cells isolated from C57Bl/6J KP−/−C mice as previously described9. Phosphate-buffered saline (PBS) or PDAC-cells were injected into the right flank (in 100 μL) or the pancreas of 8wk old C57Bl/6J mice (50 μL). For protein fecal collection studies in mice bearing orthotopic pancreatic tumors, mice were injected with 105 murine PDAC cells (50 μL) and allowed to recover from surgery for 2 weeks. Fecal matter was collected after this 2 week recovery time every 2–3 days for approximately 2–3 weeks and placed in −20°C until day of analysis. For studies utilizing pancreatic stellate cells (PSCs), we isolated PSCs as previously described26. After a few passages, PSCs were immortalized and injected at a 1:1 ratio as previously described.15
For experiments using metabolic cages, 5–6wk old mice were placed in metabolic cages and food intake, RER, volumetric rate of O2 consumption, and volumetric of CO2 production were measured over a 3-day period (TSE systems). RER was calculated using the following formula RER= VCO2/VO2.
For pair-feeding experiments, the amount of diet supplemented with pancreatic enzymes that was consumed per mouse per day was calculated for an average of 5 days. Animals with early PDAC were weighed, individually housed, and randomly given a pre-weighed quantity of food that was either control diet or diet supplemented with pancreatic enzymes. Mice were weighed prior to the start of the food-pairing experiment to ensure both groups of mice had similar starting body weights.
For caloric restriction studies, mice were injected subcutaneously (into both flanks) with PDAC-derived cells as described above. Animals were randomly placed on AIN-93G (TD. 94045) control diet and or same diet at 40% restriction after tumors were palpable. Mice were individually housed and fed daily either 3.2 g/day (control mice) or 1.9 g/day (calorically restricted mice) for a total of 3 weeks.
Animal diets
For diets supplemented with pancreatic enzymes, AIN-93G powdered diet (TD.94045) was purchased from Envigo and mixed with a commercial preparation of pancreatic enzymes as previously described27.
A
uthor Man
uscr
ipt
A
uthor Man
uscr
ipt
A
uthor Man
uscr
ipt
A
uthor Man
uscr
ipt
Assessment of glucose metabolism
Glucose levels were measured using a Breeze-2 glucose meter (Bayer). For insulin measurements, we used an Ultra Sensitive Mouse insulin ELISA (#90080) following the manufacturer’s protocol. For in vivo insulin secretion, mice were fasted for 16h and i.p. injected with glucose (1g/kg), blood samples collected and analyzed at the indicated time points.
Ex vivo lipolysis
Ex vivo lipolysis assays of adipose explants were performed as previously described28. Briefly, epididymal adipose tissues were collected and incubated at 37°C, non-esterified fatty acids (NEFA) were measured using Wako diagnostics and glycerol release was measured using Sigma Free Glycerol Determination kit (FG0100) according to manufacturer’s instructions.
Hormone and metabolite measurements
Blood samples were collected in EDTA-containing tubes and centrifuged 3,000 rpm for 15 minutes (4°C). Circulating levels of IL-6 (M6000B, R&D systems), corticosterone (80556, Crystal Chem), amylin (EIAM-AMY-1, RayBiotech) were measured according to the manufacturer’s instructions. TNF-α, IFNγ, IL-10, IL-1β, IL-17, IL-4 were measured using Discovery Assay (Eve Technologies). Circulating BCAAs levels were measured as previously described9.
μCT animal imaging
All animal CT measurements were performed using GE eXplore CT120. The scans were conducted at 70kVp, 50mA, and 32ms. There were 720 views, 0.5 degrees apart over a full 360-degree rotation. To assess muscle volume, a 3D Gaussian filter was used in an area extending from the right ankle to the proximal end of the fibula. This filtered data set was used to determine areas corresponding to leg muscle while excluding other tissues. This was done in Matlab using connected components (bwconncomp) function. Having created the mask (segmented the leg muscle from other tissues), a histogram of the muscle region was calculated. Voxels falling within the density range 160–200 Hounsfield units (HU) were considered muscle. This was done to correct for any overlap of the muscle mask with adjacent bone or adipose (higher and lower HU values respectively).
Fecal assays
To assess total fecal protein, 10mg of feces were re-suspended in lysis buffer (2% SDS, 150mM NaCl, .5M EDTA), sonicated, and protein concentration assessed using BCA assay according to manufacturer’s instructions. Total fecal protease activity was measured as previously described29. Briefly, 10–30 mg of fecal matter was resuspended in 1mL of buffer A (.1%Triton X-100, .5M NaCl, 100 mM CaCl2), sonicated, and centrifuged. The
supernatant was then incubated with 3% Azo-Casein (Sigma A2765) 37°C for 60 min. The reaction was stopped using 8% trichloroacetic acid and centrifuged. The absorbance of the supernatant (366 nm) was measured using a spectrophotometer. Total fecal lipids were measured as previously described30. Briefly, 1,000 mg of feces were collected and lipids
A
uthor Man
uscr
ipt
A
uthor Man
uscr
ipt
A
uthor Man
uscr
ipt
A
uthor Man
uscr
ipt
extracted using 2:1 Chloroform to Methanol. The lipid fraction was dried using a stream of gaseous nitrogen and vials weighed.
Histological Analysis
Tissues were fixed overnight with neutral-buffered 10% formalin, paraffin embedded, sectioned, and stained with hematoxylin and eosin or stained with Masson’s Trichrome using standard protocols.
Statistics for animal data
All data is presented was graphed using Prism (GraphPad) software and depicted as mean ± SEM. Unless otherwise indicated, P values were determined using unpaired two-sided t-test. Statistical outliers were measured using Grubb’s outlier test (Prism) and excluded from final analysis.
Human population study
Study population—Our study population included pancreatic cancer patients from five U.S. cancer centers: Dana-Farber/Brigham and Women’s Cancer Center (DF/BWCC), Massachusetts General Hospital (MGH), Mayo Clinic, Stanford University, and University of North Carolina-Chapel Hill (UNC). We included 782 patients with pancreatic
adenocarcinoma who were diagnosed between 2000 and 2015, and had a stored plasma sample collected prior to receiving any treatment for their malignancy, including surgery, radiation or chemotherapy. A total of 778 patients at the five institutions met these criteria and had a plasma sample collected within 30 days before their pathological diagnosis and 60 days after this diagnosis. Of these patients, 687 had an available computed tomography (CT) scan performed during this time period for analysis of body composition. The overall study was approved by the Dana-Farber/Harvard Cancer Center IRB, and data abstraction and blood sample collection was approved by each individual institutional IRB. All participants provided informed consent.
Human plasma samples and metabolite profiling
Blood was collected in sterile EDTA tubes, and processed within 3 hours (DFCI, Mayo Clinic, Stanford University, UNC) or 24 hours (MGH) for separation into plasma and other components. Plasma was aliquoted into cryovials and stored at −80° C. Plasma samples were thawed once on wet ice to aliquot into smaller sample volumes for analysis, de-identified, and sent for analysis in a single shipment.
Liquid chromatography tandem mass spectrometry (LC-MS) analyses were conducted using a Shimadzu Nexera X2 U-HPLC (Shimadzu Corp.; Marlborough, MA) coupled to a Q Exactive hybrid quadrupole orbitrap mass spectrometer (Thermo Fisher Scientific; Waltham, MA). Polar metabolites were extracted from plasma (10 μL) using 90 μL of 74.9:24.9:0.2 v/v/v acetonitrile/methanol/formic acid containing stable isotope-labeled internal standards (valine-d8, Sigma-Aldrich; St. Louis, MO; and phenylalanine-d8, Cambridge Isotope Laboratories; Andover, MA). The samples were centrifuged (10 min, 9,000 × g, 4°C), and the supernatants were injected directly onto a 150 × 2 mm, 3 μm Atlantis HILIC column (Waters; Milford, MA). The column was eluted isocratically at a flow rate of 250 μL/min
A
uthor Man
uscr
ipt
A
uthor Man
uscr
ipt
A
uthor Man
uscr
ipt
A
uthor Man
uscr
ipt
with 5% mobile phase A (10 mM ammonium formate and 0.1% formic acid in water) for 0.5 minute followed by a linear gradient to 40% mobile phase B (acetonitrile with 0.1% formic acid) over 10 minutes. MS analyses were carried out using electrospray ionization in the positive ion mode using full scan analysis over 70–800 m/z at 70,000 resolution and 3 Hz data acquisition rate. Other MS settings were: sheath gas 40, sweep gas 2, spray voltage 3.5 kV, capillary temperature 350°C, S-lens RF 40, heater temperature 300°C, microscans 1, automatic gain control target 1e6, and maximum ion time 250 ms. Raw data were processed using TraceFinder software (Thermo Fisher Scientific; Waltham, MA). Metabolite identities were confirmed using authentic reference standards.
To evaluate reproducibility of BCAA measurements, we included 77 blinded quality control (QC) plasma samples within the larger sample set, from eight plasma QC pools. The mean coefficients of variance were 7.6% for isoleucine, 8.0% for leucine, and 7.3% for valine. Since blood samples from MGH were processed after >3 hours, we evaluated the
reproducibility of BCAA measurements between samples processed at different time points after collection. For 10 patients, we processed blood immediately and at 24 hours and measured plasma BCAAs. Spearman correlation coefficients for the BCAA levels at the two time points were 0.95 for isoleucine, 0.95 for leucine, and 0.92 for valine. All blood samples were collected into EDTA plasma tubes, except for 28 blood samples collected as serum from MGH patients. To evaluate BCAAs in plasma versus serum tubes, we measured BCAA levels among 10 patients who had simultaneous collection of plasma and serum. Spearman correlation coefficients for plasma BCCAs by plasma versus serum samples were 0.84 for isoleucine, 0.76 for leucine, and 0.94 for valine. Given the high correlation coefficients for plasma BCAAs by both time of blood processing and plasma versus serum collection, we included all MGH patients in our study population.
Computed tomography imaging quantitation of muscle and adipose tissue in patients
Muscle, visceral adipose tissue, and subcutaneous adipose tissue areas were measured through the third lumbar vertebra landmark on CT imaging as previously published17,18. Scans from the DF/BWCC, MGH, Stanford University, and UNC study sites (n=363) were manually segmented using Slice-O-Matic software (v4.3; Tomovision, Montreal, Canada) by trained image analysts with final verification from a board-certified radiologist. All
paraspinal and abdominal wall muscles were included in the muscle area. The Hounsfield CT attenuation scale was used to constrain adipose tissue and muscle selection. The Hounsfield scale is a linear transformation of the linear attenuation coefficient, with fixed points calibrated for air at −1000 Hounsfield units (HU) and water at 0 HU. All medical CT scanners are routinely calibrated to this scale. Pixel attenuation constraints of −29 to +150 HU were used for muscle and −180 to −30 HU for adipose tissue as previously
published17,18. The visceral adipose tissue compartment was defined by the peritoneum; all extraperitoneal adipose tissue was included in the subcutaneous compartment. Pixel dimensions were extracted from scanner parameters embedded within the scan data; total area was measured as the product of segmented pixel count and pixel area. We calculated skeletal muscle index (SMI) as the ratio of skeletal muscle area (cm2) to height squared (m2). Muscle attenuation was defined as the average Hounsfield attenuation of all pixels in
A
uthor Man
uscr
ipt
A
uthor Man
uscr
ipt
A
uthor Man
uscr
ipt
A
uthor Man
uscr
ipt
the muscle area. Analyst performance was tested, and a test-retest coefficient of variation < 1.1% was observed for all analysts and parameters.
Scans from the Mayo Clinic site (n=324) were analyzed using in-house developed software written in Matlab (Matlab 2015b, MathWorks, Natick, MA) with manual correction by a trained image analyst. The software automatically fits three concentric closed contours at the air-skin boundary, the subcutaneous adipose-muscle boundary, and the abdominal wall-peritoneal adipose boundary using hierarchical morphological classification constrained by a prior probability shape model. These boundaries defined the same zones as were described for the Slice-O-Matic method. The software also automatically created masks for bone and colonic content and these masks were used to exclude bone and colonic content from being included as muscle or adipose tissue. The final boundaries were verified by a board-certified radiologist. Adipose and muscle areas were then calculated for each compartment using the same attenuation constraints as described for the Slice-O-Matic method
To ensure consistency across sites, we analyzed 20 cases using both methods and found a coefficient of variation of 2.4%, 1.7%, and 3.8% between the methods for the skeletal muscle, subcutaneous adipose tissue, and visceral adipose tissue areas respectively. The maximum observed differences were 4.1%, 3.6%, and 15.2% for these compartments.
Covariate Data and Statistical Analysis of Patient Data
Using patient questionnaires and medical records, we extracted information on patient and clinical characteristics, including: age at diagnosis, gender, race/ethnicity, height, weight at blood collection, diabetes history (no diabetes, diabetes of duration <4 years, diabetes of duration ≥4 years), tobacco use (never, past, current), primary tumor location (head or uncinate, body, tail, other), cancer stage (local, locally advanced, metastatic), year of diagnosis, and survival time.
Body composition measurements and plasma BCAAs by patient characteristics were compared using Wilcoxon rank-sum test or Kruskal-Wallis test. Pearson correlation test was used to evaluate the linear relationship between body composition measurements, plasma BCAAs and other patient characteristics. To evaluate the associations between patient survival, body composition measurements, and plasma BCAAs, we used multivariable-adjusted Cox proportional hazards regression and calculated hazard ratios (HRs) and 95% confidence intervals (CI). Survival time was calculated as the time from diagnosis to death or date of last follow-up if the patient was still alive. In an initial multivariate model, we adjusted for age at diagnosis (continuous), gender (male, female), race (White, non-White, unknown), year of diagnosis (2000–2005, 2006–2010, 2011–2015), institution (DF/BWCC, MGH, Mayo Clinic, Stanford University, UNC), and cancer stage (localized, locally advanced, metastatic, unknown). In a second multivariate model, we additionally adjusted for BMI (continuous), history of diabetes (none, ≤4yrs, >4yrs, unknown), and smoking status (never, past, current, unknown), which have previously been shown to associate with patient survival31,32.
Since cut-offs to define clinically relevant body composition categories are not well defined, we also divided patients into quintiles by AT and muscle tissue measurements. Since
A
uthor Man
uscr
ipt
A
uthor Man
uscr
ipt
A
uthor Man
uscr
ipt
A
uthor Man
uscr
ipt
distribution of body composition measurements differed by gender (Supplementary Table 2), we created gender-specific quintiles for all body composition measurements. P-values for linear trend were calculated by entering the quantile-specific median value for body composition measurements in the Cox proportional hazards models.
To evaluate sarcopenia, we used the SMI criteria established by a recent international consensus definition of cancer cachexia14. The SMI cut-offs were 55.4 cm2/m2 for men, and 38.9 cm2/m2 for women. To evaluate sarcopenic obesity, we generated a combined variable, where overweight/obesity status is defined as BMI ≥ 25kg/m2, similar to a previous study in patients with PDAC22. The resulting four categories were overweight/obese and sarcopenic, overweight/obese and sarcopenic, overweight/obese and sarcopenic,
non-overweight/obese and non-sarcopenic. For plasma BCAAs, patients were divided into quartiles, with quartiles 2–4 compared to quartile 1 as the referent. P-value for trend was calculated by entering quartile-specific median values for total plasma BCAAs as a continuous variable in the Cox proportional hazards model.
We performed stratified analyses by disease stage, and statistical interaction was assessed by the Wald test of the cross-product term between stage (localized, locally advanced,
metastatic, unknown) and tissue measurements (continuous). We also calculated the HR for each institution and measured heterogeneity across centers using the Cochran’s Q statistic33. This statistic is a weighted sum of squared deviations of an individual study’s estimate from the overall estimate obtained by meta-analysis. All analyses were performed with SAS 9.2 statistical analysis software, and all P-values were two-sided.
Data Availability—Source data for the graphical representations found in all figures (Fig 1–3) and Extended Data figures (Fig. S1–S3) have been provided. All other data that supports the findings of this study are available upon request.
A
uthor Man
uscr
ipt
A
uthor Man
uscr
ipt
A
uthor Man
uscr
ipt
A
uthor Man
uscr
ipt
Extended Data
Extended Data Figure 1. PDAC is associated with adipose and skeletal muscle wasting
a. Circulating BCAAs (μM) (Valine, Leucine, and Isoleucine) in male control and early KP
−/−C mice (N=12, 10). b. Representative histology of H&E stained gastrocnemius muscle (GA) of early KP−/−C mice (N=4). c. Relative myofiber area in male control and early KP−/ −C mice (N=3) (P<.0001). d. Representative 3D μCT imaging reconstruction of soleus and gastrocnemius skeletal muscle (highlighted in red). e. Relative soleus and gastrocnemius skeletal muscle as assessed by μCT scan of control and early KP−/−C male mice (N=10) (P=.04). f. Skeletal muscle tissue mass of the indicated muscle groups in male control and early KP−/−C mice (N=8, 9) (P=.006 (Quadriceps), P=.02 (Tibialis Anterior), P=.004 (Soleus)). g. Relative mRNA expression of the indicated genes assessed by RT-qPCR (N=4) (P=.05 (Mstn), P=.01 (Trim63), P=.07 (Fbxo32), P=.00004 (Map1lc3a), P=.006
(Gabarapl1). h. Representative histology of H&E stained epididymal adipose tissue from control and early KP−/−C male mice (N=4). i. Relative adipocyte area in male control and early KP−/−C mice (N=3) (P<.0001). j. Glycerol release in ex vivo adipose tissue explants
A
uthor Man
uscr
ipt
A
uthor Man
uscr
ipt
A
uthor Man
uscr
ipt
A
uthor Man
uscr
ipt
from control and early KP−/−C male mice (N=7) (P= .01). k. Non-esterified fatty acid (NEFA) release in ex vivo adipose tissue explants from control and KP−/−C male mice (N=8, 7) (P=.0002). l. Representative western blot analysis of pHSL and HSL expression in adipose tissue of control and early KP−/−C male mice (N=3). m. Representative H&E histology of pancreata in 15wk KC male mice (N=5). Unless otherwise indicated, statistical analysis was performed using unpaired two-sided t-test, data are mean ± SEM, and N represents number of mice analyzed.
Extended Data Figure 2. Systemic circulating factors are not altered in early PDAC
a–j Circulating levels of the indicated factors in control and Early KP−/−C mice. a. IL-6
(N=16, 14) (P=.45). b. TNF-α (N=12, 10) (P=.45). c. PTHrp (N=7, 8) (P=.94). d. Corticosterone (N=19, 16) (P=.40). e. Amylin (N=7, 6) (P=.91). f. IL-1β (N=11, 10) (P=. 39). g. IL-4 (N=12, 10) (P=.56). h. IFNγ (N=12, 9) (P=.08). i. IL-10 (N=12, 10) (P=.42). j. IL-17 (N=12, 10) (P=.29). Unless otherwise indicated, statistical analysis was performed using unpaired two-sided t-test, data are mean ± SEM, and N represents number of mice analyzed.
A
uthor Man
uscr
ipt
A
uthor Man
uscr
ipt
A
uthor Man
uscr
ipt
A
uthor Man
uscr
ipt
Extended Data Figure 3. Decreased exocrine pancreatic function in early PDAC disease promotes adipose tissue loss
a–d. C57Bl/6J mice bearing PDAC-derived subcutaneous tumors fed a control diet or same
diet at 40% caloric restriction (CR) for 3 weeks (N=8). a. Body weight (P<.0001). b. Epididymal adipose tissue (eWAT) and inguinal adipose tissue (iWAT) mass normalized to body weight (P=<.0001 for eWAT and P=.0034 for iWAT). c. Skeletal muscle mass of the indicated muscle groups normalized to body weight. d. Tumor volume normalized to body weight (P=.002) (N=15 tumor (2 tumors per mouse)) e. Fed plasma glucose levels in 7-week-old male control and KP−/−C mice fed indicated diets (N=4) (P=.18). f. Tissue weights normalized to body weight in KP−/−C mice pair-fed indicated diets (N=4) (P=.01 and P=.53). g–h. Tumor weight normalized to body weight in KP−/−C mice fed indicated diets for 1wk. g. KP−/−C mice fed indicated diets (N=6, 7) (P=.9) h. KP−/−C mice pair-fed indicated diets (N=4) (P=.26). i. Representative histology of H&E stained autochthonous pancreatic tumors of KP−/−C mice fed indicated diets (N=4). Unless otherwise indicated, statistical analysis was performed using unpaired two-sided t-test, data are mean ± SEM, and N represents number of mice analyzed.
A
uthor Man
uscr
ipt
A
uthor Man
uscr
ipt
A
uthor Man
uscr
ipt
A
uthor Man
uscr
ipt
Extended Data Figure 4. Use of CT imaging to assess patient body composition and relationship between plasma BCAAs levels and patient survival by study site
a. Representative CT image used to analyze body composition. Skeletal muscle is shown in
red, intramuscular adipose tissue is shown in green, visceral adipose tissue is shown in yellow, and subcutaneous adipose tissue is shown in blue. b. Hazard ratios (HRs) and 95% confidence intervals (CI) for the association between plasma BCAAs and patient survival, comparing the top to bottom quartile, calculated using Cox proportional hazards model adjusted for age at diagnosis (continuous), gender (male/female), race (white, non-white, unknown), year of diagnosis (2000–2005, 2006–2010, 2011–2015), cancer stage (local, locally advanced, metastatic, unknown), BMI (continuous), diabetes history (none, ≤4yrs, >4yrs, unknown), and smoking status (never, past, current, unknown). The pooled HR was calculated by the DerSimonian and Laird random-effects model. The solid squares and horizontal lines correspond to the study site-specific multivariate HR and 95% CI, respectively. The area of the solid square reflects the study site-specific weight (inverse of the variance). The filled diamond represents the pooled HR and 95% CI. The solid vertical line indicates an HR of 1.0. (N=778). Abbreviations: DF/BWCC, Dana-Farber/Brigham and Women’s Cancer Center; MGH, Massachusetts General Hospital; UNC, University of North Carolina; BMI, body mass index.
A
uthor Man
uscr
ipt
A
uthor Man
uscr
ipt
A
uthor Man
uscr
ipt
A
uthor Man
uscr
ipt
Extended Data Table 1
Pancreatic cancer patient characteristics by (a) study site and (b) availability of blood samples and CT images
a.
Overall DF/BWCC MGH Stanford UNC Mayo
No. of patients 782 281 58 36 57 350 Diagnosis period, years
2000–2005 110 (14) 25 (9) 0 (0) 14 (39) 0 (0) 71 (20) 2006–2010 292 (37) 90 (32) 18 (31) 15 (42) 24 (42) 145 (41) 2011–2015 380 (49) 166 (59) 40 (69) 7 (19) 33 (58) 134 (38) Age at diagnosis, years 66.0 (10.7) 64.3 (10.0) 69.4 (10.2) 67.9 (13.1) 68.2 (11.1) 66.2 (10.7) Female sex 347 (44) 133 (48) 28 (48) 11 (32) 31 (54) 144 (41) White race 698 (89) 252 (90) 39 (67) 24 (67) 39 (68) 344 (98) Body mass index, kg/m2 27.4 (5.2) 26.7 (5.2) 27.0 (5.7) 24.7 (4.7) 27.4 (4.7) 28.2 (5.0)
Diabetes history No diabetes 565 (72) 194 (69) 46 (79) 28 (78) 32 (56) 265 (76) Diabetes ≤4 years 100 (13) 38 (14) 5 (9) 4 (11) 8 (14) 45 (13) Diabetes >4 years 54 (7) 20 (7) 4 (7) 2 (6) 7 (12) 21 (6) Unknown 63 (8) 29 (10) 3 (5) 2 (6) 10 (18) 19 (5) Tobacco use Never 335 (43) 127 (45) 14 (24) 18 (50) 20 (35) 156 (45) Past 330 (42) 121 (43) 36 (62) 13 (36) 25 (44) 135 (39) Current 68 (9) 30 (11) 8 (14) 4 (11) 12 (21) 14 (4) Missing 49 (6) 3 (1) 0 (0) 1 (3) 0 (0) 45 (13) Primary tumor location
Head/Uncinate 481 (62) 161 (57) 41 (71) 24 (67) 49 (86) 206 (59) Body 142 (18) 64 (23) 6 (10) 8 (22) 3 (5) 61 (17) Tail 97 (12) 47 (17) 11 (19) 3 (8) 5 (9) 31 (9) Body and tail 31 (4) 5 (2) 0 (0) 1 (3) 0 (0) 25 (7) Head and body 22 (3) 0 (0) 0 (0) 0 (0) 0 (0) 22 (6) Other 9 (1) 4 (1) 0 (0) 0 (0) 0 (0) 5 91) Cancer stage Local 258 (33) 52 (19) 51 (88) 5 (14) 54 (95) 96 (27) Locally advanced 157 (20) 47 (17) 0 (0) 21 (58) 1 (2) 88 (25) Metastatic 308 (39) 175 (62) 4 (7) 9 (25) 2 (4) 118 (34) Unknown 59 (8) 7 (2) 3 (5) 1 (3) 0 (0) 48 (14) Median survival, months
Local 20.6 20.5 25.8 6.3 17.4 22.4 Locally advanced 11.0 13.0 n/a 7.9 1.4 11.1 Metastatic 7.0 6.9 15.5 4.9 3.9 8.2
A
uthor Man
uscr
ipt
A
uthor Man
uscr
ipt
A
uthor Man
uscr
ipt
A
uthor Man
uscr
ipt
b.
Full Study Population (Pt No.) Blood Samples (Pt No.) CT Images (Pt No.)
DF/BWCC 281 280 244 MGH 58 58 38 Stanford 36 34 33 UNC 57 56 48 Mayo Clinic 350 350 324 Total 782 778 687
a. Continuous variables are reported as mean (standard deviation), and categorical variables are reported as number
(percent) at time of diagnosis unless otherwise noted.
Abbreviations: CT, computed tomography; DF/BWCC, Dana-Farber/Brigham and Women’s Cancer Center; MGH, Massachusetts General Hospital; UNC, University of North Carolina
Extended Data Table 2
Pancreatic cancer patient characteristics by body composition measurements.
PtNo. SMI (cm2/m2) Muscle area (cm2) Muscle attenuation (HU) Subcutaneous
fat area (cm2) Visceral fat area (cm2)
Age < 60 yrs 194 47.9 (9.9) 144.4 (37.4) 39.1 (9.4) 206.9 (116.6) 155.0 (107.9) 60 – <70 yrs 238 46.6 (11.1) 134.2 (34.9) 36.9 (9.6) 214.7 (115.1) 163.2 (103.5) ≥ 70 yrs 255 41.7 (7.7) 118.4 (28.9) 32.4 (9.4) 185.3 (94.2) 163.7 (111.0) P-value* 9.8×10⁻¹³ 3.3×10⁻¹⁴ 3.0×10⁻¹² 0.03 0.53 Gender Male 384 49.5 (8.8) 153.8 (27.6) 37.0 (9.4) 185.8 (102.2) 203.0 (111.9) Female 303 39.5 (8.5) 102.6 (17.8) 34.5 (10.3) 221.5 (113.8) 107.8 (72.7) P-value* 3.7×10−51 6.5×10−88 0.004 2.3×10⁻⁶ 2.1×10⁻³¹ Race White 621 45.0 (10.0) 131.4 (34.4) 35.6 (9.8) 201.2 (105.5) 163.9 (105.5) Non-White 42 46.8 (11.1) 129.7 (39.8) 37.6 (10.7) 216.4 (137.3) 117.6 (118.3) P-value* 0.24 0.60 0.15 0.80 0.001 Diabetes No diabetes 498 44.4 (9.4) 129.4 (35.1) 37.0 (9.7) 191.4 (99.6) 148.8 (105.6) Diabetes ≤4 yrs 92 45.8 (8.5) 133.5 (33.0) 33.3 (10.1) 224.4 (112.3) 189.2 (99.0) Diabetes >4 yrs 48 48.0 (10.6) 144.1 (35.9) 35.1 (8.7) 216.5 (130.4) 207.2 (116.1) P-value* 0.01 0.01 0.004 0.03 3.2×10⁻⁶ BMI, kg/m2 <18.5 14 35.1 (4.6) 92.4 (15.0) 44.9 (12.2) 61.3 (51.9) 24.3 (20.7) 18.5–24.9 220 41.0 (8.0) 117.8 (31.2) 39.0 (9.2) 135.6 (64.8) 89.9 (67.2) >24.9–29.9 260 45.6 (8.1) 134.7 (32.1) 35.4 (8.7) 193.6 (73.3) 176.0 (91.1) >29.9–34.9 117 49.4 (10.2) 146.4 (36.3) 32.9 (9.7) 264.3 (83.0) 228.1 (100.2) >35 54 50.7 (10.0) 147.8 (35.6) 29.2 (10.9) 398.4 (121.2) 269.1 (128.0) P-value* 3.6×10⁻²² 7.1×10⁻¹⁹ 2.3×10⁻¹² 1.0×10⁻²⁹ 1.1×10⁻²⁹ Current smoking No 586 45.2 (10.1) 131.3 (35.1) 35.8 (9.8) 201.6 (105.6) 163.0 (109.4) Yes 55 42.9 (8.6) 121.0 (29.9) 35.7 (11.1) 183.5 (112.6) 123.8 (88.4)
A
uthor Man
uscr
ipt
A
uthor Man
uscr
ipt
A
uthor Man
uscr
ipt
A
uthor Man
uscr
ipt
PtNo. SMI (cm2/m2) Muscle area (cm2) Muscle attenuation (HU) Subcutaneous
fat area (cm2) Visceral fat area (cm2)
P-value* 0.11 0.05 0.81 0.07 0.02 Cancer stage Local 213 45.3 (10.6) 130.7 (32.9) 34.6 (9.5) 217.5 (113.3) 170.7 (110.9) Locally advanced 147 45.1 (9.9) 132.6 (35.6) 37.8 (10.3) 186.5 (103.3) 152.5 (99.6) Metastatic 279 45.3 (9.7) 131.6 (36.0) 35.9 (9.5) 190.5 (98.6) 155.6 (106.3) Unknown 48 43.5 (9.3) 126.9 (34.5) 35.2 (11.3) 241.0 (142.0) 176.0 (120.3) P-value* 1.00 0.87 0.01 0.02 0.28 Primary tumor location
Head/Uncinate 423 44.6 (10.2) 129.0 (33.8) 35.5 (10.1) 205.0 (110.7) 159.4 (105.6) Body 131 45.0 (9.0) 130.6 (32.5) 36.9 (9.2) 185.8 (94.4) 155.9 (104.3) Tail 78 46.5 (9.8) 137.0 (38.0) 34.5 (9.9) 213.9 (112.2) 177.9 (122.7)
P-value* 0.22 0.26 0.10 0.17 0.51 Body composition measurements reported as mean (standard deviation)
*
Two-sided P-values calculated using Wilcoxon rank-sum test
Abbreviations: SMI, skeletal muscle index; HU, Hounsfield unit; BMI, body mass index
Extended Data Table 3
Hazard ratios (95% CI) for death among pancreatic cancer cases by body composition measurements on computed tomography (a) stratified by cancer stage at diagnosis and (b) overall.
a.
Pt. No. Extreme Quintiles*& Per S.D.* P-interaction**
Visceral fat area (cm2) 0.59
Localized 213 2.02 (0.97–4.21) 1.15 (0.88–1.50) Locally advanced 147 0.53 (0.22–1.32) 0.81 (0.64–1.04) Metastatic 279 0.98 (0.54–1.76) 0.97 (0.80–1.17)
Subcutaneous fat area (cm2) 0.72
Localized 213 1.29 (0.58–2.87) 1.44 (1.05–1.98) Locally advanced 146 0.64 (0.26–1.60) 0.83 (0.68–1.00) Metastatic 279 0.99 (0.54–1.80) 0.91 (0.73–1.12) SMI (cm2/m2) 0.90 Localized 210 0.66 (0.30–1.46) 0.84 (0.64–1.12) Locally advanced 145 0.59 (0.27–1.29) 0.87 (0.70–1.08) Metastatic 277 1.54 (0.85–2.79) 1.05 (0.84–1.30) Muscle area (cm2) 0.47 Localized 213 0.82 (0.34–1.98) 0.86 (0.62–1.19) Locally advanced 147 0.40 (0.16–1.00) 0.81 (0.62–1.06) Metastatic 279 1.56 (0.77–3.18) 1.10 (0.82–1.45)
Muscle attenuation (HU) 0.49
Localized 210 0.32 (0.16–0.67) 0.74 (0.60–0.90) Locally advanced 147 0.99 (0.50–1.96) 0.94 (0.75–1.19)
A
uthor Man
uscr
ipt
A
uthor Man
uscr
ipt
A
uthor Man
uscr
ipt
A
uthor Man
uscr
ipt
a.
Pt. No. Extreme Quintiles*& Per S.D.* P-interaction**
Metastatic 275 1.01 (0.60–1.69) 0.96 (0.80–1.16)
b.
Quintiles of Body Composition Measurements@ P-trend$
1 2 3 4 5 SMI (cm2/m2) Median OS (mo.) 11.1 11.0 10.8 11.6 11.7 Hazard ratio (95% CI)*** 1.0 0.98 (0.76–1.27) 1.04 (0.80–1.36) 0.92 (0.70–1.19) 0.91 (0.68–1.21) 0.35 Hazard ratio (95% CI)**** 1.0 1.01 (0.78–1.31) 1.04 (0.79–1.37) 0.94 (0.71–1.24) 0.93 (0.68–1.27) 0.47 Muscle area (cm2) Median OS (mo.) 10.2 12.1 10.8 11.6 11.3 Hazard ratio (95% CI)*** 1.0 0.75 (0.58–0.98) 0.90 (0.69–1.17) 0.81 (0.62–1.05) 0.84 (0.63–1.12) 0.50 Hazard ratio (95% CI)**** 1.0 0.78 (0.60–1.02) 0.91 (0.69–1.20) 0.82 (0.62–1.10) 0.87 (0.64–1.20) 0.71
Muscle attenuation (HU)
Median OS (mo.) 10.2 11.2 10.8 12.7 11.7 Hazard ratio (95% CI)*** 1.0 0.89 (0.68–1.15) 0.92 (0.70–1.20) 0.75 (0.57–0.98) 0.87 (0.65–1.15) 0.16 Hazard ratio (95% CI)**** 1.0 0.86 (0.65–1.13) 0.89 (0.67–1.18) 0.71 (0.53–0.96) 0.80 (0.57–1.11) 0.10 *
Cox proportional hazards model adjusted for age at diagnosis (continuous), gender (male, female), race (white, non-white, unknown), year of diagnosis (2000–2005, 2006–2010, 2011–2015), institution (DF/BWCC, MGH, Mayo Clinic, Stanford University, UNC), BMI (continuous), diabetes history (none, ≤4yrs, >4yrs, unknown), and smoking status (never, past, current, unknown)
&
Comparing top and bottom quintile **
Two-sided P-interaction calculated by Wald test of cross-product between body component measurement (continuous) and stage (local, locally advanced, metastatic, unknown)
@
N=687 patients ***
Cox proportional hazards model adjusted for age at diagnosis (continuous), gender (male, female), race (white, non-white, unknown), year of diagnosis (2000–2005, 2006–2010, 2011–2015), institution (DF/BWCC, MGH, Mayo Clinic, Stanford University, UNC), and cancer stage (local, locally advanced, metastatic, unknown)
****
Cox proportional hazards model adjusted for age at diagnosis (continuous), gender (male, female), race (white, non-white, unknown), year of diagnosis (2000–2005, 2006–2010, 2011–2015), institution (DF/BWCC, MGH, Mayo Clinic, Stanford University, UNC), cancer stage (local, locally advanced, metastatic, unknown), BMI (continuous), diabetes history (none, ≤4yrs, >4yrs, unknown), and smoking status (never, past, current, unknown)
$
Two-sided P-trend values calculated by entering quintile-specific median value for body composition measurements as continuous variable in Cox proportional hazards model
Abbreviations: CI, confidence interval; S.D., standard deviation; SMI, skeletal muscle index; HU, Hounsfield unit; DF/ BWCC, Dana-Farber/Brigham and Women’s Cancer Center; MGH, Massachusetts General Hospital; UNC, University of North Carolina; BMI, body mass index
A
uthor Man
uscr
ipt
A
uthor Man
uscr
ipt
A
uthor Man
uscr
ipt
A
uthor Man
uscr
ipt
Extended Data Table 4
Plasma branched chain amino acid (BCAA) levels and clinical characteristics of pancreatic cancer cases.
Pt No. Total BCAAs (μM) Age, years < 60 220 351.6 (174.9) 60 – <70 271 327.7 (104.3) ≥ 70 287 297.7 (84.8) P-value* 1.3×10⁻⁶ Gender Male 432 346.1 (101.2) Female 346 295.0 (144.1) P-value* 3.4×10⁻¹⁸ Race White 696 322.2 (98.3) Non-White 45 290.6 (122.2) P-value* 0.10 Diabetes No diabetes 563 322.3 (129.0) Diabetes ≤4 years 99 330.9 (113.8) Diabetes >4 years 54 341.8 (122.7) P-value* 0.24 Body-mass index, kg/m2 <18.5 14 286.3 (120.4) 18.5–24.9 245 316.7 (168.0) >24.9–29.9 295 322.6 (91.5) >29.9–34.9 131 337.0 (111.7) >35 63 335.3 (99.0) P-value* 0.01 Current smoking No 661 323.0 (101.2) Yes 68 328.8 (291.0) P-value* 0.04 Cancer stage Local 256 306.6 (89.0) Locally advanced 155 321.1 (96.1) Metastatic 308 332.9 (110.0) Unknown 59 348.1 (283.8) P-value* 0.05
Primary tumor location
Head/Uncinate 479 311.7 (137.8) Body 141 336.4 (107.1)
A
uthor Man
uscr
ipt
A
uthor Man
uscr
ipt
A
uthor Man
uscr
ipt
A
uthor Man
uscr
ipt
Pt No. Total BCAAs (μM)
Tail 96 345.5 (70.1) P-value* 6.6×10⁻⁷
Plasma BCAA measurements reported as mean (standard deviation) *
Two-sided P-values calculated using Wilcoxon rank-sum test Abbreviations: BCAA, branched chain amino acids; μM, micromolar
A
uthor Man
uscr
ipt
A
uthor Man
uscr
ipt
A
uthor Man
uscr
ipt
A
uthor Man
uscr
ipt
Extended Data T
ab
le 5
Pearson correlation coef
ficients for BCAAs, body composition measurements, and patient characteristics
V ariable BMI Age at diagnosis V aline Leucine Isoleucine T otal BCAA SMI Muscle ar ea Muscle attenuation Subcutaneous fat ar ea V isceral fat ar ea BMI 1.00 −0.14 * 0.10 * 0.06 0.01 0.06 0.43 ** 0.38 ** −0.30 ** 0.74 ** 0.58 ** Age at diagnosis 1.00 −0.19 ** −0.17 ** −0.14 * −0.18 ** −0.29 ** −0.33 ** −0.32 ** −0.09 * 0.03 V aline 1.00 0.92 ** 0.78 ** 0.95 ** 0.22 ** 0.29 ** 0.18 ** 0.03 0.18 ** Leucine 1.00 0.91 ** 0.99 ** 0.17 ** 0.24 ** 0.17 ** −0.01 0.12 * Isoleucine 1.00 0.93 ** 0.10 * 0.14 * 0.13 * −0.01 0.07 T otal BCAA 1.00 0.17 ** 0.24 ** 0.17 ** 0.01 0.13 * SMI 1.00 0.84 ** 0.20 ** 0.15 * 0.37 ** Muscle area 1.00 0.23 ** 0.08 * 0.44 ** Muscle attenuation 1.00 −0.40 ** −0.34 ** Subcutaneous f at 1.00 0.43 ** V isceral f at 1.00 N=687 patients * T w o-sided P < 0.05 ** T w o-sided P < 0.0001 Abbre
viations: BCAA, branched chain amino acid; BMI, body mass inde
x; SMI, sk
eletal muscle inde
x
A
uthor Man
uscr
ipt
A
uthor Man
uscr
ipt
A
uthor Man
uscr
ipt
A
uthor Man
uscr
ipt
Extended Data Table 6
Hazard ratios (95% CI) for death among pancreatic cancer cases by plasma branched chain amino acids levels at diagnosis
Quartiles of Plasma Branched Chain Amino Acids P-trend*
1 2 3 4
Total BCAAs
Median (μM) 217.7 284.3 343.3 425.0 Range (μM) 72.9–255.7 255.8–312.8 312.9–374.3 374.5–2327.2 Median OS (mo.) 10.6 10.8 12.4 12.1
Hazard ratio (95% CI)** 1.00 0.95 (0.76–1.19) 0.79 (0.62–0.99) 0.81 (0.64–1.02) 0.04 Hazard ratio (95% CI)*** 1.00 0.96 (0.76–1.20) 0.78 (0.62–0.99) 0.82 (0.64–1.04) 0.06
Isoleucine
Median (μM) 43.0 54.9 66.1 86.0 Range (μM) 12.7–49.8 49.9–60.4 60.5–73.6 73.6–824.7 Median OS (mo.) 10.8 11.7 11.6 11.6
Hazard ratio (95% CI)** 1.0 0.89 (0.71–1.12) 0.93 (0.74–1.16) 0.89 (0.71–1.12) 0.42 Hazard ratio (95% CI)*** 1.0 0.89 (0.70–1.12) 0.90 (0.72–1.14) 0.90 (0.71–1.14) 0.49
Leucine
Median (μM) 73.6 99.9 121.8 152.5 Range (μM) 23.6–89.0 89.3–108.0 108.3–132.6 132.7–844.6 Median OS (mo.) 10.6 11.1 12.1 11.9
Hazard ratio (95% CI)** 1.0 0.91 (0.73–1.14) 0.81 (0.64–1.02) 0.82 (0.65–1.04) 0.08 Hazard ratio (95% CI)*** 1.0 0.93 (0.74–1.16) 0.82 (0.65–1.03) 0.84 (0.66–1.07) 0.12
Valine
Median (μM) 98.6 129.0 155.5 191.3 Range (μM) 35.4–114.0 114.2–141.9 142.0–171.3 171.4–658.0 Median OS (mo.) 9.9 11.5 12.4 12.1
Hazard ratio (95% CI)** 1.0 0.78 (0.62–0.99) 0.71 (0.56–0.90) 0.71 (0.56–0.91) 0.01 Hazard ratio (95% CI)*** 1.0 0.79 (0.62–1.00) 0.71 (0.56–0.90) 0.74 (0.57–0.94) 0.02 N=778 patients
*
Two-sided P-trend calculated by entering quartile-specific median value for individual plasma BCAAs as continuous variable in Cox proportional hazards model
**
Cox proportional hazards model adjusted for age at diagnosis (continuous), gender (male/female), race (white, non-white, unknown), year of diagnosis (2000–2005, 2006–2010, 2011–2015), institution (DF/BWCC, MGH, Mayo, Stanford, UNC), and cancer stage (local, locally advanced, metastatic, unknown)
***
Cox proportional hazards model additionally adjusted for BMI (continuous), diabetes history (none, ≤4yrs, >4yrs, unknown), and smoking status (never, past, current, unknown)
Abbreviations: CI, confidence interval; μM, micromolar; OS, overall survival; BCAAs, branched-chain amino acids; DF/ BWCC, Dana-Farber/Brigham and Women’s Cancer Center; MGH, Massachusetts General Hospital; UNC, University of North Carolina; BMI, body mass index
Supplementary Material
Refer to Web version on PubMed Central for supplementary material.
A
uthor Man
uscr
ipt
A
uthor Man
uscr
ipt
A
uthor Man
uscr
ipt
A
uthor Man
uscr
ipt
Acknowledgments
We thank members of the Vander Heiden and Wolpin labs for discussions and the Koch Institute Swanson Biotechnology Center, particularly the Animal Imaging and Preclinical Testing Facility, for technical assistance. Major funding for this work was provided by the Lustgarten Foundation to B.M.W. and M.G.V.H. L.V.D. was supported by NIH Ruth Kirschstein Fellowship (F32CA210421). A.B. was supported by P50CA127003 and the Robert T. and Judith B. Hale Fund for Pancreatic Cancer Research. A.M. was supported by F32CA213810. E.C.L. was supported by the Damon Runyon Cancer Research Foundation (DRG-2299-17). A.N.L. is a Robert Black Fellow of the Damon Runyon Cancer Research Foundation (DRG-2241-15). B.M.W was supported by Robert T. and Judith B. Hale Fund for Pancreatic Cancer Research, NIH/NCI (U01CA210171), Department of Defense (CA130288), Pancreatic Cancer Action Network, Noble Effort Fund, Peter R. Leavitt Family Fund, Wexler Family Fund, and Promises for Purple. M.G.V.H. was supported in part by a Faculty Scholar grant from the Howard Hughes Medical Institute, and acknowledges additional funding from SU2C, The Ludwig Center at MIT, the Koch Institute Frontier Awards, the MIT Center for Precision Cancer Medicine, and the NIH (R01CA168653,
P30CA14051).
References
1. Koppenol WH, Bounds PL, Dang CV. Otto Warburg’s contributions to current concepts of cancer metabolism. Nature reviews. Cancer. 2011; 11:325–337. DOI: 10.1038/nrc3038 [PubMed: 21508971]
2. Petruzzelli M, Wagner EF. Mechanisms of metabolic dysfunction in cancer-associated cachexia. Genes & development. 2016; 30:489–501. [PubMed: 26944676]
3. Dewys WD, et al. Prognostic effect of weight loss prior to chemotherapy in cancer patients. Eastern Cooperative Oncology Group. The American journal of medicine. 1980; 69:491–497. [PubMed: 7424938]
4. Mueller TC, Bachmann J, Prokopchuk O, Friess H, Martignoni ME. Molecular pathways leading to loss of skeletal muscle mass in cancer cachexia--can findings from animal models be translated to humans? BMC cancer. 2016; 16:75. [PubMed: 26856534]
5. Fearon K, Arends J, Baracos V. Understanding the mechanisms and treatment options in cancer cachexia. Nature Reviews Clinical Oncology. 2013; 10:90–99. DOI: 10.1038/nrclinonc.2012.209 6. Penna F, et al. Anti-cytokine strategies for the treatment of cancer-related anorexia and cachexia. Expert opinion on biological therapy. 2010; 10:1241–1250. DOI: 10.1517/14712598.2010.503773 [PubMed: 20594117]
7. Flint TR, et al. Tumor-Induced IL-6 Reprograms Host Metabolism to Suppress Anti-tumor Immunity. Cell metabolism. 2016; 24:672–684. DOI: 10.1016/j.cmet.2016.10.010 [PubMed: 27829137]
8. Hingorani SR, et al. Preinvasive and invasive ductal pancreatic cancer and its early detection in the mouse. Cancer cell. 2003; 4:437–450. [PubMed: 14706336]
9. Mayers JR, et al. Elevation of circulating branched-chain amino acids is an early event in human pancreatic adenocarcinoma development. Nature medicine. 2014; 20:1193–1198. DOI: 10.1038/nm. 3686
10. Agustsson T, et al. Mechanism of increased lipolysis in cancer cachexia. Cancer research. 2007; 67:5531–5537. DOI: 10.1158/0008-5472.CAN-06-4585 [PubMed: 17545636]
11. Michaelis KA, et al. Establishment and characterization of a novel murine model of pancreatic cancer cachexia. J Cachexia Sarcopenia Muscle. 2017
12. Ryden M, et al. Lipolysis--not inflammation, cell death, or lipogenesis--is involved in adipose tissue loss in cancer cachexia. Cancer. 2008; 113:1695–1704. DOI: 10.1002/cncr.23802 [PubMed: 18704987]
13. Shaw JH, Wolfe RR. Fatty acid and glycerol kinetics in septic patients and in patients with gastrointestinal cancer. The response to glucose infusion and parenteral feeding. Ann Surg. 1987; 205:368–376. [PubMed: 3105476]
14. Fearon K, et al. Definition and classification of cancer cachexia: an international consensus. The Lancet. Oncology. 2011; 12:489–495. DOI: 10.1016/s1470-2045(10)70218-7 [PubMed: 21296615]
A
uthor Man
uscr
ipt
A
uthor Man
uscr
ipt
A
uthor Man
uscr
ipt
A
uthor Man
uscr
ipt
15. Hwang RF, et al. Cancer-associated stromal fibroblasts promote pancreatic tumor progression. Cancer research. 2008; 68:918–926. DOI: 10.1158/0008-5472.can-07-5714 [PubMed: 18245495] 16. Herrington MK, Arnelo U, Permert J. On the role of islet amyloid polypeptide in glucose
intolerance and anorexia of pancreatic cancer. Pancreatology. 2001; 1:267–274. DOI: 10.1159/000055822 [PubMed: 12120206]
17. Martin L, et al. Cancer cachexia in the age of obesity: skeletal muscle depletion is a powerful prognostic factor, independent of body mass index. Journal of clinical oncology : official journal of the American Society of Clinical Oncology. 2013; 31:1539–1547. DOI: 10.1200/jco.2012.45.2722 [PubMed: 23530101]
18. Mourtzakis M, et al. A practical and precise approach to quantification of body composition in cancer patients using computed tomography images acquired during routine care. Applied physiology, nutrition, and metabolism = Physiologie appliquee, nutrition et metabolisme. 2008; 33:997–1006. DOI: 10.1139/h08-075
19. Choi Y, et al. Skeletal Muscle Depletion Predicts the Prognosis of Patients with Advanced Pancreatic Cancer Undergoing Palliative Chemotherapy, Independent of Body Mass Index. PLoS One. 2015; 10:e0139749. [PubMed: 26437072]
20. Prado CM, et al. Prevalence and clinical implications of sarcopenic obesity in patients with solid tumours of the respiratory and gastrointestinal tracts: a population-based study. The Lancet. Oncology. 2008; 9:629–635. DOI: 10.1016/s1470-2045(08)70153-0 [PubMed: 18539529] 21. Rollins KE, et al. The impact of sarcopenia and myosteatosis on outcomes of unresectable
pancreatic cancer or distal cholangiocarcinoma. Clinical nutrition (Edinburgh, Scotland). 2016; 35:1103–1109. DOI: 10.1016/j.clnu.2015.08.005
22. Tan BH, Birdsell LA, Martin L, Baracos VE, Fearon KC. Sarcopenia in an overweight or obese patient is an adverse prognostic factor in pancreatic cancer. Clinical cancer research : an official journal of the American Association for Cancer Research. 2009; 15:6973–6979. DOI:
10.1158/1078-0432.ccr-09-1525 [PubMed: 19887488]
23. Vujasinovic M, Valente R, Del Chiaro M, Permert J, Lohr JM. Pancreatic Exocrine Insufficiency in Pancreatic Cancer. Nutrients. 2017; 9
24. Lv M, Zhu X, Wang H, Wang F, Guan W. Roles of caloric restriction, ketogenic diet and intermittent fasting during initiation, progression and metastasis of cancer in animal models: a systematic review and meta-analysis. PloS one. 2014; 9:e115147. [PubMed: 25502434] 25. Laquente B, et al. Supportive care in pancreatic ductal adenocarcinoma. Clin Transl Oncol. 2017 26. Apte M. Isolation of Quiescent Pancreatic Stellate Cells from Rat and Human Pancreas.
Pancreapedia: Exocrine Pancreas Knowledge Base. 2011
27. Loftus SK, et al. Acinar cell apoptosis in Serpini2-deficient mice models pancreatic insufficiency. PLoS genetics. 2005; 1:e38. [PubMed: 16184191]
28. DiStefano MT, et al. The Lipid Droplet Protein Hypoxia-inducible Gene 2 Promotes Hepatic Triglyceride Deposition by Inhibiting Lipolysis. The Journal of biological chemistry. 2015; 290:15175–15184. DOI: 10.1074/jbc.M115.650184 [PubMed: 25922078]
29. Gabbi C, et al. Pancreatic exocrine insufficiency in LXRbeta−/− mice is associated with a reduction in aquaporin-1 expression. Proceedings of the National Academy of Sciences of the United States of America. 2008; 105:15052–15057. DOI: 10.1073/pnas.0808097105 [PubMed: 18806227]
30. Kraus D, Yang Q, Kahn BB. Lipid Extraction from Mouse Feces. Bio-protocol. 2015; 5 31. Yuan C, et al. Survival among patients with pancreatic cancer and long-standing or recent-onset
diabetes mellitus. Journal of clinical oncology : official journal of the American Society of Clinical Oncology. 2015; 33:29–35. [PubMed: 25403204]
32. Yuan C, et al. Prediagnostic body mass index and pancreatic cancer survival. Journal of clinical oncology : official journal of the American Society of Clinical Oncology. 2013; 31:4229–4234. DOI: 10.1200/jco.2013.51.7532 [PubMed: 24145341]
33. DerSimonian R, Laird N. Meta-analysis in clinical trials. Controlled clinical trials. 1986; 7:177– 188. [PubMed: 3802833]
A
uthor Man
uscr
ipt
A
uthor Man
uscr
ipt
A
uthor Man
uscr
ipt
A
uthor Man
uscr
ipt
Figure 1. Early PDAC is associated with peripheral tissue wasting
a–c. Tissue weights of end-stage control and KP−/−C mice (N= 9, 10 (males) and N= 9, 8
(females)). a. Epididymal AT (males) and inguinal subcutaneous AT weight (females) (P<1.25e-007). b. Gastrocnemius (GA) weight (P=.002 (males), P=.0003 (females)). c. Pancreas weight (P< 1.16e-005). d–f. Tissue weights of end-stage male control and KPC mice (N=5, 8). d. Epididymal AT weight (P=0.0003). e. GA weight (P=0.006). f. Pancreas weight (P=0.007). g–i. Peripheral tissue analysis during disease progression in control and KP−/−C male mice (5wks, N=7, 5; 6wks, N=8, 7; 8wks, N=8, 10; 10wks, N= 10, 9). g. Epididymal AT mass (2-way ANOVA; 6wks, P= 0.08; 8wks, P<0.0001; 10wks, P<0.0001).
h. GA weight (2-way ANOVA; 10wks, P=0.0007). i. Pancreas weight (2-way ANOVA;
6wks, P=0.07; 8wks, P<0.0001; 10wks, P<0.0001). j–l. Tissue weights of 15-week-old male control and KC mice (N=6). j. Epididymal AT weight (P=0.01). k. GA weight (P=0.01). l. Pancreas weight (P=.23). Unless otherwise indicated, statistical analysis was performed using unpaired two-sided t-test, data are mean ± SEM, and N represents number of mice analyzed.