HAL Id: hal-03188338
https://hal.archives-ouvertes.fr/hal-03188338
Submitted on 1 Apr 2021
HAL is a multi-disciplinary open access
archive for the deposit and dissemination of
sci-entific research documents, whether they are
pub-lished or not. The documents may come from
teaching and research institutions in France or
abroad, or from public or private research centers.
L’archive ouverte pluridisciplinaire HAL, est
destinée au dépôt et à la diffusion de documents
scientifiques de niveau recherche, publiés ou non,
émanant des établissements d’enseignement et de
recherche français ou étrangers, des laboratoires
publics ou privés.
Interpretation of the pressure-induced Raman frequency
shift of the ν 1 stretching bands of CH 4 and N 2 within
CH4-CO2 , N2-CO2 and CH4-N2 binary mixtures
Van-Hoan Le, Alexandre Tarantola, Marie-Camille Caumon
To cite this version:
Van-Hoan Le, Alexandre Tarantola, Marie-Camille Caumon. Interpretation of the pressure-induced
Raman frequency shift of the ν 1 stretching bands of CH 4 and N 2 within CH4-CO2 , N2-CO2 and
CH4-N2 binary mixtures. Physical Chemistry Chemical Physics, Royal Society of Chemistry, 2021,
�10.1039/d1cp00163a�. �hal-03188338�
Interpretation of the pressure-induced Raman frequency shift of
the
1stretching bands of CH
4and N
2within CH
4-CO
2, N
2-CO
2and
CH
4-N
2binary mixtures
Van-Hoan Le,*a Alexandre Tarantola a and Marie-Camille Caumon a
The relationships between the frequency shift of the 1 stretching bands of CH4 and N2 with pressure (or density) and composition has been previously provided in the literature as accurate empirical barometers and densimeters for the direct determination of the pressure or density of gas mixtures. However, the latter results still remain a pure description of the experimental data without any interpretation of the physical mechanisms hidden behind the variation trend of the observed peak position. The present paper is devoted to interpreting the origin of the pressure-induced vibrational frequency shifts of the 1 stretching bands of CH4 and N2 within CH4-CO2, N2-CO2 and CH4-N2 binary mixtures at the molecular scale. Two different theoretical models (i.e., the Lennard-Jones 6-12 potential approximation - LJ, and the generalized perturbed hard-sphere fluid - PHF) are used to intuitively and qualitatively assess the variation trend as well as the magnitude of the frequency shift of the CH4 and N2 1 bands for an in-depth understanding. Thereby, the contribution of the attractive and repulsive solvation-mean forces to the variation of the Raman frequency shift as a function of pressure and composition is assessed. A predictive model of the variation trend of the frequency shift of the CH4 1 band as a function of pressure (up to 3000 bars), density and composition within CH4-N2 and CH4-CO2 binary mixtures is then provided.
Keywords: Raman spectroscopy, frequency shift, intermolecular interaction, Lennard-Jones potential, Perturbed Hard-Sphere fluid model.
1 Introduction
Raman spectroscopy is a straightforward analytical tool to quickly identify the chemical nature of substances based on
their vibrational frequency fingerprints.1,2 The latter can be
slightly perturbed by the interaction of the molecule with its medium under the effect of pressure, density, temperature,
and/or composition,3 reflecting a small yet measurable and
reproducible shift from their original position measured at low density (pressure). Thus, interpretation and determination of the Raman frequency shifts may provide a direct proxy for investigating physicochemical and thermodynamic properties of fluids, including solute-solvent coupling mechanisms and
intermolecular interaction forces.4,5
Beside CO2, CH4 and N2 are among the most common
volatile species ubiquitous in various geological environments.6–
9 Their pressure-induced Raman frequency shift has been
intensively studied since the 1970s to develop barometers and
densimeters.10–13 Most studies investigated pure components
without fully considering the significant and systematic effect of
composition in the variation of the CH4 and N2 peak position,
which was however experimentally revealed in numerous
works.11,14,15 Recently, Le et al.16,17 presented a new calibration
data based on the variation of the band position of CH4 and N2
in pure gas systems, and binary and ternary mixtures of CH4
-CO2-N2. The wavelength shifts of the CH4 1 band were then
used as a reliable parameter for the development of accurate
barometer and densimeter. The measurement of the N2 band
peak position was however shown to be less reproducible than
that of CH4 due to its asymmetric shape at low pressure and the
overlapping with the signal of atmospheric nitrogen.16,17 Still,
the frequency shift of the N2 band was used to provide accurate
quantitative calibration data for CO2-CH4-N2 systems by Sublett
et al.18 The above-mentioned works were mainly dedicated to
providing accurate experimental calibration data of the Raman signal based on the variation of peak position for direct applications in the quantitative measurement of PVTX properties. Thus, the pressure-induced vibrational frequency
shift of CH4 and N2 bands was principally described rather than
interpreted from a chemical-physical point of view.
Lennard-Jones 6-12 potential approximation (LJ)19 and the
generalized perturbed hard-sphere fluid model (PHF)5,20 are
theoretical models describing the evolution of the repulsive and attractive intermolecular interaction forces that contribute to the resulting Raman frequency shift as a function of pressure, density and/or intermolecular distance. The PHF model was
successfully tested for studying the frequency shift of the 1
band of pure N2 and CH4 as a function of density and
temperature.21 The results showed a good correlation between
the predicted and experimental frequency shifts. It is to note
that Ben-Amotz et al.21 treated the attractive force-induced
frequency shift of the CH4 1 band as a linear density-dependent
one (according to the mean-field approximation of the van der
Walls equation of state5). However, more recent experimental
results suggested that the attractive force-induced frequency shift of the vibrational modes involving hydrogen bonds (e.g., O−H or C−H bonds) varies nonlinearly as a function of density
rather than linearly, especially at high density or pressure.20,22
Besides, a noticeable difference between the variation trend of
the 1 band of CH4 in CH4-N2 and CH4-CO2 mixtures was
observed 14,15,17 and so needs to be interpreted from a
chemical-physical point of view.
The present study aims to interpret the fundamental mechanism hidden behind the observed Raman frequency shift
of the CH4 and N2 1 bands and their variation trends as a
function of pressure, density and composition. The LJ model is firstly used to intuitively interpret the global variation trend of
ARTICLE
2 |
the pressure-induced frequency shift () of the CH4 and N2
bands in pure and binary mixtures of CH4-CO2-N2 without any
complex molecular dynamic simulation or ab-initio calculations. The variation of is therefore reasonably explained by attributing them to the variation of the LJ potential. For evaluating the contribution of the repulsive and attractive solvation mean-forces as a function of pressure, density and
composition (mol%), the net frequency shift of the CH4 1 band
is quantitatively decomposed into the repulsive and attractive
components using the PHF model (that of N2 band is not studied
herein due to the lack of accurate experimental data within binary mixtures). For that, the non-linearity of the attractive
force-induced frequency shift of the CH4 1 band is evaluated.
New attractive coefficient parameters (Ca, Ba) required upon the
application of the PHF model are then provided by fitting our experimental data. Afterwards, the predictive model of the
variation trends of the CH4 1 band position within CH4-N2 and
CH4-CO2 mixtures over 5-3000 bars is provided.
2 Experimental data
Experimental data of the pressure-induce frequency shift of
CH4 and N2 1 bands within pure or binary mixtures of CH4-CO2
-N2 can be found in literature, e.g., for low pressure range (0-600
bars)14–17 and high pressure range (up to 3000 bars)11. The
global variation trend of the CH4 and N2 1 bands with the
change of pressure, density and composition revealed by all data sets shows a good agreement. Herein, we are interested in
the relative variation of the fitted peak position of the 1
stretching band of CH4 and N2 (), which is the difference
between the fitted peak position recorded at a given pressure and near-zero pressure (5 bars), so-called hereafter as “frequency shift”. Due to the use of a low spectral resolution
(5 cm−1), the data points of Seitz et al.14,15 are very scattered
and even indistinguishable. Thus, the peak position at near-zero pressure cannot be accurately determined. The experimental
data of Seitz et al. 14,15 are therefore not used in this study. The
experimental data of Sublett et al.18 were also not considered in
this study because they are only reported for ternary mixtures.
It is to note that the variation trends of the CH4 and N2 bands
within binary and ternary mixtures are different, and the
frequency shift of CH4 and N2 within ternary mixtures varies
non-systematically with composition variation.17,18 In this study,
the selected data are thus from the works of Le et al. 16,17 (for
the pressure between 5-600 bars) and from Fabre and
Oksengorn 11 (for pressure up to 3000 bars in CH4-N2 mixtures).
The experimental protocol of the measurements over 5-600
bars is described in Le et al.16,17 Briefly, binary gas mixtures of
any composition are prepared from pure CH4, CO2 and N2 gases
(99.99% Air LiquidTM) by a commercial mixer (GasMix
AlytechTM), then compressed by a home-made pressurization
system and stored in a stainless steel tanker at 130 bars. The composition of the obtained gas mixtures, before being loaded
in an improved High-Pressure Optical Cell system (HPOC) 23,24, is
checked by gas chromatography with an uncertainty of about ± 0.3 mol%. The HPOC system serves as a chamber sample, whose one end is equipped with a manual screw pump for pressure
adjustment, and the other end is connected to a sealed transparent microcapillary placed on a Linkam CAP500 heating-cooling stage for temperature control. The temperature is maintained at 22.0 ± 0.1 °C. The internal pressure is monitored by two pressure-transducers (±1 bar). Pressure-to-density
conversion is done by REFPROP software25 using default options
of equation of states (EoS), i.e., Setzmann and Wagner26 and
Span et al.27 for pure CH4 and N2, and GERG-2008 28 for gas
mixtures. Raman spectra are collected with a LabRAM HR spectrometer (Horiba Jobin-Yvon) equipped with a
liquid-nitrogen cooling CCD detector, a 514.532 nm Ar+ laser (Stabilite
2017, Spectra-Physics), a ×20 Olympus objective (NA = 0.4) and
a 1800 groovemm−1 grating. The confocal hole and the slit are
set at 1000 and 200 µm, respectively, yielding a spectral
resolution of about 1.6 cm−1. The laser power at the sample is
30 mW. At any given PTX condition, each Raman measurement (with 10 accumulations) is repeated at least six times for statistical purpose. Accumulation time is between 2 and 15s depending on pressure. The uncertainty of the measured
frequency shift is about 0.02 cm−1. The Raman spectra are fitted
with Labspec6 software (Horiba), after baseline correction,
using asymmetric Gaussian-Lorentzian function (for N2 band)
and symmetric Gaussian-Lorentzian function (for CH4 band). To
minimize the day-to-day spontaneous deviation arising from
the instrumental response 17,18,29, the whole analysis series of a
specific mixture must be continuously performed and done within the same experimental section.
On the other hand, the calibration data of Fabre and
Oksengorn 11 were performed at room temperature only for
pure CH4, N2 and a commercial gas mixture of CH4-N2 (55/45 ±
3 mol%, respectively) for pressures up to 3000 bars. Raman spectra were collected using a 488 nm Ar-ion laser. The spectral
resolution was about 0.8 cm−1. The experimental protocol and
other spectral parameters (objective, grating, confocal hole and slit size, etc.) were not detailed.
3 Background theory
3.1 The Lennard-Jones (LJ) potential approximation.
The Lennard-Jones 6-12 potential (ULJ) approximation
describes the evolution of the repulsive and attractive potentials experienced between two molecules as a function of
their intermolecular distance r.19 The general mathematic form
of ULJ is expressed by Eq. 1, where the parameters and r have
the dimension of a length (Å), and the attraction parameter
and ULJ are expressed in joule (J).
𝐔𝐋𝐉= 𝟒 (( 𝐫) 𝟏𝟐 − ( 𝐫) 𝟔 ) (1)
Figure 1 represents the relative variation of ULJ as a function
of the distance between two identical molecules of CH4. For a
pair of non-identical molecules, ULJ can be estimated from
parameters ij and ij determined using Lorentz-Berthelot
combining rules (Eq. 2 and 3). LJ parameters of CH4, N2 and CO2
ARTICLE | 3 3 4 5 6 7 8 9 10 11 12 13 -250 -200 -150 -100 -50 0 50 100 150 200 250 LJ Pote nti al Ener gy / 10 −23 J Intermolecular distance r / Å 2 LJ 6 1 σ U r = σ r -4ε 12 4 σ r ε 6 σ -4ε r r0 r =
Figure 1: Lennard-Jones 6-12 potential between two CH4 molecules
as a function of intermolecular distance r.
ij=
i+ j
2 (2)
ij= √ij (3)
Table 1: LJ parameters between two identical or non-identical
molecules of CH4, N2 and CO2. kB is Boltzmann constant (J/K)
Molecular pair (Å) /kB (K) CH4-CH4 3.733 149.9 N2-N2 3.745 95.2 CO2-CO2 3.713 257.8 CH4-N2 3.739 119.5 CH4-CO2 3.723 196.6
The net ULJ can be decomposed into repulsive and attractive
components (cf. Eq. 1 and Figure 1). In general, at very low pressure (low density) where the intermolecular distance r is large enough (> 9Å), there is no interaction between molecules. As pressure increases, the distance between molecules is reduced, and so molecules begin to interact with each other with more frequent collisions and steric restrictions. At long distance-range, the attractive force dominates and produces a significant effect, whereas the repulsive forces are negligible.
The net ULJ reaches its minimum value at the intermolecular
distance r0 = 1.1224. At r = , the repulsive force completely
compensates the attractive force, i.e., the net ULJ equals zero.
For small intermolecular distances, the repulsive force dominates the interactions (Figure 1).
Since CH4, N2 and CO2 are all non-polar molecules, the
effects of the electrostatic and the polarization potential energy on the actual potential energies within the binary systems may be negligible (Coulomb’s law). In other words, the intermolecular interactions experienced between these molecular pairs chiefly consist of repulsive and attractive forces. The LJ potential approximation could therefore be used to reasonably interpret the overall fashion of the variation trend of the pressure-induced frequency shifts of the mentioned gaseous systems. The variation of the intermolecular interaction impacts the vibrational mode of gaseous molecules
by different phenomena such as lengthening or shortening of bond length or perturbing electron cloud distribution, and so resulting in polarizability changes. In general, the attractive forces expand the geometry and so the bond length of molecules, implying that less energy is required to stretch the
bonds4,32,33 which result in a redshift. On the contrary, the
repulsive force producing more significant effect at short distance range tend to contract the geometry of molecules, and so the bond length. The observed vibration mode requires
therefore more energy, which in turn leads to a blueshift.4,32,33
3.2 Perturbed hard-sphere fluid model
Based on the theoretical model developed by Buckingham4,
the relationship between vibrational frequency shifts (Δ) and medium-induced intermolecular forces experienced along the
bond is represented by Eq. 4, 32,34 where
0 is the unperturbed
vibrational frequency measured at low density; f and g are the harmonic and anharmonic force constants of an isolated diatomic solute (Eq. 5); F and G are the linear and quadratic coefficients in an expansion of the solvent potential of
mean-force as a function of solute bond length (Eq. 6); and 𝑓1() and
𝑓2() are the modified Morse coefficients for anharmonic
vibration. 35,36,34 Δ 0𝑓F[− (3𝑔2𝑓) 𝑓1() + (GF) 𝑓2()] (4) U0(r12) = 1 2𝑓(𝑟12− 𝑟e) 2+1 2𝑔(𝑟12− re) 3+ ⋯ (5) Vmean−force= F(r12− re) + G(r12− re)2+ ⋯ (6)
The net frequency shift Δ can be decomposed into the
repulsive (ΔR) and attractive (ΔA) contributions, which are
induced by repulsive and attractive solvation-mean forces, respectively (Eq. 7). The centrifugal forces only show a noticeable effect at ultrahigh pressure (e.g., 158 kbar in study
of Devendorf et al. 37). It is therefore negligeable in this study.
Δ = ΔR+ ΔA (7)
The repulsive contribution (ΔR) can be accurately
calculated from PHF model parameters.5,20,21,32 All required
hard-sphere parameters of solute CH4 and solvent (CH4, N2 and
CO2) are reported in Table 2. The detailed calculation process
can be found in Ben-Amotz et al. 1993.20
On the other hand, the attractive contribution (ΔA) within
diatomic or pseudoatomic molecules is assumed to be
proportional to the attractive force (FA) acting along the
vibrational bond.5 Since F
A varies relatively slowly, Chandler and
co-workers assumed that the attractive contribution (ΔA)
varies linearly with the solvent density, i.e., ΔA= Ca (where
Ca is an empirical coefficient fitted from experimental data).
This assumption had shown a good agreement in various
solvent-solute systems.5,32,21 Recently published experimental
data however showed that ΔA may rather vary as a quadratic
function of density (i.e., ΔA= Ba2+ Ca) 36,20,38–41,
especially for hydrogen stretching vibrations (e.g., C−H, O−H).
The parameters Ca and Ba can also be empirically fitted from
experimental data. Once these adjustment parameters are
determined, the attractive frequency shift ΔA can be
Table 2: Hard-sphere fluid parameters of solute (CH4) and solvent (CH4, N2, and CO2) 21. bond 0 (cm−1) re (Å) 1 (Å) 2 (Å) sCH4 (Å) sN2 (Å) sCO2 (Å) f (dyne/Å) g (dyne/Å2) C-H 2917 1.091 2.22 3.53 3.58 3.45 4.00 0.005049 -0.01047
0 : Raman peak position of CH4 1 band at near-zero pressure. re : bond length of CH4 1 band at equilibria.
1 and 2 : pseudo-diatomic hard-sphere diameters of CH4 solute. s : hard-sphere diameters of solvent.
f, g : harmonic and anharmonic force constants of isolated CH4 solute molecule, respectively.
It should be kept in mind that the frequency shift of the CH4
1 band changes not only with different solvents but also
gradually changes as a function of the molar fraction
(composition).14–18 Thus, Ca and Ba are also expected to be
composition dependent. In this study, both assumptions (linear
and quadratic density-dependence of ΔA) will be examined for
the case of CH4 (1 stretching band) dissolved in different
solvents (pure CH4, CH4-N2 and CH4-CO2 mixtures). The
adjustable parameters Ca and Ba are then provided by fitting
selected experimental data.
4 Results and discussion
4.1 Pressure-induced frequency shift of N2 and CH4 bands
The variation of the peak position of the 1 stretching bands
of N2 (within the CH4-N2 and CO2-N2 mixtures) and CH4 (within
the CH4-N2 and CH4-CO2 mixtures) as a function of pressure and
composition was previously reported in the literature11,14–17 and
selectively plotted in Figure 2 and Figure 3.
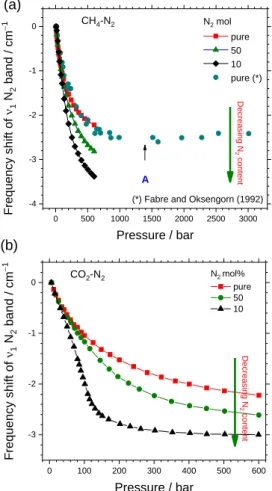
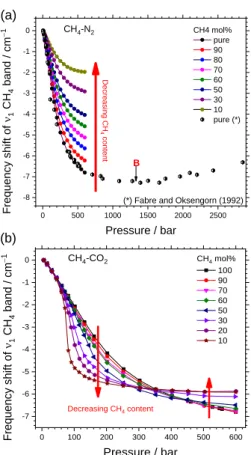
Briefly, both N2 and CH4 bands shift toward lower
wavenumbers as pressure (density) increases. The composition effect is very small at low pressure and becomes more pronounced at high pressure. As evidence, the curves converge to a point at near-zero pressure (low density) and span out as pressure increases (Figure 2 and Figure 3a), except over the
pressure range 300 - 400 bars in the case of CH4-CO2 mixtures
(Figure 3b). The magnitude of the frequency shift of N2 in CH4
-N2 and CO2-N2 mixtures gradually increases with decreasing N2
concentration (Figure 2), whereas that of CH4 band in the CH4
-N2 mixtures decreases with decreasing CH4 concentration
(Figure 3a). The difference between the propensity of the
frequency shift of CH4 in CH4-N2 mixtures and that in CH4-CO2
mixtures can be observed in Figure 3. Indeed, the magnitude of
the frequency shift of CH4 within CH4-CO2 mixtures may
increase or decrease as CH4 concentration decreases,
depending on the pressure-range.
0 500 1000 1500 2000 2500 3000 -4 -3 -2 -1 0 0 100 200 300 400 500 600 -3 -2 -1 0 CO2-N2 Freq ue nc y s hift of 1 N 2 ban d / cm −1 Pressure / bar N2 mol% pure 50 10 De crea sin g N 2 con ten t
(*) Fabre and Oksengorn (1992)
(b) (a) CH4-N2 Freq ue nc y sh ift of 1 N 2 ban d / cm −1 Pressure / bar N2 mol pure 50 10 pure (*) De crea sin g N 2 con ten t A
Figure 2: Frequency shift of the 1 stretching band of N2 measured
at 22 °C as a function of pressure and composition in (a) CH4-N2 and
(b) CO2-N2 mixtures. Experimental data are from Le et al. 17 (up to
600 bars) and Fabre et Oksengorn 11 (up to 3000 bars). The frequency
shift of the 1 band of pure N2 reaches the minimal value within the
pressure range 1200 - 1600 bars. Inflection point A is located using LJ potential approximation (see text in section 4.2).
ARTICLE | 5 0 500 1000 1500 2000 2500 -8 -7 -6 -5 -4 -3 -2 -1 0 (a) 0 100 200 300 400 500 600 -7 -6 -5 -4 -3 -2 -1 0 CH4-CO2 Freq ue nc y s hift of 1 CH 4 ban d / cm −1 Pressure / bar CH4 mol% 100 90 70 60 50 30 20 10 Decreasing CH4 content CH4 mol% pure 90 80 70 60 50 30 10 pure (*) Freq ue nc y sh ift of 1 CH 4 ban d / cm −1 Pressure / bar CH4-N2 De crea sin g C H 4 con ten t B (b)
(*) Fabre and Oksengorn (1992)
Figure 3: Frequency shift of the 1 stretching band of CH4 measured
at 22 °C as a function and pressure and composition in (a) CH4-N2 and
(b) CH4-CO2 mixtures. Experimental data are from Le et al. 17 (up to
600 bars) and Fabre et Oksengorn 11 (up to 3000 bars). The frequency
shift of the 1 band of pure CH4 reaches the minimal value within the
pressure range 1200 - 1700 bars. Inflection point B is located using LJ potential approximation (see text in section 4.2).
4.2 Interpretation of the frequency shift based on the Lennard-Jones potential approximation: effect of pressure (density)
Figure 4a presents the variation of intermolecular distance r
as a function of pressure of pure CH4 and different mixtures with
N2 or CO2 over 5-600 bars. Overall, the curves plotted in Figure
4a show a close affinity with the relative order and the curvature change as a function of composition of the frequency shift-pressure curves plotted in Figure 2 and Figure 3. The
intermolecular distance at any pressure decreases from pure N2
to pure CH4 then pure CO2, which is in good agreement with the
overall variation trends of the magnitude of the frequency shift
of the N2 and CH4 bands as composition varies, i.e., the
magnitude of the frequency shift of the N2 band always
decreases when it is mixed with either CH4 or CO2 (Figure 2),
whereas that of the CH4 band decreases when it is mixed with
N2 or increases when it is mixed with CO2 (over 1-400 bars)
(Figure 3). The above observation are in good agreement with
the interpretation of Sublett et al.18 where the variation of
molar density as a function of pressure and composition is discussed. The curvature of the frequency shift calibration
curves of CH4 and N2 bands within CH4-N2 mixtures
progressively changes with the change of CH4 or N2 content
(Figure 2 and Figure 3a). Regarding CO2-N2 and CH4-CO2
mixtures dominated by CO2 (for example CH4-CO2 mixture of 90
mol% CO2), the intermolecular distance drastically decreases at
around 80-150 bars then slowly decreases with further pressure increase. These variation trends reasonably mirror the significant decrease, then followed by a stepwise-like behavior
of the curve of the CH4-CO2 mixture of 90 mol% CO2 as observed
in Figure 3b. Similar variation is observed for the curve of the
CO2-N2 mixture of 90 mol% CO2 Figure 2b). The similarity
described above is thus an evidence of the intrinsic correlation between the observed Raman frequency shifts and the intermolecular distance change, as well as the variation of intermolecular interactions. Thus, the LJ potential may be used to practically interpret the observed pressure-induced Raman frequency shift. 3 4 5 6 7 8 9 10 11 -400 -350 -300 -250 -200 -150 -100 -50 0 50 100 0 100 200 300 400 500 600 4 5 6 7 8 9 10 pure N2 30 mol% CH4 50 mol% CH4 80 mol% CH4 Pure CH4 80 mol% CH4 50 mol% CH4 30 mol% CH4 10 mol% CH4 pure CO2 Inter molecul ar distance r / Å Pressure / bar CH 4 −CO 2 CH 4 −N 2 (a) 7 6543 1 2 7 A 5 6 4 2 3 1 B7 65 4 3 2 LJ Poten tial Ene rgy / 10 −23 J Intermolecular distance r / Å LJ potential between: CH4 - CH4 N2 - N2 CO2 - CO2 CH4 - N2 CH4 - CO2 1 1 : 50 bars 5 : 400 bars 2 : 100 bars 6 : 500 bars 3 : 200 bars 7 : 600 bars 4 : 300 bars (b)
Figure 4: (a) Variation of the intermolecular distance r (Å) as a function of pressure of pure CH4 and in mixtures with CO2 or N2. The
intermolecular distance r between CH4 and/or N2 molecules was calculated by the cube root of the density. Pressure-to-density conversion
is done by REFPROP software. (b) Variation of Lennard-Jones 6-12 potential experienced between a pair of identical molecules of CH4, N2 and
CO2 (solid lines) or a pair of non-identical molecules, i.e., CH4-N2 or CH4-CO2 (dotted-lines). The points A ( 1400 bars) and B ( 1300 bars) are
Figure 4b shows how ULJ between a pair of two (identical or
non-identical) molecules of CH4, N2, and CO2 varies as a function
of intermolecular distance r and pressure (represented by solid
points denoted 1 to 7). The ULJ becomes more and more
negative with increasing pressure, implying a domination by
attraction forces, so resulting in a continuous downshift of CH4
and N2 bands. With a further increase of pressure, the
intermolecular distance reaches the value 𝑟 = 𝑟0 where the ULJ
of N2 and CH4 are minimal, marked by points A and B at 1400
and 1300 bars, respectively (density-to-pressure conversion is done by REFPROP program). At these points, the effect of the repulsive potential to frequency shift balances that induced by attractive potential. Correspondingly, an inflection is observed on the experimental frequency shift-pressure curves at around
1200-1600 bars for pure N2 and 1200-1700 bars for pure CH4
(Figure 2 and Figure 3a), e.g., pressure ranges where points A
and B marked in Figure 4b are found. Afterward, the CH4 and N2
bands undergo a blueshift as the onset of the important contribution of repulsive potential.
The downshift magnitude of the CH4 band is more significant
than that of N2 at any pressure and composition (e.g., −6.8
and −2.1 cm−1 at 600 bars, respectively, cf. Figure 2 and Figure
3). It can be directly explained by the fact that the derivative of the polarizability of vibrational coordinate (d/dQ) for the C−H
bond within CH4 molecules is much larger than that of the N−N
bond within N2 molecules (e.g., 2.08 in CH4 > 0.66 in N2,42). The
magnitude of ULJ potentials shown in Figure 4b also reasonably
reflects the relative difference between the downshift
magnitude of CH4 and N2 bands within pure systems or CH4-N2
mixtures.
However, the LJ 6-12 potential approximation could not
interpret quantitatively the downshift magnitude of the CH4
band in CH4-CO2 mixtures. For instance, over 350-600 bars (cf.
points 5, 6, and 7 in Figure 4b), the ULJ between CH4 molecules
in pure CH4 is much smaller than that between molecules in
CH4-CO2 mixtures, but the frequency shift magnitude of the CH4
band within pure CH4 is always larger than that within CH4-CO2
mixtures (Figure 3b). It is noteworthy that the LJ potential approximation only describes the variation between two molecules, whereas the Raman frequency shift of the observed vibration mode chiefly arises from the perturbation caused by its medium (i.e., all surrounding molecules). Therefore, the effective effect of the composition change could not fully be taken into account by the LJ potential approximation. Moreover, the effect of the perturbation also strongly depends
on the geometrical configuration between molecules 43, and so
on the mixture composition (Figure 2 and Figure 3). Thus, to quantitatively appraise the pressure-induced frequency shift with composition, the solvation mean-forces acting along the vibration bond of the analyzed molecules must be considered using a more appropriate model such as the perturbed
hard-sphere fluid model (PHF). Since the calibration data of the N2 1
band within binary mixtures is less reproducible (with no
systematic variation with composition)16,17, in the following, the
PHF model is only used to accurately determine the contribution of repulsive and attractive mean-forces to the
observed frequency shift of the CH4 band as a function of
pressure (density) and composition.
4.3 Decomposition of the observed pressure-induced frequency shift into attractive and repulsive components
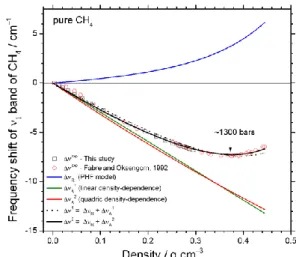
Figure 5 represents the repulsive and attractive
force-induced frequency shifts (ΔR and ΔA, respectively) and the
net frequency shift (Δ = ΔR+ ΔA) of the CH4 1 band as a
function of density within a pure CH4 gas system. ΔR (blue solid
line) was determined using the PHF model, whereas ΔA was
fitted from experimental data by the two following
assumptions: (i) linear (green solid line, ΔA1) or (ii) quadratic
(red solid line, ΔA2) equation function of density. The intercept
of the regression equations was set to 0 at the lowest density
value. Thereby, the net predicted frequency shift Δ1 and Δ2
are correspondingly the products of ΔR with ΔA1 or ΔA2,
presented in Figure 5 by black solid-curve or dashed solid-curve, respectively. The experimental data of the net frequency shift
(Δexp) over 5 - 3000 bars are also presented in Figure 5.
Figure 5: Variation of the frequency shift of the 1 band of CH4
measured at 22 °C as a function of density. Experimental data (exp)
performed at 5-3000 bars are from literature 11,17. The repulsive
force-induced frequency shift (R) was calculated using the PHF
model. The attractive force-induced frequency shift (A1 and A2)
were fitted from experimental data by a linear or quadratic function,
respectively. The net predicted frequency shift (1 and 2) is the
sum of the R and A1 or A2.
Comparing between the linear and quadratic regressions,
the resulting Δ1 and Δ2 are in good agreement at low-density
range (< 0.4 gcm−3), then it starts to slightly deviate at higher
density range (Figure 5). The Δexp confirmed that the
quadratic function describes slightly more accurately the
density dependence of ΔA than the linear one. It is to note that
the small discrepancy between the fitted curves of the linear and quadratic attractive frequency shift models can be improved by adjusting the approximated effective diameters of
the solute molecule (1 and 2) by about 10-20%. In this study,
the quadratic function is then used to fit our experimental data
of CH4-N2 and CH4-CO2 binary mixtures. All resulting parameters
Ca and Ba are listed in Table 3. The adjusted-R2 of the
ARTICLE
| 7
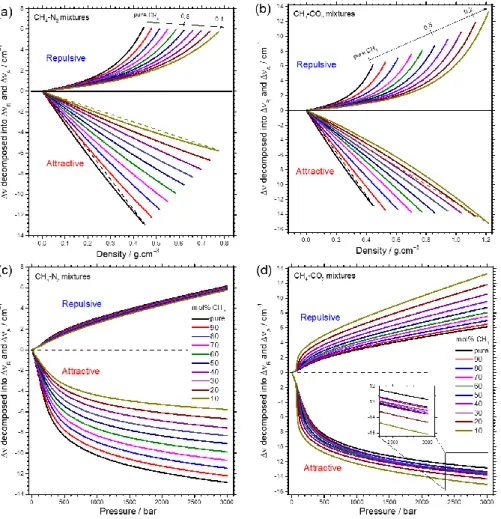
Figure 6: Variation of repulsive and attractive components (R and A) decomposed from the net frequency shift of the 1 band
of CH4 as a function of composition of CH4-N2 and CH4-CO2 binary mixtures and density (a, b) or pressure (c, d). Dashed straight
lines in Figures a and b are guides for eye for curvature evaluation.
Table 3: ΔA attractive force parameters of the CH4 band within
CH4-N2 and CH4-CO2 binary mixtures, with ΔA= Ba2+ Ca.
mol% CH4 CH4-N2 mixtures CH4-CO2 mixtures
Ba Ca Ba Ca 100 8.633 -32.660 8.633 -32.660 90 6.824 -28.686 1.945 -26.473 80 5.257 -24.946 1.928 -23.019 70 4.856 -22.106 -0.904 -18.888 60 4.335 -19.413 -1.420 -16.637 50 3.873 -16.987 -1.136 -15.100 40 2.828 -14.468 -0.662 -13.739 30 1.793 -12.904 -1.361 -11.944 20 2.121 -10.645 -2.147 -10.254 10 2.337 -9.275 -3.370 -8.405
The variation of R and A components decomposed from
the net of the CH4 1 band as a function of density and
composition of CH4-N2 and CH4-CO2 mixtures are presented in
Figure 6a and b. Both R and A change gradually with the
variation of density and composition as expected. The value of
A is always greater than R at any given density-composition
condition, which is in good agreement with the resulting redshift observed in Figure 3. Over the studied density range,
the highest value of R within CH4-N2 mixtures only shows a
subtle change from +6.2 to +5.8 cm−1, whereas that in CH4-CO2
mixtures steadily increases from +6.2 to +13.3 cm−1 as the
content of CH4 decreases. An inverse variation trend is observed
for the absolute value of the attractive component |ΔA|, with
a progressive decrease in the CH4-N2 mixtures (from about
−12.9 to −5.8 cm−1) but a slight increase in the CH4-CO2 mixtures
(from about −12.9 to −15.1 cm−1) as the CH4 content decreases.
The curvature of ΔA-density curves systematically changes
from positive (for CH4-N2 mixtures dominated by N2) to negative
(for CH4-CO2 mixtures dominated by CO2) fashion (cf. Figure 6a
and b, and coefficient Ba in Table 3). The degree of the nonlinear
density dependence of ΔA likely depends on the critical
temperatures (Tc) of the analyzed mixtures. Indeed Tc of pure
N2, CH4 and CO2 are −146.5, −82.6 and 31.05 °C, respectively
(cited form NIST Chemistry webbook44). Consequently, the Tc of
CH4-N2 mixtures, which varies between −146.5 and −82.6 °C
depending on mixture composition, is far lower than room
temperature. Thereby, CH4-N2 mixtures are always in
ARTICLE
8 |
On the other hand, the Tc of CH4-CO2 mixtures, which ranges
from −82.6 to 31.05 °C as a function of composition, can be closer to the temperature of analysis at 22 °C.
The deviation of the density-dependence of A from the
linear variation trend could also be ascribed to the aggregation of “non-identical” molecules. Indeed, the uniform molecular distribution may cause less attractive force than the
non-uniform one.40 When compared with the diameter of a CH4
molecule (3.8 Å), the diameter of a N2 molecule (3.65 Å) is rather
similar, whereas that of CO2 molecule is significantly smaller
(3.3 Å). As a result, the nonlinearity of the density-dependence
of A in CH4-N2 mixtures is less noticeable than that observed
for CH4-CO2 mixtures (Figure 6a and b).
The origin of the difference on the variation trend of the
frequency shift of CH4 1 band reported in Figure 3a and b can
be better understood by evaluating the variation of R and A
components represented in pressure scale (Figure 6c and d).
Regarding CH4-N2 mixtures, R is likely unchanged, whereas
ΔA significantly and progressively changes with composition.
This indicates that the attractive solvation mean-forces is the
predominant contribution to the variation trend of the CH4
band position as a function of pressure and composition within
CH4-N2 mixtures (Figure 6c). On the contrary, the change of A
as a function of pressure and composition is quite small in the
case of CH4-CO2 mixtures compared to that of the repulsive one
(Figure 6d). Thus, the variation of the CH4 band position is
chiefly governed by the change of R as well as of the repulsive
solvation mean-force. Inversely to the variation trend of R
observed in CH4-N2 mixtures, R in CH4-CO2 mixtures increases
drastically as CH4 content decreases, indicating that the
contribution of the solvation mean-force at near-critical temperature becomes somewhat significant.
4.4 Predictive model of the variation trends of the 1 CH4 band
The net predicted frequency shift = R + A (where R
and A are reported in Figure 6) is plotted in Figure 7 as a
function of composition and density or pressure, along with
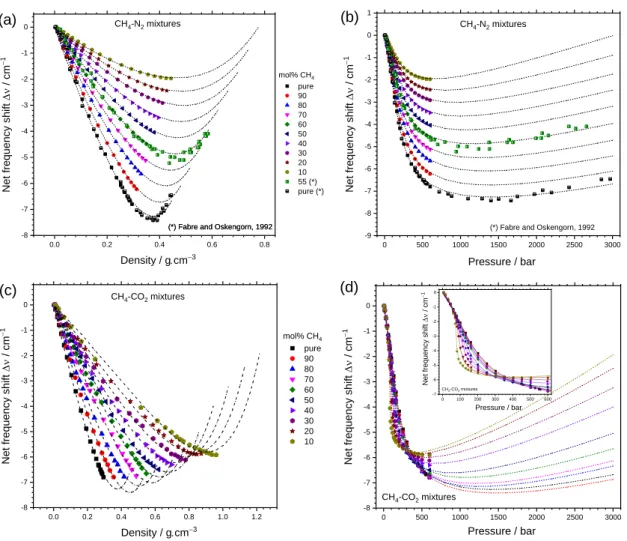
experimental data.11,17 Regarding the CH4-N2 mixtures, the
predicted frequency shift curves show a good agreement with experimental data. A slight dispersion is observed for the
experimental data of CH4-N2 mixture of 55 mol% CH4 from Fabre
et Oksengorn 11. Indeed, the latter seems to be superimposed
to the experimental data of the CH4-N2 mixture of 60 mol% CH4
(Figure 7a). This could partially be explained by the uncertainty
of the mixture composition (55 3 and 60 0.5 mol% CH4) and
the error of the measured frequency shift ( 0.3 and 0.02 cm−1
reported in the two studies 11,17, respectively).
Regarding the CH4-CO2 mixtures, the predicted model also
shows a good agreement with most experimental data (Figure 7c and d). However, a deviation becomes more appreciable for
the mixtures dominated by CO2. The experimental data of the
mixtures containing 40 mol% CH4 start to deviate from the
associated predicted curve at high-density range, i.e., near the inflection point of the predicted curves (Figure 7c). A significant discrepancy between experimental data points and the
predicted curve is observed for CH4-CO2 mixtures of 10 mol%
CH4 at low ( 0.1 - 0.4 gcm−3) and high (> 0.9 gcm−3) density
ranges, which can be partially ascribed to the inaccuracy of EoS at near critical point, and to the error arising from the quadratic regression due to the blank region (lacking data points)
corresponding to the vapor-liquid transition of CH4-CO2
0 500 1000 1500 2000 2500 3000 -9 -8 -7 -6 -5 -4 -3 -2 -1 0 1
(b)
CH 4-N2 mixtures Ne t freque nc y s hift / cm −1 Pressure / bar(*) Fabre and Oskengorn, 1992
0.0 0.2 0.4 0.6 0.8 -8 -7 -6 -5 -4 -3 -2 -1 0
(*) Fabre and Oskengorn, 1992
(a)
CH4-N2 mixtures Ne t freque nc y s hift / cm −1 Density / g.cm−3 mol% CH4 pure 90 80 70 60 50 40 30 20 10 55 (*) pure (*)(*) Fabre and Oskengorn, 1992
0.0 0.2 0.4 0.6 0.8 1.0 1.2 -8 -7 -6 -5 -4 -3 -2 -1 0
(c)
Ne t freque nc y s hift / cm −1 Density / g.cm−3 mol% CH4 pure 90 80 70 60 50 40 30 20 10 CH4-CO2 mixtures 0 500 1000 1500 2000 2500 3000 -8 -7 -6 -5 -4 -3 -2 -1 0 0 100 200 300 400 500 600 -7 -6 -5 -4 -3 -2 -1 0(d)
Ne t freque nc y s hift / cm −1 Pressure / bar CH4-CO2 mixtures Ne t freque nc y shift / cm −1 Pressure / bar CH4-CO2 mixturesFigure 7: Variation of the net predicted frequency shift () of the CH4 1 band (at 22 °C) as a function of composition and density
(a, c) or pressure (b, d) within CH4-N2 and CH4-CO2 mixtures. The predicted frequency shift is represented by dashed lines. The
experimental data from Le et al. 17 and Fabre and Oksengorn 11 are represented by symbols.
Talking about the uncertainty of the predictive model, the
hard-sphere diameters of solvent (s) are the most sensitive
parameter in the PHF model which are calculated with an
uncertainty of about ± 2%.34 This corresponds to a fluctuation
of about 0.1 cm−1 on the predicted frequency shift value. There
are also other possible sources of inaccuracy not quantified yet such as the uncertainty of the attractive parameters and the error due to extrapolation to a wider pressure-range where no
experimental data exist. Indeed, A were fitted from
experimental data by a quadratic density-dependence, but not a linear one. Most of the experimental data used herein were obtained at 600 bars. Thus, extrapolation to 3000 bars from the best-fitted quadratic function could obviously cause more or less deviation in the predicted curves, depending on its
curvature. Thereby, the predictive model of CH4-CO2 mixtures is
expected to have a larger error than that of CH4-N2 mixtures
because the non-linearity of the A density-dependence within
CH4-CO2 mixtures is more important than within CH4-N2
mixtures (see text above and Figure 6a and b). Also, an irregular distance between the fitted curves (cf. Figure 6d) and an
inversion of the order of the predicted curves with composition
of 100% and 90% CH4 (cf. Figure 7d) indicate that the predictive
model of CH4-CO2 mixtures still contains an appreciable error at
high pressure, which should not be negligible upon quantitative measurements requiring high precision. Thus, further experimental data at elevated pressure range are still needed to refine and obtain higher accurate predictive models,
especially for the CH4-CO2 mixtures dominated by CO2. Overall,
the predictive model of the frequency shift presented in this study can still hold and could be used to reasonably predict the
variation trend of the CH4 1 band within binary mixtures.
Conclusions
The variation of the peak position of the 1 stretching band
of CH4 and N2 within different non-polar solutions (i.e., pure
CH4, pure N2, and binary mixtures of CH4 with CO2 or N2), where
attraction and repulsion are the major intermolecular interaction forces, was intuitively interpreted based on the basic of the Lennard-Jones 6-12 potential approximation,
ARTICLE
10 |
without any complex ab-initio calculations or molecular dynamics simulations. Thereby, the redshift and blueshift of the
CH4 and N2 1 band as varying pressure (density) were
reasonably attributed to the contribution of the variation of attractive and repulsive forces, simply as a function of intermolecular distance r. The experimental results reported in this study surprisingly showed a very close affinity between the variation trend of the Raman peak position and the variation of the net LJ potential, especially the superposition of inflection points A and B observed on LJ potential curves and Raman frequency shifts curves upon an isotherm increase of pressure or density. This is the evidence of the intrinsic correlation of the Raman peak position variation and the intermolecular interaction change. The LJ potential approximation could also practically point out the difference in the length scale of the
intermolecular interaction forces exercising within CH4-N2 and
CH4-CO2 gas mixtures, i.e., the molecules within CH4-N2
mixtures experience longer distance-range forces than that
within CH4-CO2 mixtures at a given pressure at 22 °C, even
though in both cases the attractive forces always dominate the net intermolecular forces, resulting in a redshift over the studied pressure range.
The shortcoming of the LJ 6-12 potential approximation in
the interpretation of Raman frequency shift of the CH4 1 band
as a function of composition (i.e., the molar proportion of solute and solvent) is completed by using the generalized PHF model.
It was successfully applied to CH4-N2 and CH4-CO2 binary
mixtures of any molar fraction to quantitatively investigate the solute-solvent interactions. The observed frequency shift of the
CH4 1 band could therefore be decomposed into attractive and
repulsive components, which are induced by the attractive and repulsive solvation mean-forces, respectively. The predicted
model of the variation trend of the CH4 1 band position within
CH4-N2 and CH4-CO2 mixtures could also be provided over 5 -
3000 bars. Moreover, the experimental and predicted data over a wide composition-range revealed some interesting information. The change in the solvation-induced attractive component is responsible for the change of frequency shift of
the CH4 1 band in CH4-N2 mixtures (Figure 6c), whereas that in
CH4-CO2 mixtures is governed by the change of the
solvation-induced repulsive component (Figure 6d). Also, the slight non-linear density dependence of the frequency shift of the C-H
bond of CH4 was evaluated and confirmed. It was clearly shown
that the frequency shift of the same type of bond (herein C−H
in CH4 molecules) strongly depends on solvent parameters as
well as the composition of the solution. Overall, the study conducted herein illustrates the practicality and reliability of Raman spectroscopy for investigating thermodynamic and intermolecular behavior of gaseous molecule systems at the molecular scale, which could be an alternative way to directly and quickly determine or estimate intermolecular forces,
relative bond length changes,39 and other quantitative
measurements as shown in previous works such as physical properties of gas mixtures with a good accuracy (after a specific
calibration of the Raman signal) , e.g., PVTX properties 16–18,45,
fugacity and fugacity coefficients 18,46.
Conflicts of interest
There are no conflicts to declareAcknowledgements
The authors acknowledge the French Ministry of Education and Research and the ICEEL Institut Carnot. The work benefited of financial support from CNRS-INSU CESSUR program. Two anonymous reviewers are thanked for their thorough and constructive reviews.
Notes and references
1 D. A. Long, The Raman Effect : A Unified Treatment of the Theory of Raman Scattering by Molecules, 2002.
2 P. Rostron and D. Gerber, Raman Spectroscopy, a review, International Journal of Engineering and Technical Research, 2016, 6, 50–64.
3 G. Placzek, Rayleigh-Streuung und Raman-Effekt, Akad. Verlag-Ges., 1934, vol. 2.
4 A. D. Buckingham, A theory of frequency, intensity and band-width changes due to solvents in infra-red spectroscopy, Proc. R. Soc. Lond. A, 1960, 255, 32–39.
5 K. S. Schweizer and D. Chandler, Vibrational dephasing and frequency shifts of polyatomic molecules in solution, The Journal of chemical physics, 1982, 76, 2296–2314.
6 J. Mullis, The system methane-water as a geological thermometer and barometer from the external part of the Central Alps, Bull Minéral, 1979, 102, 526–536.
7 E. Roedder, Fluid Inclusions. Reviews in Mineralogy, Mineral. Soc. Am., 1984, 12, 644.
8 J. Mullis, J. Dubessy, B. Poty and J. O’Neil, Fluid regimes during late stages of a continental collision: Physical, chemical, and stable isotope measurements of fluid inclusions in fissure quartz from a geotraverse through the Central Alps, Switzerland, Geochim Cosmochim Acta., 1994, 58, 2239–2267.
9 A. Tarantola, J. Mullis, T. Vennemann, J. Dubessy and C. de Capitani, Oxidation of methane at the CH4/H2O–(CO2) transition zone in the external part of the Central Alps, Switzerland: Evidence from stable isotope investigations, Chem. Geol., 2007,
237, 329–357.
10 C. H. Wang and R. B. Wright, Effect of density on the Raman scattering of molecular fluids. I. A detailed study of the scattering polarization, intensity, frequency shift, and spectral shape in
gaseous N 2, J. Chem. Phys., 1973, 59, 1706–1712.
11 D. Fabre and B. Oksengorn, Pressure and Density Dependence of the CH4 and N2 Raman Lines in an Equimolar CH4/N2 Gas Mixture, Appl. Spectrosc., AS, 1992, 46, 468–471.
12 V. Thieu, S. Subramanian, S. O. Colgate and E. D. Sloan, High-Pressure Optical Cell for Hydrate Measurements Using Raman Spectroscopy, Annals of the New York Academy of Sciences, 2000,
912, 983–992.
13 Lin, R. J. Bodnar and S. P. Becker, Experimental determination of the Raman CH4 symmetric stretching (ν1) band position from 1– 650bar and 0.3–22°C: Application to fluid inclusion studies, Geochim Cosmochim Acta., 2007, 71, 3746–3756.
14 J. C. Seitz, J. D. Pasteris and I.-M. Chou, Raman spectroscopic characterization of gas mixtures; I, Quantitative composition and pressure determination of CH 4, N 2 and their mixtures, Am. J. Sci., 1993, 293, 297–321.
ARTICLE
| 11 15 J. C. Seitz, J. D. Pasteris and I.-M. Chou, Raman spectroscopic
characterization of gas mixtures. II. Quantitative composition and pressure determination of the CO2-CH4 system, Am. J. Sci., 1996,
296, 577–600.
16 V.-H. Le, M.-C. Caumon, A. Tarantola, A. Randi, P. Robert and J. Mullis, Quantitative Measurements of Composition, Pressure, and Density of Microvolumes of CO2–N2 Gas Mixtures by Raman Spectroscopy, Anal. Chem., 2019, 91, 14359–14367.
17 V.-H. Le, M.-C. Caumon, A. Tarantola, A. Randi, P. Robert and J. Mullis, Calibration data for simultaneous determination of P-V-X properties of binary and ternary CO2 - CH4 - N2 gas mixtures by Raman spectroscopy over 5–600 bar: Application to natural fluid inclusions, Chemical Geology, 2020, 552, 119783.
18 D. M. Sublett, E. Sendula, H. M. Lamadrid, M. Steele‐MacInnis, G. Spiekermann and R. J. Bodnar, Raman spectral behavior of N2, CO2, and CH4 in N2–CO2–CH4 gas mixtures from 22°C to 200°C and 10 to 500 bars, with application to other gas mixtures, Journal of Raman Spectroscopy, , DOI:https://doi.org/10.1002/jrs.6033.
19 J. E. Jones and S. Chapman, On the determination of molecular fields. —II. From the equation of state of a gas, Proceedings of the Royal Society of London. Series A, Containing Papers of a Mathematical and Physical Character, 1924, 106, 463–477. 20 D. Ben-Amotz and D. R. Herschbach, Hard fluid model for
solvent-induced shifts in molecular vibrational frequencies, J. phys. chem. (1952), 1993, 97, 2295–2306.
21 D. Ben-Amotz, F. LaPlant, D. Shea, J. Gardecki and D. List, in Supercritical Fluid Technology, American Chemical Society, 1992, vol. 488, pp. 18–30.
22 E. J. Hutchinson and D. Ben-Amotz, Molecular Force Measurement in Liquids and Solids Using Vibrational Spectroscopy, J. Phys. Chem. B, 1998, 102, 3354–3362.
23 I.-M. Chou, R. C. Burruss and W. Lu, in Advances in High-Pressure Technology for Geophysical Applications, eds. J. Chen, Y. Wang, T. S. Duffy, G. Shen and L. F. Dobrzhinetskaya, Elsevier, Amsterdam, 2005, pp. 475–485.
24 M.-C. Caumon, P. Robert, E. Laverret, A. Tarantola, A. Randi, J. Pironon, J. Dubessy and J.-P. Girard, Determination of methane content in NaCl–H2O fluid inclusions by Raman spectroscopy. Calibration and application to the external part of the Central Alps (Switzerland), Chem. Geol., 2014, 378, 52–61.
25 E. W. Lemmon, M. L. Huber and M. O. McLinden, NIST Standard Reference Database 23: Reference Fluid Thermodynamic and Transport Properties-REFPROP, Version 9.1, National Institute of Standards and Technology, Standard Reference Data Program, Gaithersburg.
26 U. Setzmann and W. Wagner, A New Equation of State and Tables of Thermodynamic Properties for Methane Covering the Range from the Melting Line to 625 K at Pressures up to 100 MPa, Journal of Physical and Chemical Reference Data, 1991, 20, 1061– 1155.
27 R. Span, E. W. Lemmon, R. T. Jacobsen, W. Wagner and A. Yokozeki, A Reference Equation of State for the Thermodynamic Properties of Nitrogen for Temperatures from 63.151 to 1000 K and Pressures to 2200 MPa, Journal of Physical and Chemical Reference Data, 2000, 29, 1361–1433.
28 O. Kunz and W. Wagner, The GERG-2008 Wide-Range Equation of State for Natural Gases and Other Mixtures: An Expansion of GERG-2004, J. Chem. Eng. Data, 2012, 57, 3032–3091.
29 H. M. Lamadrid, L. R. Moore, D. Moncada, J. D. Rimstidt, R. C. Burruss and R. J. Bodnar, Reassessment of the Raman CO2 densimeter, Chem. Geol., 2017, 450, 210–222.
30 D. Möller, J. Óprzynski, A. Müller and J. Fischer, Prediction of thermodynamic properties of fluid mixtures by molecular dynamics simulations: methane-ethane, Molecular Physics, 1992,
75, 363–378.
31 J. O. Hirschfelder, C. F. Curtiss and R. B. Bird, Molecular theory of gases and liquids, 1964, vol. 165.
32 M. R. Zakin and D. R. Herschbach, Vibrational frequency shifts induced by molecular compression of pyridine in solution, J. Chem. Phys., 1986, 85, 2376–2383.
33 Lin, A. K. Sum and R. J. Bodnar, Correlation of methane Raman ν1 band position with fluid density and interactions at the molecular level, Journal of Raman Spectroscopy, 2007, 38, 1510–1515. 34 D. Ben‐Amotz, M. Lee, S. Y. Cho and D. J. List, Solvent and
pressure‐induced perturbations of the vibrational potential surface of acetonitrile, J. Chem. Phys., 1992, 96, 8781–8792. 35 F. G. Dijkman and J. H. van der Maas, Inhomogeneous broadening
of Morse oscillators in liquids, J. Chem. Phys., 1977, 66, 3871– 3878.
36 M. R. Zakin and D. R. Herschbach, Density dependence of attractive forces for hydrogen stretching vibrations of molecules in compressed liquids, The Journal of Chemical Physics, 1988, 89, 2380–2387.
37 G. S. Devendorf and D. Ben-Amotz, Vibrational frequency shifts of fluid nitrogen up to ultrahigh temperatures and pressures, The Journal of Physical Chemistry, 1993, 97, 2307–2313.
38 M. Lee and D. Ben‐Amotz, Pressure induced vibrational frequency shifts of ethane and methyliodide. Evidence for the formation of C–H hydrogen bonds in high density fluids, J. Chem. Phys., 1993, 99, 10074–10077.
39 Y. Meléndez-Pagán and D. Ben-Amotz, Intermolecular Forces and Bond Length Changes in High-Pressure Fluids. Vibrational Spectroscopic Measurement and Generalized Perturbed Hard Fluid Analysis, J. Phys. Chem. B, 2000, 104, 7858–7866.
40 K. Saitow, H. Nakayama, K. Ishii and K. Nishikawa, Attractive and Repulsive Intermolecular Interactions of a Polar Molecule: Short-Range Structure of Neat Supercritical CHF3 Investigated by Raman Spectroscopy, J. Phys. Chem. A, 2004, 108, 5770–5784. 41 D. Kajiya and K. Saitow, Investigation of attractive and repulsive
interactions associated with ketones in supercritical CO2, based on Raman spectroscopy and theoretical calculations, J. Chem. Phys., 2013, 139, 054509.
42 W. F. Murphy, W. Holzer and H. J. Bernstein, OSA | Gas Phase
Raman Intensities: A Review of “Pre-Laser” Data,
https://www.osapublishing.org/as/abstract.cfm?uri=as-23-3-211, (accessed June 25, 2018).
43 R. Hellmann, E. Bich, E. Vogel and V. Vesovic, Intermolecular potential energy surface and thermophysical properties of the CH4–N2 system, J. Chem. Phys., 2014, 141, 224301.
44 A. Kramida, Y. Ralchenko, J. Reader and NIST ASD Team, NIST Atomic Spectra Database (version 5.6.1), 2018.
45 D. M. Sublett, E. Sendula, H. Lamadrid, M. Steele‐MacInnis, G. Spiekermann, R. C. Burruss and R. J. Bodnar, Shift in the Raman symmetric stretching band of N2, CO2, and CH4 as a function of temperature, pressure, and density, Journal of Raman Spectroscopy, 2020, 51, 555–568.
46 H. M. Lamadrid, M. Steele-Macinnis and R. Bodnar, Relationship between Raman spectral features and fugacity in mixtures of gases, J. Raman Spectrosc., , DOI:10.1002/jrs.5304.