OATAO is an open access repository that collects the work of Toulouse
researchers and makes it freely available over the web where possible
Any correspondence concerning this service should be sent
to the repository administrator:
[email protected]
This is an author’s version published in: http://oatao.univ-toulouse.fr/25374
To cite this version:
Vitola Pasetto, Leticia
and Simon, Valérie
and Richard, Romain
and
Pic, Jean-Stéphane and Violleau, Frédéric
and Manero, Marie-Hélène
A
catalyst-free process for gas ozonation of reduced sulfur compounds. ( In
Press: 2019) Chemical Engineering Journal. 123416. ISSN 1385-8947
Official URL : https://doi.org/10.1016/j.cej.2019.123416
A catalyst-free process for gas ozonation of reduced sulfur compounds
Leticia Vitola Pasetto
a,b, Valérie Simon
b, Romain Richard
a, Jean-Stéphane Pic
c,
Frédéric Violleau
b, Marie-Hélène Manero
a,⁎aLaboratoire de Génie Chimique, Université de Toulouse, CNRS, INPT, UPS, Toulouse, France bLaboratoire de Chimie Agro-industrielle, LCA, Université de Toulouse, INRA, Toulouse, France cTBI, Université de Toulouse, CNRS, INRA, INSA, Toulouse, France
H I G H L I G H T S
•
Feasibility of gas ozonation of RSCs was investigated for industrial appli-cation.•
Whereas H2S was removed up to 80%,MES and DMDS were weakly removed by ozone.
•
SIFT/MS was used to measure RSCs concentrations and to calculate their removals.•
Primary products generation of RSCs-ozone reaction were determined by SIFT/MS.G R A P H I C A L A B S T R A C T
A B S T R A C T
The feasibility of homogenous gas ozonation process was investigated in order to reduce the negative en-vironmental impact caused by reduced sulfur compounds (RSCs). Emitted from a variety of industrial plants, this class of compounds are known by their odor properties. Selecting hydrogen sulfide (H2S), methyl ethyl sulfide
(MES) and dimethyl disulfide (DMDS) as representative odorous RSCs, the influence of four gas ozonation process parameters (ozone concentration, humidity level, reactor temperature and residence time) on their re-moval efficiencies was evaluated using a Doehlert experimental design in an experimental domain compatible with industrial constraints. Ozone concentration was the only process parameter that has resulted in a positive – but limited – effect on the removal efficiency of the mix of RSCs. However, even if ozone was present in large excess (20 times the RSCs concentration), MES and DMDS were slightly consumed (around 30%). Only H2S has
shown interesting removal efficiencies (up to 80%). In addition to the measurement of reagent concentrations, Selected Ion Flow Tube coupled with Mass Spectrometry (SIFT/MS) was applied to identify and quantify the potential products of RSCs-ozone reaction. Methyl ethyl sulfone (MESO2) was found to be the primary product of
MES, whereas methyl methanethiosulfinate (DMSOS) and sulfur dioxide (SO2) for DMDS, suggesting that the
organic monosulfide and disulfides would not follow the same reaction mechanism with ozone in gas phase. In addition, SO2and H2O may not be the only end products for H2S ozonation, since additional peaks were detected
in SIFT/MS spectra.
⁎Corresponding author at: Université de Toulouse / IUT GCGP, Laboratoire de Génie Chimique 4 Allée Emile Monso, BP84234, 31 432 Toulouse Cedex 4, France.
E-mail address:[email protected](M.-H. Manero).
1. Introduction
Usually associated to odor nuisance and to potential health effect, reduced sulfur compounds (RSCs) are one of major concern in air pol-lution[1,2]. Defined by the presence of sulfur in a reduced state (oxi-dation number at −2 and −1), RSCs are composed by several classes of organosulfur compounds – such as mercaptans (thiols), sulfides and disulfides – which are usually characterized by their strong odor even at low concentrations (at ppbv level)[1]. In addition, they are air pollu-tants found in a variety of emission sources known as odor sensitive sites, such as pulp-and-paper and fertilizer industrial plants, wastewater treatment, agriculture, pig production and livestock facilities[1,3,4].
In an industrial context, the reduction of the negative impact caused by odor compounds is mostly performed by wet scrubbers, regenerative thermal oxidation and biofiltration[4–8], by which RSCs are converted to oxides, sulfoxides or sulfones that are expected to present higher values of odor threshold limits (ODT)[4]. Even if high removal effi-ciencies can be achieved from these classical techniques, some draw-backs still remain, such as high operating temperatures, high chemicals demand and low flexibility regarding the operating conditions[4,5,9]. In addition, biofilter devices have shown low removal efficiency for some examples of RSCs, in particular dimethyl sulfide (DMS) and di-methyl disulfide (DMDS) [5,9]. Oxidative gas treatments based on photolysis, catalysis or photocatalysis and homogenous ozonation techniques have emerged as potential alternatives to this context
[4,9–13]. In this study, we were especially interested in a catalyst-free homogenous ozonation technique, since it requires a simpler set-up configuration, operation at ambient or reduced temperature and it has been successfully applied at the industrial scale for controlling nitrogen oxides[14–17]. In the case of RSCs, only few studies were focused on ozone oxidation treatment, even though, interesting results have been reported for the ozonation of hydrogen sulfide (H2S), methyl mer-captan, DMS and DMDS[10,17,18].
The investigation of RSCs-ozone gas phase reaction has been mainly conducted in order to understand phenomena in lower and upper atmo-spheres, involving operating conditions distinct from those applied in an industrial gas treatment[19–21]. In the case of H2S, contradictory values were found for the reaction rate constant with ozone in the gas phase, varying by 4 orders of magnitude (from 1 × 10⁻²⁰cm3molecule−1s−1
[20,22–24]to 6 × 10⁻¹⁶cm3molecule−1s−1[21,25]), which may be the consequence of the different experimental techniques and operating con-ditions applied in these studies (simulating tropospheric or stratospheric conditions, for example). The reaction mechanism proposed for H2S-O3 reaction has also been a subject of disagreement: Hales et al[26]have suggested that sulfur dioxide (SO2) and H2O were the main products whereas Glavas and Toby[25]have found that oxygen (O2) was the most abundant product in comparison with SO2, H2O and H2S (produced from the SH%+ SH%reaction). More recent studies based on molecular model-ling have concluded that SO2+ H2O generation was the most thermo-dynamically important pathway (with the most negative value of Gibbs free energy) at temperatures up to 730 °C, whereas at higher temperatures, O2, thioperoxol (HSOH) and radicals, such as HOSO%, SH%, HO3%and OH% become also important[23,24]. In the case of sulfur-containing organic compounds, the rate constants of gas phase reaction with ozone are ex-pected to be about 10−19to 10−20cm3molecule−1s−1, considered as a slow reaction in atmosphere[27,28]. Concerning the reactional mechanism between sulfur-containing organics and ozone, most of studies have been focused on reactions in the liquid phase, in which sulfides are firstly oxi-dized to sulfoxides and then to sulfones. In an analogous way, disulfides are oxidized to thiosulfinate, thiosulfonate or disulfoxide, and then to disulfone
[27,29–31]. The generation of sulfonic anhydride was reported by Barnard
[30]and by Douglass[31]. The only few studies that have investigated the reaction between sulfides and ozone in the gas phase were carried out at low pressure conditions (~1 kPa)[32,33]. Martinez and Herron[32] sug-gested a different mechanism from the sequential oxidation reported in the liquid phase, in which the O3attack on DMS would follow a chain reaction
that involves carbon-sulfur bond scission, generating SO2as one of by-products. In their studies of gas reaction between ozone and several RSCs (H2S, methyl mercaptan, DMS and DMDS) in a beam-gas apparatus, Glinski and Dixon[33]have reported the generation of SO2(evidenced by che-miluminescence from electronically excited SO2). In a more recent study, Kastner et al[4]have also reported SO2as one primary product for cata-lytic gas ozonation of H2S and methyl mercaptan at room conditions, whereas dimethyl sulfoxide (DMSO) and dimethyl sulfone (DMSO2) were identified as primary products of DMS oxidation.
In this work, the feasibility of RSCs homogenous gas ozonation as an odor treatment process was investigated in an industrial emission context, characterized by a short residence time (up to a few seconds
[9]) and a complex gas mixture[34–36]. The influence of four process parameters (ozone concentration, humidity level, reactor temperature and residence time) on the removal efficiency of a multipollutant gas stream by ozone oxidation was evaluated using a Doehlert experimental design. Selecting H2S, methyl ethyl sulfide (MES) and dimethyl dis-ulfide (DMDS) as representative RSCs, their primary products were investigated thanks to the use of selected ion flow tube mass spectro-metry (SIFT/MS) as the online analytical device.
2. Materials and methods 2.1. Chemicals
H2S, MES and DMDS have been selected as the representative RSCs due to their low ODT (0.1 ppbv for H2S, 7 ppbv for MES and 0.3 ppbv for DMDS[34]). In addition, each compound represents a class of RSCs: inorganic sulfide, organic (mono)sulfide and organic disulfide, respec-tively. Primary standards contained in a single gas cylinder were pur-chased from Air Liquide, France (Crystal® gas mixture designed on re-quest, containing 80 ppmv of H2S; 300 ppmv of MES and 800 ppmv of DMDS in 99.88% molar of N2with uncertainty at 25%).
2.2. Ozonation set-up
The gas phase reaction was performed in a continuous flow, using a jacketed glass tubular reactor (250 mL) (Fig. 1). The reactor was kept at atmospheric pressure during all experiments (101.3 kPa). The gas temperature at the reactor inlet and outlet were constantly monitored (PT100 temperature sensors).
Dry air (oil-free air ISO 8573-1 class 0, dew point equal to −40 °C at 101.3 kPa) generated by an air compressor (ZR55, Atlas Copco France) equipped with an air filter (Olympian Plus, Norgren, UK) was fed to a humidification system (Serv’Instrumentation, France), in which the moisture level was controlled by a humidity and temperature trans-mitter (HMT333, Vaisala, Finland). The RSCs multipollutant mixture from the gas cylinder was injected into the dilution air stream before the reactor inlet, which gas flows were controlled by mass flowmeters (SLA 5850S-B Brooks Instruments, USA). Ozone was generated by a plasma discharge ozone generator (HTU500 AZCO Industries Limited, Canada) fed with oxygen (99.999%, Linde Gas, France). Depending on the power regulator of the ozone generator, ozone concentration could vary from 2300 ppmv to 4800 ppmv (for a fixed inlet oxygen flow of 500 NmL min−1in the ozone generator). Before feeding the reactor, the ozone-oxygen stream was controlled by a mass flowmeter (SLA 5850S-B Brooks Instruments, USA).
In order to study the reaction at higher temperatures (up to 60 °C), the dilution air stream was sent to a heating stage, composed by a stainless steel smooth-coil immersed in a synthetic thermoliquid bath (Ultra 350, Lauda, Germany). In addition, the reactor was heated (from 20 °C to 60 °C) using the synthetic thermoliquid with a heated circu-lating oil bath (Model 1160S, VWR, USA). All gas lines (from the hu-midification system until the analytical device) were isolated and he-ated to prevent condensation inside the PTFE lines (orange hatched area inFig. 1).
Ozone concentrations were measured by an UV analyzer (BMT 964, BMT MESSTECHNIK GMBH, Germany) directly after its production and also by SIFT/MS (Voice 200ultra, Syft Technologies Ltd, New Zealand) at the reactor outlet. The RSCs concentrations were measured by SIFT/ MS installed directly at the reactor outlet in an online system. Therefore, the inlet RSCs concentrations ([RSCs]in) were measured without any presence of ozone whereas the outlet RSCs concentrations ([RSCs]out) were measured in the presence of ozone.
2.3. SIFT/MS analysis
In SIFT/MS, the quantification of an analyte (neutral compound) is based on the soft ionization reaction of the analyte with a precursor ion in a region with fixed conditions (called flow tube), generating product ions at a specific mass-to-charge ratio (m/z), which are quantified by a quadrupole mass spectrometer. A range of positive ions (H3O+, NO+, O2+) is available for the quantification of most organic compounds and five negative ions (NO2−, NO3−, O2−, HO−, O−) for the quantification of compounds that are not ionized by the positive ions, such as ozone, SO2 and SO3. The principle of the SIFT/MS device has been deeper explained previously [37]. In a summarized form, the analyte con-centration ([A]samplein ppmv) is calculated by Eq.(1)involving the rate coefficient (kI in cm3molecule−1s−1) of the reaction between the neutral compound and the precursor ion and the ratio between product ion count rate (P in cps) and precursor ion count rate (I in cps)[38]. The factor γ depends on the operating conditions of the flow tube, re-action time and on the carrier gas and sample flows[38], which was around 1.4 × 10⁻⁷s molecule cm−3 during the experiments. The re-quired parameters for quantification of the four reagents (H2S, MES, DMDS and O3) by SIFT/MS are shown inTable 1. The limit of detection (LOD) obtained by SIFT/MS was 20 pptv for H2S, 60 pptv for MES, 200 pptv for DMDS and 45 ppbv for O3(based on the expression re-ported in Francis et al, 2009[39]and a measurement time of 100 s).
=
[A] P
I k
sample
I (1)
2.4. Doehlert experimental design
Besides the common advantages of a multivariate experimental design (such as process optimization and evaluation of the most im-pacting parameters and their positive or negative interaction), a Doehlert design has been chosen for its high efficiency (experimental
design with the fewest number of experiments needed). It can easily optimize the system and describe a non-linear interaction because of its second-order fitting model; it is also an adaptable design, due to the possibility of moving through the experimental domain[40].
Aiming a better understanding of the process, three different oper-ating conditions have been studied as factors: (1) humidity level ex-pressed in water concentration ([H2O]), (2) inlet ozone concentration ([O3]in) and (3) reactor temperature (Treactor). The effect of the re-sidence time in the reactor (tRES) on removal efficiencies of RSCs was not included as a factor on the Doehlert experimental design, after running preliminary tests. The range for each parameter (Table 2) was chosen to approach the industrial conditions with a determined inlet RSCs concentration: 0.46 ± 0.08 ppmv H2S; 1.8 ± 0.2 ppmv MES and 4.0 ± 0.4 ppmv DMDS. In most of the experiments, ozone was in ex-cess compared to the sum of [H2S]in, [MES]inand [DMDS]in(expressed as [RSCs]in), except when [O3]inwas at 5 ppmv.
The fitting model proposed by Doehlert is a second order equation, using four coefficients: a0(constant term that corresponds to the re-sponse at the center of the domain); an(linear terms); anm(interaction terms) and ann(quadratic terms). The model is described by Eq.(2). The higher the value of an, the stronger the influence in the response (Yi), where i refers to the specific RSCs (H2S, MES or DMDS). The anm ex-press interaction between two variables, that could be positive (sy-nergy) or negative. The annreveal the geometry of the response surface
[40]. The Xnrepresent the coded variables and are calculated by Eq.
(3), where Unis the real value of the variable; Un centeris the value at the center point (it is the average between the maximum and the minimum of variable range), ΔUnis the variation between maximum value of the Unrange and the Un0; βnis the maximum value of the coded variable in Doehlert table (Table SI-1, Support Information), equal to 1.0 for n = 1; 0.866 for n = 2; 0.816 for n = 3. Yiexp is the efficiency removal of specific RSCs and calculated by Eq.(4). The Doehlert coded values for three-factor design are inTable SI-1, Support Information. In order to verify the repeatability, the experiment at the center of the experi-mental domain (X1= X2= X3= 0) was run in quadruplicate.
= + + + = = = = + Yi a0 a X a X a X X n 1 3 n n n 1 3 nn n2 n 1 3 m n 1 3 nm n m (2) = X U U U U n n n center n max n center n (3) Fig. 1. Experimental set-up.
= =
Y [i] [i]
[i] with i H S, MES and DMDS
i
exp in out
in 2 (4)
Analysis of variance (ANOVA) was employed to calculate and to test the statistical significance of each coefficient (a0, an, anm, ann) into Yi using Minitab® (version 18.1). In this study, the coefficient values were obtained considering a confidence interval equal to 95%. Fitting models and coefficients were considered statistically significant when their P-values were inferior to 0.005. The statistical significance is related to null hypothesis (variations in Yiare not correlated to variations in Xn, i.
e., Xn= 0). Thereby, the smaller P-value, the less likely the null hy-pothesis, which means the correlation between the factors and Yi is more probable.
3. Results and discussion 3.1. Effect of residence time
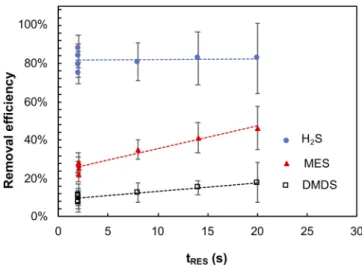
Preliminarily tests of catalyst-free ozonation of H2S, MES and DMDS were carried out in order to verify the effect of increasing tRESin the removal efficiency of RSCs (Fig. 2). The respective uncertainties were calculated by the method of propagation of error, considering the un-certainty of the air polluted generation system (estimated < 5%) and the uncertainty from the SIFT/MS quantification (obtained from Lab-Syft® Data Analysis and equal to the standard deviation of the mean concentration for a measurement time of 500 s).
With Treactorat room conditions (equal to 20 °C) and at the highest ozone inlet concentration ([O3]in= 100 ppmv), H2S has presented the higher removal efficiency, above 80%, whereas the highest level for the removal efficiencies of MES and DMDS were about 40% and less than 20%, respectively, despite the large excess of ozone ([O3]in/[RSCs]in equal to ~20). The increase of tRES(from 2 to 20 s) has not resulted in a considerable improvement on the removal efficiency of H2S and DMDS. Only MES has shown a potential positive impact of tRES, since the re-moval efficiency has increased from 27 ± 5% to 45 ± 11%. However, the enhancement of the removal efficiency was hidden by the increase of the uncertainty of the system (due to the use of the gas flows in their lowest values). In comparison with the studies of Tuggle[18], none of RSCs investigated (H2S, DMS and DMDS) have presented a significant increase of the removal efficiency when the residence time was in-creased from 10 to 60 s. This is in agreement with Zhang and Pagilla Table 1
Required parameters for quantification by SIFT/MS of reagents (RSCs and ozone) and expected oxidation products.
Compound CAS number µD(De) α (A3) H3O+ NO+ O2− NO2−
product ion (m/z) kIa[kc]a product ion (m/z) kIa[kc]a product ion
(m/z) kI a product ion (m/z) kI a Reagents O3 10028–15-6 – – – – – – – – NO3−(−62) 0.11g H2S 7783–06-4 0.97b 3.631c H3Sd(35) 1.6b[2] – – – – – – MES 624–89-5 1.56b 9.49c C 2H5SCH3.H+(77) 2.4e[2.6] C2H5SCH3+(76) 2.1e[2.2] – – – – DMDS 624–92-0 1.985b 10.82c (CH 3S)2.H+(95) 2.6e[2.7] (CH3S)2+(94) 2.4e[2.3] – – – – Expected products
MESO 1669–98-3 3.779 9.83 C2H5SOCH3.H+(93) - [3.3] C2H5SOCH3+(92) - [2.7] – – – –
MESO2 594–43-4 4.176 9.8 C2H5SO2CH3.H+(1 0 9) - [3.3] C2H5SO2CH3.NO+(1 3 8) - [2.8] – – – –
DMSOS 13882–12-7 2.072 11.16 (CH3)2SOS.H+(1 1 1) - [2.8] (CH3)2SOS+(1 1 0) - [2.3] – – – –
DMSO2S 2949–92-0 2.369 11.15 (CH3)2SO2S.H+(1 2 7) - [2.8] (CH3)2SO2S.NO+(1 5 6) - [2.3] – – – –
DM(SO)2 98984–65-7 0.685 11.51 (CH3SO)2.H+(1 2 7) - [2.3] (CH3SO)2.NO+(1 5 6) - [1.9] – – – –
DMSO2SO 14128–56-4 1.576 11.49 (CH3)2SO2SO.H+(1 4 3) - [2.6] (CH3)2SO2SO+(1 4 2) - [2.1] – – – – DM(SO2)2 10383–49-0 0.041 11.47 (CH3SO2)2.H+(1 5 9) - [2.0] (CH3SO2)2+(1 5 8) - [1.6] – – – – DM(SO2)2O 7143–01-3 5.844 12.16 (CH3SO2)2O.H+(1 7 5) - [3.7] (CH3SO2)2O+(1 7 4) - [3.1] – – – – H2SO4 7664–93-9 – – H3SO4+(99) 0.7e – – – – – – SO2 7446–09-5 – – – – – – SO2-( −6 4) 1.9f – – SO3 7446–11-9 – – – – – – SO3-( −8 0) 1.5f – – a. 10−9cm3molecule−1s−1.
b. Experimental values obtained from NIST[46]. c. Experimental values obtained from NIST[47].
d. Value of rate coefficient at dry condition. Rate coefficient of H2S with H3O+requires correction according to the humidity level[37].
e. Kinetics parameters obtained from LabSyft Compound Library® (release 1.6.2). f. Kinetics parameters obtained from Hera et al[41].
g. Kinetics parameters obtained from Vitola Pasetto et al[50].
Table 2
Range of humidity level, inlet ozone concentration and reactor temperature applied in the experimental design with [H2S]in= 0.46 ± 0.08 ppmv;
[MES]in= 1.8 ± 0.2 ppmv; [DMDS]in= 4.0 ± 0.4 ppmv and tRES= 2 s.
Factors U1 U2 U3
[H2O] (ppmv) [O3]in(ppmv) Treactor(°C)
Minimum 100 5 20
Maximum 40,000 100 60
Fig. 2. Removal efficiency of H2S, MES and DMDS as function of tRES for
[H2S]in= 0.46 ± 0.08 ppmv; [MES]in= 1.8 ± 0.2 ppmv; [DMDS]in= 4.0
[10]who have observed that the increase of tRESfrom 8 to 40 s have not considerably enhanced the removal efficiency of H2S.
3.2. Effect of ozone concentration, reactor temperature and humidity level
The experimental removal efficiency of H2S, MES and DMDS ob-tained by applying Doehlert design are presented inFig. 3for a fixed 2 s residence time (as the tREShas shown a negligible effect). H2S has achieved similar removal efficiency value compared to the preliminary tests – above 80% – when [O3]inwas at least 50 ppmv. The highest level for the removal efficiencies of MES and DMDS were about 30%, ob-tained when ozone was in large excess compared to [RSCs]in(close to 20 times with [O3]inat 100 ppmv).
The analysis of variance (Table 3) was performed for the removal efficiency of each RSCs separately, resulting in acceptable precision (R2> 0.95) and significant correlations between one or more factors with the removal efficiencies (P-value < 0.005) for all three models.
The P-value of the linear, quadratic and interaction terms coeffi-cients proposed by Doehlert are also shown inTable 3. None of those related to [H2O] (factor n = 1) for all three RSCs have shown P-value < 0.005, which indicates that the removal efficiency of all RSCs by ozone was not affected by the humidity level for the operating conditions tested. The lack of influence even in high humidity levels suggests that the expected hydroxyl radicals generation (HO%) from the decomposition of O3with H2O in gas phase[10,14]do not interfere on the ozonation of RSCs for the operating conditions applied in this study, which could imply that the oxidation reaction mainly happens via molecular attack of ozone on the RSCs.
[O3]in(factor n = 2) was the only factor which the linear term has presented P-value = 0 for all RSCs. For the case of MES and H2S, the quadratic term was also significant, which means that the correlation between the [O3]inand removal efficiencies are not linear, showing a slowdown in case of MES (Fig. 3B) and a parabola curve for the case of H2S (Fig. 3A). As it is evidenced inFig. 4, the coefficient a2(linear term of [O3]in) was positive and presented the highest values regarding the others terms (except a0) for all three RSCs.
The effect of Treactor(factor n = 3) was negligible for the removal of MES (P-value > 0.005). This is shown inFig. 3B, in which experiments carried out with Treactor at 20 °C, 40 °C and 60 °C have given similar behavior as function of ozone concentration. In case of DMDS, Treactor has presented a positive effect (positive value of a3onFig. 4) and non-linear correlation (P-value of a3and a33< 0.005). As we can see on
Fig. 3C, the effect of the temperature on removal efficiency of DMDS by ozone oxidation was visible from 20 °C (for [O3]inat 100 ppmv, DMDS was 9 ± 5% removed) to 40 °C (for [O3]inat 100 ppmv, DMDS was Fig. 3. Removal efficiency of H2S (A), MES (B) and DMDS (C) as function of the
inlet ozone concentration under different Treactor, for [H2S]in= 0.46
± 0.08 ppmv; [MES]in= 1.8 ± 0.2 ppmv; [DMDS]in= 4.0 ± 0.4 ppmv and
tRES= 2 s.
Table 3
Analysis of variance (ANOVA) for removal efficiencies of H2S, MES and DMDS
(P- value < 0.005 are in bold). Model YH2S YMES YDMDS R2 0.9528 0.9912 0.9771 P-value 0.001 0 0 Coefficient P-value Constant a0 0 0 0 [H2O] a1 0.366 0.549 0.105 [O3]in a2 0 0 0 Treactor a3 0 0.996 0 [H2O] × [H2O] a11 0.012 0.706 0.203 [O3]in× [O3]in a22 0.004 0.004 0.629 Treactor× Treactor a33 0.535 0.006 0.002 [H2O] × [O3]in a12 0.981 0.714 0.591 [H2O] × Treactor a13 0.892 0.073 0.294 [O3]in× Treactor a23 0.648 0.659 0.17
L. Vitola Pasetto, et al.
30 ± 5% removed), but less notable from 40 °C to 60 °C (for [O3]inat 100 ppmv, DMDS was 30 ± 4% removed). This lack of proportionality on Treactorcould be explained by the low values of removal efficiency of DMDS, which in association with a considerable variability of the system have hidden the positive effect for the range at higher tem-peratures. Low removal values and high variability could also explained the poor fitting of the model for removal efficiency of DMDS at Treactor= 20 °C (shown inFig. 3C). In case of H2S, a surprising negative effect of the Treactoron the removal efficiency was evidenced: P-value of a3equal to 0 inTable 3and the negative value of a3inFig. 4.
The negative effect of temperature on the H2S removal and the parabolic behavior of H2S removal as function of the ozone con-centration could suggest a kinetic equilibrium in place. However, we have concluded that these phenomena were a consequence of analytical artifacts in SIFT/MS due to water interference on H2S quantification
[37]. Because of a decrease on the count rate of the characteristic product ion of H2S as function of the water vapor in the sample, the relative uncertainty related to H2S quantification by SIFT/MS has varied, which resulted that the uncertainty of measuring 0.5 ppmv of H2S in presence of 40,000 ppmv of H2O was higher than the uncertainty of measuring 0.5 ppmv of H2S in dry air[37].
This variation on uncertainties concerning the H2S concentrations – and therefore the removal efficiencies – is clearly visible onFig. 3A. Plotting only the removal efficiencies of H2S obtained in dry condition (humidity level fixed at 100 ppmv of H2O) as shown in Fig. SI-1,
Support Information, Treactorat 20 °C, 40 °C and 60 °C have shown si-milar behaviors as function of the ozone concentration, indicating that removal of H2S was not significantly affected by this parameter for the operating conditions applied. In addition, the increase of H2S removal as function of the ozone concentration has no longer presented a parabolic curve, showing only a slowdown with the ozone
concentration. The falsely negative effect of Treactor according to ANOVA and the parabolic curve of fitting model may be the reflect of the model accuracy calculation since it is based on the repetition of the center of the domain and therefore, only one condition of humidity is evaluated.
In studies of gas ozonation, Tuggle[18]has also reported a lower impact of temperature on the removal efficiency of H2S compared to DMDS: removal efficiency of H2S has varied from 30% (at 38 °C) to 40% (at 125 °C) considering a residence time of 10 s and [O3]/[H2S] molar ratio equal to 1. Otherwise for DMDS, for a [O3]/[DMDS] molar ratio equal to 3 and a residence time of 10 s, removal efficiency of DMDS has increased from 25% at 38 °C to 60% at 125 °C. DMS (the representative monosulfide studied by Tuggle[18]) has not been considerably affected by Treactor(65% and 70% removed at 38 °C and 125 °C respectively for a residence time equal to 10 s and [O3]/[DMS] equal to 2), which is in agreement to MES results, if we consider that monosulfide would react in a similar way with ozone.
3.3. Identification and quantification of oxidation products 3.3.1. Estimation of required parameters for SIFT/MS
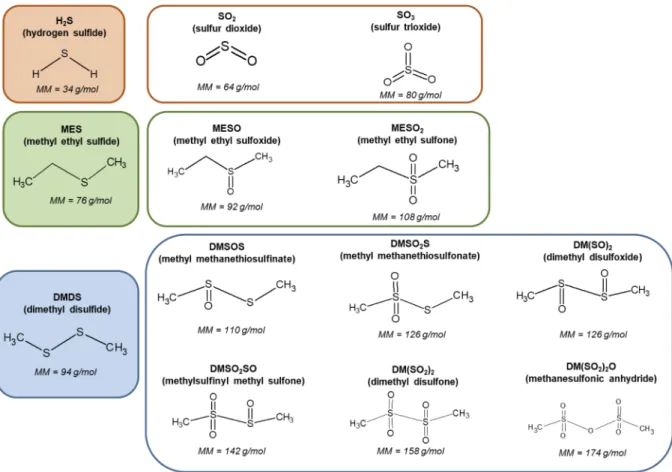
The expected oxidation products of H2S, MES and DMDS according to the literature are shown inFig. 5 [24,29,30]. In a first moment, we have considered the SO2, and consequently SO3, were products of H2 S-O3reaction. Ozonation of MES would generate methyl ethyl sulfoxide (MESO) and sulfone (MESO2), whereas the reaction between ozone and DMDS would probably produces methyl methanethiosulfinate (DMSOS), the isomers methyl methanesufonate (DMSO2S) and di-methyl disulfoxide (DM(SO)2), methylsulfinyl methyl sulfone (DMSO2SO), dimethyl disulfone (DM(SO2)2) and methaneslfonic an-hydride (DM(SO2)2O).
The required parameters for SIFT/MS quantification of SO2and SO3 have been reported by Hera et al[41], which values are presented in
Table 1. However, particularly for the expected oxidation products of MES and DMDS with ozone, their quantifications by SIFT/MS have not been stated, as far as we know. The only example of sulfoxide and sulfone present on LabSyft Compound Library® (release 1.6.2) were DMSO and DMSO2, which characteristic product ions for H3O+ pre-cursor ion were (CH3)2SO.H+ (79) and (CH3)2SO2.H+ (95) and for NO+ precursor ion, they were (CH
3)2SO+ (78) and (CH3)2SO2.NO+
(124), respectively.
Therefore, in order to obtain the potential product ions for the ex-pected oxidation products, we assumed that MESO would react with H3O+ and NO+ precursor ions similarly to DMSO and MESO2 to DMSO2. As no information was found about the ionization of the oxi-dized disulfides compounds, we have considered that all potential oxidation products of DMDS would react with H3O+by the standard H+ transfer. For NO+ precursor ion, a preliminary analysis of the spectra was necessary since two ionization reactions may happen: by charge transfer or NO+transfer. FromFig. 6, we have identified that DMSOS, DMSO2SO, DM(SO2)2and DM(SO2)2O would react with NO+ by charge transfer, whereas the isomers DMSO2S and DM(SO)2by NO+ transfer. The m/z = 126 (potentially related to DMSO2S and DM(SO)2) has been identified onFig. 6. However, this peak was also quantified in the reactor inlet, being therefore neglected for the quantification of the isomers DMSO2S and DM(SO)2. The assumed characteristic product ion for each expected product are inTable 1.
As described in Eq. (1), the rate coefficient is also required to quantify an analyte by SIFT/MS. According to several studies in the literature[38,39,42,43], the rate coefficient of ionization reaction (kI) could be estimated by the collision theory (kc) and calculated by method of Su[44,45](Eq.(5)), which depends on the dipole moment (µD), polarizability (α) and molar mass of the neutral compound (MMneutral), molar mass of the precursor ion (MMion), flow tube Fig. 4. Coefficient values of Doehlert models for removal efficiencies of H2S,
temperature (Tft), elementary charge (e) and Boltzmann constant (kb). When µDand α were not available on NIST[46,47], they were esti-mated by Avogadro® (version 1.0.1) and ACD/ChemSketch® (version 2018.1.1), respectively. The calculated kc are available in Table 1, which resulted close to experimental values, suggesting that estimation of kIby kc should be valid.
The quantification of MES, DMDS and their expected oxidation products were carried out by NO+precursor ion, since it is less effected by the humidity level of the sample (compared to H3O+that in pre-sence of water vapor, generates water clusters H3O+.(H2O)n= 1,2,3) and therefore, the simple expression to calculate the compounds con-centrations can be used (Eq.(1))[48]. O2+precursor also reacts with MES, DMDS and with their expected ozonation products; however, O2+ ionization reaction is less soft than H3O+and NO+, usually generating more than one characteristic product ion[38]. Since the O2+spectra
were much more complex than H3O+and NO+spectra, the kinetics parameters were not calculated in this study.
= = + < + < < + < < < < = + + x x x x x x x x x with x kc K 2 e , with K 0.9754; 2 0.4767 0.6200; 2 3 0.5781 0.3165; 3 35 0.6201 1.15; 35 60 0.6347 2.029; 60 CAP MM MM MM MM CAP (x 0.5090)2 10.526 1 ft µD ion neutral ion neutral 2 kbT (5) Fig. 5. RSCs and their expected oxidation products according to the reactional mechanism proposed in the literature[24,29,30].
Fig. 6. Comparison of NO+ spectra at the reactor inlet with the reactor outlet for [H
2S]in= 0.46 ± 0.08 ppmv; [MES]in= 1.8 ± 0.2 ppmv;
[DMDS]in= 4.0 ± 0.4 ppmv, [O3]in= 100 ppmv, tRES= 2 s and Treactor= 60 °C. L. Vitola Pasetto, et al.
3.3.2. Quantification of oxidation products
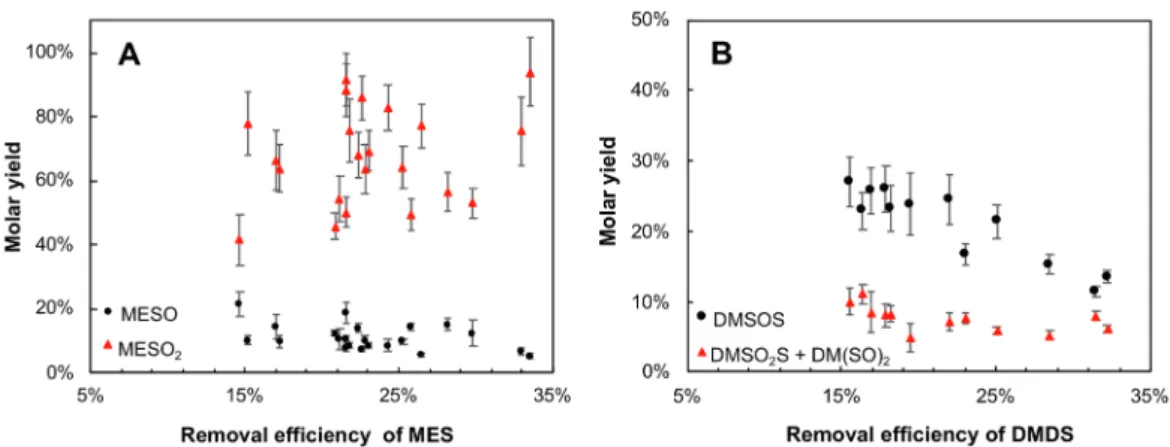
Even with the low removal efficiencies of MES and DMDS during this ozonation process, some of the expected oxidation products in-dicated inFig. 5could be identified. From the characteristic product ions proposed inTable 1, MESO2and MESO, DMSOS and the isomers DMSO2S + DM(SO)2 were detected in the NO+ spectra of reactor outlet, as it is shown inFig. 6.
The molar yields of the oxidation products (φi) were obtained
ac-cording to Eq.(6)(taking as example the molar yield of MESO calcu-lation), whose concentration ([i], with i = MESO) was calculated from the estimated parameters shown inTable 1. By applying Eq.(6), the molar yield of MESO and MESO2 (Fig. 7A) and of DMSOS and the isomers DMSO2S + DM(SO)2(Fig. 7B) were investigated in function of the removal efficiency of MES and DMDS, respectively.
= [MESO]
[MES] [MES]
MESO
in out (6)
In case of MES, MESO2was identified as the primary product for the ozonation of MES, representing a molar yield equal to 70% in average, whereas MESO has resulted in a molar yield equal to 10%. In case of DMDS, DMSOS was present in a higher concentration than the isomers DMSO2S + DM(SO)2, with a molar yield around 30% and 10%, re-spectively, for a removal efficiency of DMDS between 15% and 25%. The visible reduction of molar yield of DMSOS and DMSO2S + DM (SO)2with the increase of removal efficiency of DMDS inFig. 7B could
be explained by the generation of SO2and SO3. InFig. 8, the correlation of the DMDS consumption with [SO2]outand [SO3]outwas evidenced, suggesting that ozone attacks the sulfur-sulfur bond, generating SO2, which may be the primary product of ozonation of DMDS. The addi-tional peaks detected inFig. 6at m/z ratio smaller than MES and DMDS could be related to potential by-products having a shorter carbon chain. In summary, from the analysis of the primary products of MES and DMDS, we suggest that the gas phase ozonation of organic monosulfide and disulfide (in the operating conditions applied in this study) may happen by two different mechanisms: (i) monosulfides might be oxi-dized by an electrophilic attack of the molecular ozone, as it is usually proposed in liquid phase, with a sequential oxygen-addition on the sulfur molecule and (ii) the reaction of ozone with organic disulfide would be mainly led by the sulfur-sulfur bond scission.
Another important analysis could be extracted fromFig. 8regarding the ozonation of H2S. In conditions where the consumption of RSCs was mainly represented by H2S (experiments number 1 and 2 inFig. 8), the sum of the concentrations of SO2 and SO3 have not resulted in the quantity of H2S consumed, implying that SO2 may not be the only product of H2S ozonation in the operating conditions applied in this study. Preliminary ozonation experiments carried out in presence of only H2S (Fig. SI-2, Support Information) have evidenced that the peak at m/z 81 in H3O+ spectra of the reactor outlet (Fig. SI-3A, Support
Information) and the peak at m/z 80 in O2+spectra of the reactor outlet (Fig. SI-3B, Support Information) were related to the reaction between Fig. 7. A) Molar yield of the MESO and MESO2as function of removal efficiency of MES. B) Molar yield of DMSOS and the sum of the isomers DMSO2S and DM(SO)2
as function of removal efficiency of DMDS. Only the experiments with removal efficiency superior to 15% were considered due to the extremely high uncertainty at the low range (< 15%).
Fig. 8. Comparison of RSCs consumed with the concentration of SO2and SO3measured at the reactor outlet and with the ozone concentration at the reactor inlet and
H2S and O3, likely representing a by-product in addition to SO2and H2O previously expected. However, as this compound could not be identified, its quantification by SIFT/MS was not possible.
Sulfuric acid, DMSO2SO, DM(SO2)2 and DM(SO2)2O proposed as potential products in Fig. 5 were continuously followed during the experiments, however, their generation were negligible. Sulfuric acid represented less than 5% of all RSCs consumed, even in highest hu-midity levels and the sum of the molar yield of DMSO2SO, DM(SO2)2 and DM(SO2)2O represented less than 5% of DMDS variation.
As in most of experiments ozone was present in large excess, its consumption was insignificant (Fig. 8). Nevertheless, for the experi-ments number 1 and 2 (Fig. 8), a slight difference between the ozone concentration at the reactor inlet and outlet could be considered. However, as the uncertainty of SIFT/MS quantification of ozone was higher at low concentration level, the consumption of ozone could not be measured.
4. Conclusion
The application of homogenous gas ozonation was studied with operating parameters similar to industrial conditions: short residence time (2 to 20 s); mild temperature (20 to 60 °C), ozone-RSCs molar ratio (0.8 to 20) and total RSCs concentration of 6.5 ppmv. Quite low moval efficiencies were obtained for MES and DMDS: maximum re-moval efficiencies up to 30% even when ozone was used in large excess (20 times the RSCs concentration). At the same time, H2S has resulted in an interesting removal (up to 80%). In the studied experimental domain, ozone concentration has shown a slight positive impact for all three RSCs. In contrast, the other three operating parameters in-vestigated (humidity level, reactor temperature and residence time) did not show significant influence on the removal efficiency of RSCs.
Besides the low efficiency for organic sulfides, the necessity of ozone at high excess must be highlighted as drawback of gas ozonation, since ozone emission must be avoided (considered an air pollution in ground-level [49]). A step of decomposition/destruction of ozone should therefore be planned. It would be relevant to couple the homogenous ozonation with another oxidative technique – such as reactive absorp-tion, photocatalysis/photolysis or adsorption/catalysis – in order to enhance the overall removal efficiency of RSCs and overcome the drawbacks previously highlighted.
Primary products of ozone-RSCs reaction in gas phase were identi-fied, suggesting that organic monosulfide and disulfide probably follow different reaction mechanisms. In case of monosulfide, sulfone was the primary product detected, indicating a reaction based on electrophilic attack of ozone with a sequential oxygen-addition on sulfur molecule. In case of disulfide, the mechanism would be mainly due to sulfur-sulfur bond scission, since SO2 was the primary product detected. Nevertheless, complementary studies would be necessary in order to verify the hypothesis regarding the organic sulfides mechanism with ozone. Finally, SO2 and H2O may not be the only by-products for ozonation of H2S, since additional peaks were detected in H3O+and O2+spectra of SIFT/MS analysis.
Acknowledgement
The authors gratefully acknowledge the financial support for the research by French National Agency for Research and Technology and Agro Innovation International (CIFRE 2015/1233). The authors thank Mr. Laurent Willain for his support and helpful advices.
Appendix A. Supplementary data
Supplementary data to this article can be found online athttps:// doi.org/10.1016/j.cej.2019.123416.
References
[1] M. de Blas, M. Navazo, L. Alonso, G. Gangoiti, J.A. García, E.S. de Cámara, V. Valdenebro, E. García-Ruiz, N. García-Borreguero, Continuous measurement of atmospheric reduced sulphur compounds as key tracers between odour complaints and source apportionment, Environ. Monit. Assess. 189 (2017),https://doi.org/10.
1007/s10661-017-5800-2.
[2] F. Carrera-Chapela, A. Donoso-Bravo, J.A. Souto, G. Ruiz-Filippi, Modeling the odor generation in WWTP: an integrated approach review, Water Air Soil Pollut. 225 (2014) 1–15,https://doi.org/10.1007/s11270-014-1932-y.
[3] A. Feilberg, D. Liu, A.P.S. Adamsen, M.J. Hansen, K.E.N. Jonassen, Odorant emis-sions from intensive pig production measured by online proton-transfer-reaction mass spectrometry, Environ. Sci. Technol. 44 (2010) 5894–5900,https://doi.org/ 10.1021/es100483s.
[4] J.R. Kastner, Q. Buquoi, R. Ganagavaram, K.C. Das, Catalytic ozonation of gaseous reduced sulfur compounds using wood fly ash, Environ. Sci. Technol. 39 (2005) 1835–1842,https://doi.org/10.1021/es0499492.
[5] R. Iranpour, H.H.J. Cox, M.A. Deshusses, E.D. Schroeder, Literature review of air pollution control biofilters and biotrickling filters for odor and volatile organic compound removal, Environ. Prog. 24 (2005) 254–267,https://doi.org/10.1002/ ep.10077.
[6] D. Volckaert, P.M. Heynderickx, E. Fathi, H. Van Langenhove, SIFT-MS a novel tool for monitoring and evaluating a biofilter performance, Chem. Eng. J. 304 (2016) 98–105,https://doi.org/10.1016/j.cej.2016.04.138.
[7] A. Kerc, S.S. Olmez, Ozonation of odorous air in wastewater treatment plants, Ozone Sci. Eng. 32 (2010) 199–203,https://doi.org/10.1080/
01919511003792102.
[8] E. Vega, M.J. Martin, R. Gonzalez-Olmos, Integration of advanced oxidation pro-cesses at mild conditions in wet scrubbers for odourous sulphur compounds treat-ment, Chemosphere 109 (2014) 113–119,https://doi.org/10.1016/j.chemosphere. 2014.02.061.
[9] H. Yao, A. Feilberg, Characterisation of photocatalytic degradation of odorous compounds associated with livestock facilities by means of PTR-MS, Chem. Eng. J. 277 (2015) 341–351,https://doi.org/10.1016/j.cej.2015.04.094.
[10] Y. Zhang, K.R. Pagilla, Gas-phase ozone oxidation of hydrogen sulfide for odor treatment in water reclamation plants, Ozone Sci. Eng. 35 (2013) 390–398,https://
doi.org/10.1080/01919512.2013.796861.
[11] X. Li, G. Zhang, H. Pan, Experimental study on ozone photolytic and photocatalytic degradation of H2S using continuous flow mode, J. Hazard. Mater. 199–200 (2012)
255–261,https://doi.org/10.1016/j.jhazmat.2011.11.006.
[12] C. Meusinger, A.B. Bluhme, J.L. Ingemar, A. Feilberg, S. Christiansen, C. Andersen, M.S. Johnson, Treatment of reduced sulphur compounds and SO2by Gas Phase
Advanced Oxidation, Chem. Eng. J. J. 307 (2017) 427–434,https://doi.org/10. 1016/j.cej.2016.08.092.
[13] C.L. Hwang, N.H. Tai, Vapor phase oxidation of dimethyl sulfide with ozone over ion-exchanged zeolites, Appl. Catal. A Gen. 393 (2011) 251–256,https://doi.org/ 10.1016/j.apcata.2010.12.004.
[14] K. Skalska, S.S. Ledakowicz, R. Louwe, R.R. Szymczak, Nitrogen oxides pre-ozo-nation in flue gases from phosphate rock digestion, Chem. Eng. J. 318 (2017) 181–188,https://doi.org/10.1016/j.cej.2016.06.048.
[15] K. Skalska, J.S. Miller, S. Ledakowicz, Effectiveness of nitric oxide ozonation, S. Chem. Pap. 65 (2011) 193–197,https://doi.org/10.2478/s11696-010-0082-y. [16] Z. Wang, J. Zhou, Y. Zhu, W. Zhengcheng, J. Liu, K. Cen, Simultaneous removal of
NOx, SO2and Hg in nitrogen flow in a narrow reactor by ozone injection:
experi-mental results, Fuel Process. Technol. 88 (2017) 817–823,https://doi.org/10. 1016/j.fuproc.2007.04.001.
[17] L. Wei, J. Zhou, Z. Wang, K. Cen, Kinetic modeling of homogeneous low-tempera-ture multi-pollutant oxidation by ozone, Ozone Sci. Eng. 29 (2007) 207–214,
https://doi.org/10.1080/01919510701304046.
[18] M.L. Tuggle, Reactions of Reduced Sulfur Compounds with Ozone, University of Florida, 1971.
[19] R. Atkinson, D.L. Baulch, R.A. Cox, J.N. Crowley, R.F. Hampson, R.G. Hynes, M.E. Jenkin, M.J. Rossi, J. Troe, Evaluated kinetic and photochemical data for at-mospheric chemistry: volume I - gas phase reactions of Ox, HOx, NOxand SOx
species, Atmos. Chem. Phys. 4 (2004) 1461–1738, https://doi.org/10.5194/acp-4-1461-2004.
[20] R. Atkinson, W.P.L. Carter, Kinetics and mechanisms of the gas-phase reactions of ozone with organic compounds under atmospheric conditions, Chem. Rev. 84 (1984) 437–470,https://doi.org/10.1021/cr00063a002.
[21] F. Westley, Table of Rate Constants for Gas Phase Chemical Reactions of Sulfur
Compounds (1971-1980), NIST, 1982.
[22] K.H. Becker, M.A. Inocencio, U. Schurath, Reaction of ozone with hydrogen sul de and its organic derivatives, Int. J. Chem. Kinet. Conf. Symp. Chem. Kinet. Data Up. Low. Atmos. Warrenton, VA, USA, 15 Sep 1974, 1975, p. 7.
[23] M. Vahedpour, R. Baghary, F. Khalili, Prediction of mechanism and thermochemical properties of O3+ H2S atmospheric reaction, J. Chem. (2013),https://doi.org/10.
1155/2013/659682.
[24] S.H. Mousavipour, M. Mortazavi, O. Hematti, Multichannel RRKM-TST and direct-dynamics CVT study of the reaction of hydrogen sulfide with ozone, J. Phys. Chem. A 117 (2013) 6744–6756,https://doi.org/10.1021/jp404738d.
[25] S. Glavas, S. Toby, Reaction between ozone and hydrogen sulfide, J. Phys. Chem. 79 (1975) 779–782,https://doi.org/10.1021/j100575a004.
[26] J.M. Hales, J.O. Wilkes, J.L. York, Some recent measurements of H2S oxidation rates
and their implications to atmospheric chemistry, Tellus 26 (1974) 277–283, https://doi.org/10.3402/tellusa.v26i1-2.9795.
[27] S.T. Oyama, Chemical and catalytic properties of ozone, Catal. Rev. 42 (2000) 279–322,https://doi.org/10.1081/CR-100100263.
[28] Lin Du, Yongfu Xu, Ge, Long Jia, Li Yao, L. Du, Y. Xu, M. Ge, L. Jia, L. Yao, W. Wang, Rate constant of the gas phase reaction of dimethyl sulfide (CH3SCH3)
with ozone, Chem. Phys. Lett. 436 (2007) 36–40,https://doi.org/10.1016/j.cplett. 2007.01.025.
[29] P.S. Bailey, The reactions of ozone with organic compounds, Chem. Rev. 58 (1958) 925–1010,https://doi.org/10.1021/cr50023a005.
[30] D. Barnard, Oxidation of organic sulphides. Part IX. The reaction of ozone with organic sulphur compouds, J. Chem. Soc. (1957) 4547–4555.
[31] I.B. Douglass, Some chemical aspects of kraft odor control, J. Air Pollut. Control Assoc. 18 (1968) 541–545,https://doi.org/10.1080/00022470.1968.10469169. [32] R.I. Martinez, J.T. Herron, Stopped-flow study of the gas-phase reaction of ozone
with organic sulfides: dimethyl sulfide, Int. J. Chem. Kinet. 10 (1978) 433–452. [33] R.J. Glinski, D.A. Dixon, Chemiluminescent reactions of ozone with dimethyl
sulf-oxide and dimethyl disulfide. Formation of electronically excited sulfur disulf-oxide, J. Phys. Chem. 89 (1985) 33–38,https://doi.org/10.1021/j100247a010.
[34] E.C. Sivret, B. Wang, G. Parcsi, R.M. Stuetz, Prioritisation of odorants emitted from sewers using odour activity values, Water Res. 88 (2016) 308–321,https://doi.org/ 10.1016/j.watres.2015.10.020.
[35] X. Yang, W. Zhu, J.A. Koziel, L. Cai, W.S. Jenks, Y. Laor, J.H. van Leeuwen, S.J. Hoff, Improved quantification of livestock associated odorous volatile organic compounds in a standard flow-through system using solid-phase microextraction and gas chromatography-mass spectrometry, J. Chromatogr. A 1414 (2015) 31–40, https://doi.org/10.1016/j.chroma.2015.08.034.
[36] F. Lestremau, V. Desauziers, J.C. Roux, J.L. Fanlo, Development of a quantification method for the analysis of malodorous sulphur compounds in gaseous industrial effluents by solid-phase microextraction and gas chromatography-pulsed flame photometric detection, J. Chromatogr. A 999 (2003) 71–80,https://doi.org/10.
1016/S0021-9673(03)00328-5.
[37] L. Vitola Pasetto, R. Richard, J.-S. Pic, M.-H. Manero, F. Violleau, V. Simon, Hydrogen sulphide quantification by SIFT/MS: highlighting the influence of gas moisture, Int. J. Environ. Anal. Chem. (2019),https://doi.org/10.1080/03067319. 2019.1650919.
[38] D. Smith, P. Spanel, Selected Ion Flow Tube Mass Spectrometry (SIFT-MS) for on-line trace gas analysis, Mass Spectrom. Rev. 24 (2005) 661–700,https://doi.org/
10.1002/mas.20033.
[39] G.J. Francis, D.B. Milligan, M.J. McEwan, Detection and quantification of chemical warfare agent precursors and surrogates by selected ion flow tube mass spectro-metry, Anal. Chem. 81 (2009) 8892–8899,https://doi.org/10.1021/ac901486c. [40] S.L.C. Ferreira, W.N.L. Dos Santos, C.M. Quintella, B.B. Neto, J.M. Bosque-Sendra,
Doehlert matrix: a chemometric tool for analytical chemistry – review, Talanta 63 (2004) 1061–1067,https://doi.org/10.1016/j.talanta.2004.01.015.
[41] D. Hera, V. Langford, M. McEwan, T. McKellar, D. Milligan, Negative reagent ions for real time detection using SIFT-MS, Environments 4 (2017) 16,https://doi.org/
10.3390/environments4010016.
[42] B. R’Mili, B. Temime-roussel, A. Monod, H. Wortham, R.S. Strekowski, Quantification of the gas phase methyl iodide using O2+as the reagent ion in the
PTR-ToF-MS technique, Int. J. Mass Spectrom. 431 (2018) 43–49,https://doi.org/ 10.1016/j.ijms.2018.06.003.
[43] J. Zhao, R. Zhang, Proton transfer reaction rate constants between hydronium ion (H3O+) and volatile organic compounds, Atmos. Environ. 38 (2004) 2177–2185,
https://doi.org/10.1016/j.atmosenv.2004.01.019.
[44] T. Su, Erratum: Trajectory calculations of ion- polar molecule capture rate constants at, J. Chem. Phys. 89 (1988) 5355,https://doi.org/10.1063/1.455750. [45] T. Su, W.J. Chesnavich, Parametrization of the ion – polar molecule collision rate
constant by trajectory calculations, J. Chem. Phys. 76 (1982) 5183–5185,https:// doi.org/10.1063/1.442828.
[46] NIST - computational chemistry comparison and benchmark dataBase - experi-mental dipoles.https://cccbdb.nist.gov/diplistx.asp, 2019 (accessed March 1, 2019).
[47] NIST - computational chemistry comparison and benchmark dataBase - experi-mental polarizabilites.https://cccbdb.nist.gov/pollistx.asp, 2019 (accessed March 1, 2019).
[48] P. Spanel, D. Smith, Influence of water vapour on selected ion flow tube mass spectrometric analyses of trace gases in humid air and breath, Rapid Commun. Mass Spectrom. 14 (2000) 1898–1906.
[49] World Health Organization, Air quality guidelines for particulate matter, ozone, nitrogen dioxide and sulfur dioxide - Global update, 2005.
[50] L. Vitola Pasetto, R. Richard, J.-S. Pic, M.-H. Manero, F. Violleau, V. Simon, Ozone quantification by Selected Ion Flow Tube Mass Spectrometry: influence of humidity and manufacturing gas of ozone generator, Anal. Chem. (2019) in press.
![Fig. 3 C, the effect of the temperature on removal efficiency of DMDS by ozone oxidation was visible from 20 °C (for [O 3 ] in at 100 ppmv, DMDS was 9 ± 5% removed) to 40 °C (for [O 3 ] in at 100 ppmv, DMDS wasFig](https://thumb-eu.123doks.com/thumbv2/123doknet/2939369.78964/6.892.76.413.78.1059/effect-temperature-removal-efficiency-oxidation-visible-removed-wasfig.webp)