Automated Cell-targeted Electrophysiology In Vivo and Non-invasive Gamma Frequency Entrainment
by Ho-Jun Suk
B.S., Cornell University (2008)
M.S. University of Illinois at Urbana-Chman ) 09 MASSACHUSETTS INSTITUTE OF TECHNOLOGY
JUN 1 7 2019
LIBRARIES
ARCHWVE n
Submitted to the Harvard-MIT Program in Health Sciences and Technology, in Partial Fulfillment of the Requirements for the Degree of
Doctor of Philosophy at the
MASSACHUSETTS INSTITUTE OF TECHNOLOGY June 2019
C 2019 Massachusetts Institute of Technology. All rights reserved
Signature of Author ...
Signature redacted
Harvard-MIT Program in Health Sciences and TechnologySignature redacted
May 20, 2019C ertified by ... ...
Ed Boyden, PhD Y. Eva Tan Professor in Neurotechnology Associate Professor of Biological Engineering and Brain and Cognitive Sciences, MIT Media Lab and McGovern Institute
Signature
red acted/
Thesis SupervisorA ccepted by ... ...
Emery N. Brown, MD, PhD irector, Harvard-MIT Program in Health Sciences and Technology Professor of Computational Neuroscience and Health Sciences and Technology
Automated Cell-targeted Electrophysiology In Vivo and Non-invasive Gamma Frequency Entrainment
by Ho-Jun Suk
Submitted to the Harvard-MIT Program in Health Sciences and Technology on May 20, 2019 in Partial Fulfillment of the
Requirements for the Degree of Doctor of Philosophy in Medical Engineering and Medical Physics
ABSTRACT
Targeted patch clamp recording is a powerful method for characterizing visually identified cells in intact neural circuits, but it requires skill to perform. We found that a closed-loop real-time imaging strategy, which continuously compensates for cell movement while approaching the cell with a pipette tip, allows for the development of an algorithm amenable to automation. We built a robotic system that can implement this algorithm and validated that our system can
automatically patch fluorophore-expressing neurons of multiple types in the living mouse cortex, with yields comparable to skilled human experimenters. By facilitating targeted patch clamp recordings in vivo, our robot may enable scalable characterization of identified cell types in intact neural circuits. Activities of individual neurons in neural circuits give rise to network oscillations, whose frequencies are closely related to specific brain states. For example, network oscillations in the 30 -90 Hz range, observed using electroencephalogram (EEG), are called gamma oscillations and increase during attention, memory formation, and recall. In Alzheimer's disease (AD), gamma oscillations are disrupted compared to healthy individuals. Recently, non-invasive visual and auditory stimulations at 40 Hz, called Gamma ENtrainment Using Sensory stimulus ("GENUS"), have been shown to positively impact pathology and improve memory in AD mouse models, with concurrent visual and auditory GENUS leading to a more widespread effect in the AD mouse brain compared to visual or auditory stimulation alone. However, it is unclear what effect such sensory stimulations would have on the human brain. To test for the safety and feasibility of GENUS in humans, we developed a device that can deliver 40 Hz light and sound stimulations at intensity levels tolerable to humans. We found that our device can safely lead to steady 40 Hz entrainment in cognitively normal young (20 - 33 years old) and older (55 - 75 years old) subjects, with concurrent visual and auditory stimulation leading to stronger and more widespread entrainment than visual or auditory stimulation alone. These findings suggest that GENUS can be a safe and effective method for widespread 40 Hz entrainment, which may have therapeutic effects in people suffering from AD.
Thesis Supervisor: Ed Boyden, PhD
Title: Y. Eva Tan Professor in Neurotechnology
Associate Professor of Biological Engineering and Brain and Cognitive Sciences, MIT Media Lab and McGovern Institute
ACKNOWLEDGEMENTS
First, I would like to thank my thesis supervisor, Professor Ed Boyden. Ed has been a tremendous mentor for me, giving me the opportunity to work on extremely fun and impactful projects, and also continuously providing invaluable advice along the way to help me reach the goals we had for the projects. His tireless desire to "solve the brain" and "make the world better", in addition to his out-of-this-world work ethic, has motivated and encouraged me to try to be the best researcher that I could be. My time in Ed's lab has been truly a blessing.
I am also extremely grateful for my thesis committee chair, Professor Li-Huei Tsai. Despite her busy schedule, she immediately agreed to be my chair when I asked, and she has continued to provide invaluable guidance and advice since then. Li-Huei has also been such a great PI to collaborate with, always appreciating my contribution no matter how small they had been. Li-Huei's love for research and her amazing drive to solve the aging brain have been truly inspiring.
I would also like to thank my committee members Professor Adam Cohen and Doctor Emery Brown. I really appreciate not only that Adam agreed to be on my committee even though I have never met him before and pretty much cold-emailed him, but also that he has provided a unique perspective on my projects that really helped them to be better. It was also a blessing for me to have Emery in my committee, getting the opportunity to learn so much about EEG, statistical analysis, and human trials. Emery was always happy to make time to meet with me to answer my questions and provide insightful advice, and I am extremely grateful for his time and help.
I also need to thank many (past and present) members of the Boyden lab. A big thank you has to go to Holly Bims, our lab's wonderful administrative assistant, who found a date and time for my defense that worked for all of my committee members (which really seemed to be an impossible task for me, given the busy schedule of my committee members). I want to thank Lisa Lieberson and Macey Lavoie as well, for all of their help with ordering and other important tasks that they helped me with. I am also very grateful for Dr. Ingrid van Welie. Ingrid was the one who actually made the imagepatching project possible, and I was so lucky to have had a chance to work with her on it. Without her expertise in in vivo patching and her patience with me as she was teaching me how to patch, the imagepatcher would not have been possible. I also need to thank Professor Suhasa Kodandaramaiah, Dr. Brian Allen, Dr. Giovanni Talei Franzesi, Demian Park, and Professor Craig Forest for their help with the imagepatcher project. I cannot count how many times I had to bug Suhasa, Brian, Giovanni, and Demian with questions about patching, but no matter how stupid my questions were, they were always extremely helpful with their answers and advice. I am also grateful for Professor Annabelle Singer, who gave me the opportunity to be involved in the collaboration with the Tsai lab.
There are many people in the Tsai lab for whom I am extremely grateful. Dr. Hannah laccarino and Dr. Anthony Martorell have been great colleagues, and it was so fun working with them. I also need to thank Dr. Diane Chan, Brennan Jackson, Vanesa Fernandez, Sara Beach (from the Gabrieli lab), Danielle Stark, Noah Milman, and Colton Stearns (a.k.a. the human gamma team). The human gamma work would not have been possible without them, and I
consider myself truly blessed to have had the opportunity to work with these smart and fun people. I also would like to thank Dr. Chinnakkaruppan Adaikkan, Dr. Hansruedi Mathys, and Dr. Jennie Young for extremely helpful discussions on GENUS and Alzheimer's Disease.
I would also like to acknowledge Dr. Emily Stephen, Professor Seong-Eun Kim, Professor Francisco Flores, and Dr. Sourish Chakravarty for their help on EEG data analysis.
I am also grateful for Samsung Scholarship, not only for providing the support I need to study and learn at MIT, but also for providing the opportunity to make Samsung Scholar colleagues and friends.
There are not enough words in this world to describe my appreciation and love for my parents, who have sacrificed so much for me and my brother. Their unconditional love has been and always will be what drives me to be a better person and a better parent myself. Hyungjun, my younger brother, has been such a great sibling, taking care of me even though I was the one who was supposed to take care of him and being my best friend as we lived through some tough times together. I am truly blessed to have such loving and wonderful family.
0-|Di Lj, O[HtXj, tc[A Xi gA[F-1_ -
AI
---
Al -| Lc-
Er E-10|
|0 A
-- Ai Q A24 .
hO
1
0 kI-E
X1[Xx L El-LI#X
13 "8" A[j 2X ^{4 Keep it up!
Most importantly, I would like to thank my wonderful wife Seonggyeong (Joy) Yun. My life would have been so much different without her love, encouragement, support, patience, and everything else. Seonggyeong fills my life with happiness and love, and I really look forward to spending the rest of my life with her. I also want to thank Arin, our baby daughter. She puts a smile on my face every day, and she has given me the opportunity to look at my life in a bigger context. Thank you and I love you Seonggyeong and Armn!
2 ]1 ld 0 |L- |E | L|4,
Aij
H
MD2Jinh~
-O7| SAfga=
OW-OF,LU
0|
%!
'@OI2h 0
HI[i{21 2[g d . 9OI.2h
OI.HHp4OWOI
TABLE OF CONTENTS
Chapter 1: Introduction... 9
1.1. Initial developm ent of patch clamp technique in vitro ... 9
1.2. Patch clam p recordings in vivo... 10
1.2.1. Blind patch clam p recordings ... 10
1.2.2. Im age-guided patch clam p recordings... 11
1.2.3. Challenges of patch clam p recordings in vivo... 12
1.3. Autom ated patch clam p recordings ... 12
1.3.1. Autom ated patch clam p recordings in vitro... 12
1.3.2. Autom ated blind patch clam p recordings in vivo... 13
1.3.3. Autom ated im age-guided patch clam p recordings in vivo ... 15
1.4. Gam m a oscillations ... 16
1.4.1. Gam m a oscillations in Alzheim er's disease ... 16
1.4.2. Effect of gamma oscillations on pathology of Alzheimer's disease...17
1.5. Thesis outline...18
Chapter 2: Automated cell-targeted patch clamp neural recordings in vivo...19
2.1. Introduction...19
2.2. Closed-loop real-time imaging algorithm for compensation of target cell movement during im age-guided patch clam ping ... 19
2.3. Im agepatcher operation ... 22
2.4. Im agepatcher perform ance ... 29
2.5. Discussion...32
2.6. M ethods ... 33
2.6.1. Experim ental m odel and subject details ... 33
2.6.2. M ethod details ... 34
2.6.3. Quantification and statistical analysis ... 48
2.6.4. Data and softw are availability ... 48
2.7. Supplem ental inform ation ... 49
Chapter 3: Using the autopatcher as a validation tool for temporal interference brain stim ulation...58
3.1. Introduction...58
3.2. Results...58
3.3. Discussion...66
3.4.1. Experim ental m odel and subject details ... 66
3.4.2. M ethod details ... 66
Chapter 4: Non-invasive gamma frequency sensory stimulation, a potential therapeutic for Alzheim er's disease, safely entrains the hum an brain ... 69
4.1. Introduction...69
4.2. 40 Hz sensory stimulation safely induces gamma frequency entrainment in young and older subjects ... 70
4.3. 40 Hz sensory stimulation increases gamma frequency synchronization in young and older subjects ... 72
4.4. Discussion...74
4.5. M ethods ... 74
4.5.1. Experim ental procedures ... 74
4.5.2. EEG ... 75
Appendix A : Im agepatcher user m anual ... 76
Chapter 1: Introduction
The mammalian brain is composed of more than billion neurons (Nowakowski, 2006), each of which are capable of performing computations and transmitting information in the form of ionic currents through membrane channels and resulting electrical potentials. These individual neurons are intricately connected to one another to form networks, and synchronized neuronal activity within these networks results in brain waves that oscillate at various frequencies
(Buzsiki and Draguhn, 2004). Understanding how neuronal activity and oscillations are related to higher order brain functions is one of the grand challenges in neuroscience. To tease out this relationship, tools that can accurately record and control neuronal activity are required.
The patch clamp technique, which utilizes a glass electrode to achieve electrical isolation of a patch of cell membrane, enables low-noise, high-temporal resolution recordings and
manipulations of these electrical signals. Although recent advancements in sensor proteins, actuator proteins, and optical tools have enabled "all-optical" approaches to electrophysiology (Hochbaum et al., 2014; Kiskinis et al., 2018; Zhang et al., 2018), it is challenging to record signals on a millisecond timescale using these approaches, which is easily achievable with patch clamp recordings. In addition, the development and application of new optical methods still require validation using patch clamp recordings.
The patch clamp technique has found its use in a wide range of applications that span from the measurement of ionic currents through transmembrane channel proteins of denervated frog muscle fibers at its inception (Neher and Sakmann, 1976) to the characterization of identified cell types in the mammalian brain (Chen et al., 2015; Gentet et al., 2010, 2012; Pala and Petersen, 2015; van Welie et al., 2016) to functional studies of individual cells in brain disorders (Arispe et al., 1996; Dragicevic et al., 2015; Ibaifez-Sandoval et al., 2007; Nieweg et al., 2015). Similar to other techniques in the biological sciences that have become standardized tools, initial improvements of patch clamp that were focused on optimizing manual operations are now being followed by innovations enabling automation for better ease-of-use, reproducibility, throughput, and standardization.
1.1. Initial development of patch clamp technique in vitro
When the patch clamp technique was first developed by Neher and Sakmann in 1976, they used heat-polished pipettes with a tip diameter of 3 - 5 im to measure the current from enzymatically cleaned cell membrane surface (Neher and Sakmann, 1976; Sakmann and Neher, 1984). To reduce noise due to the leakage shunt between the cell membrane and the bath, the pipette had to be pressed onto the surface of the cell membrane, forming an electrical seal with tens of MQ resistance between the pipette tip and the membrane (Neher and Sakmann, 1976). It was later discovered that light suction applied to the pipette upon contact between the pipette tip and the cell membrane can increase the seal resistance to above a gigaohm (i.e., result in a gigaseal; Hamill et al., 1981; Sigworth and Neher, 1980). This discovery was important, because it improved the recording quality of the patch clamp technique (Sakmann and Neher, 1984) and enabled the development of different recording configurations (Hamill et al., 1981). These configurations include cell-attached, whole-cell, outside-out, and inside-out, each of which is best suited for different applications.
The need for direct contact between the pipette tip and the cell membrane limited the use of the patch clamp technique to isolated cells that have their membranes exposed (e.g., cultured cells on a dish), until it was discovered that neurons in mammalian brain slices can be patched after brief treatment of the tissue slices with proteolytic enzymes (Gray and Johnston, 1985). However, since proteolytic enzymes may damage the proteins on the cell membrane of interest, different approaches were sought and developed. To enable direct contact between the tip of a patch pipette and the tissue-covered cell membrane, these approaches implemented either a two-step process in which a separate, "cleaning" pipette was first used to remove the part of the tissue covering the cell body of interest (Edwards et al., 1989) or a one-step process in which positive pressure was applied to a patch pipette as it was penetrating the tissue and approaching the cell membrane (Blanton et al., 1989). The integration of differential interference contrast (DIC) optics was another major advancement for enabling patch clamping in brain slices, as the improved imaging quality offered by DIC-based microscopy enabled visually-guided patching of soma as well as dendrites of targeted neurons in mammalian brain slices (Stuart et al., 1993). DIC-based visually-guided patch clamping has become a standard method for studying neurons in brain slices. Finally, it is also possible to combine cell type-specific fluorescent labeling (e.g., as available in transgenic mice) and fluorescence imaging (e.g., using an epifluorescence microscope) with patch clamping to investigate genetically-defined neuronal classes in vilro (e.g., Ting et al., 2014). 1.2. Patch clamp recordings in vivo
Although brain slices preserve synaptic connections immediate to the cells of interest and enable investigation of neuronal activity in relatively intact local circuits, more insightful understanding of neuronal function under normal physiological conditions and its significance for higher order functions, such as sensory information processing, perception, and memory, can only be achieved in in vivo preparations. The first successful in vivo whole-cell patch clamp recordings were demonstrated in the visual cortex of live, anesthetized cats (Pei et al., 1991). Although these recordings were with an "incomplete" seal (i.e., the seal resistance was 100 - 300 MQ), this work hinted at the possibility of obtaining successful patch clamp recordings in vivo. Several years later, it was demonstrated that whole-cell patch clamp recordings can be obtained from awake, head-fixed rodents (Lee et al., 2006, 2009; Margrie et al., 2002), establishing the patch clamp technique as an invaluable tool for correlating single neuron activity to higher order brain functions, such as sensing, movement, and other behaviors.
1.2.1. Blind patch clamp recordings
The first in vivo whole-cell patch clamp recordings were performed in a "blind" fashion. In this recording mode, the whole-cell configuration is achieved without any visualization of targeted neurons or patch pipettes. A patch pipette, with positive pressure being applied to its interior, is inserted into the brain to a target depth and then sequentially moved in small (2-3 tm) steps while monitoring the tip resistance. When the pipette tip makes contact with a cell membrane, an increase in the pipette resistance and a pulsation of the pipette current are observed. At this point, the pipette pressure is released and suction is applied to form a gigaseal, followed by short suction pulses leading to break-in of the membrane patch and the whole-cell configuration.
Advantages of the blind patch technique include its (theoretically) unlimited depth of recordings (since the depth of the targeted neurons is not limited by the optical constraints) and relatively large working area above the recording sites (Okada, 2012). While knowledge of the anatomical arrangement of various classes of cells in different brain areas allows one to enhance the probability of targeting specific cell types (e.g. layer V cortical neurons), on the whole, blind patching is not an ideal method for an investigation of specific cell types or cell classes (Margrie et al., 2003).
1.2.2. Image-guided patch clamp recordings
To overcome the limitation of the blind approach described above, in vivo two-photon laser scanning microscopy, which enables imaging of fluorescence signals relatively deep into the intact brain (Denk et al., 1994; Helmchen and Denk, 2005; Svoboda et al., 1997), has been integrated with patch clamping. In a method called "two-photon targeted patching" (TPTP; Komai et al., 2006; Margrie et al., 2003), cells that are fluorescently labeled by the generation of transgenic mice (e.g., Meyer et al., 2002) or by the injection of viral vectors (e.g., Callaway, 2005; Komai et al., 2006) are visualized simultaneously with a fluorescent dye-filled patch pipette, using a two-photon microscope. To distinguish the patch pipette from the cells, a fluorescent dye that has a significantly different emission spectrum compared to that of fluorescently labeled cells is used to fill the pipette. Schematic representation of a TPTP setup is shown in Figure 1.1 A (adapted from Figure 1 in Komai et al., 2006), together with example dual-channel images of a targeted cell and a patch pipette in Figure 1.1 B (adapted from Figure 2 in Margrie et al., 2003).
A
Pus'ik 01 Exoltation
:Pusewid%"0lops
Overlay repeatl a & 10
WIM Goot n (n)Fveeng (n)
Scan mirrrs
AI Oifter L (X1y)
LS High-resolutgo Rxadn bob
B
exicitation Chl Ch2 Overlay
Spectra
900 1000
Figure 1.1. Two-photon targeted patching (TPTP).
(A) Schematic of a typical TPTP setup (adapted from Komai et al., 2006). (B) Example dual-channel images of a targeted cell and a patch pipette (adapted from Margrie et al., 2003).
In another method termed "shadow-patching" (Kitamura et al., 2008; Hausser and Margrie, 2014), the extracellular space in the wild-type brain is perfused with a fluorescent dye from a patch pipette, which enables the visualization of unlabeled cells as "shadows" and thus image-guided navigation of the patch pipette to these cells. For both TPTP and shadow-patching, once the pipette is positioned sufficiently close to the targeted cell, confirmation of contact between the pipette tip and the cell membrane, formation of a gigaseal, and rupture of the membrane patch for the whole-cell configuration are performed using similar procedures as in the blind approach.
Compared to the blind approach, image-guided patching is limited to a relatively low depth (~500 pm) due to tissue scattering that limits the imaging depth of two-photon microscopy. Despite this limitation, image-guided patching has been shown to be extremely valuable for cell type-specific characterizations of neurons in the intact brain (Chen et al., 2015; Gentet et al., 2010, 2012; Pala and Petersen, 2015; van Welie et al., 2016). Recent advances in laser scanning microscopy that enable imaging deeper in the intact tissue (e.g., three-photon microscopy described in Horton et al., 2013), combined with the development of improved fluorescent tags (e.g., near-infrared fluorescent proteins described in Piatkevich et al., 2017), may further broaden the application of image-guided patching.
1.2.3. Challenges of patch clamp recordings in vivo
Despite its obvious value as a tool for characterizing the function of cell-types in circuits, the patch clamp technique has not yet become a routine method in biological sciences, because it requires a lot of skill and experience to perform. Consequently, in the case of in vivo patch clamp in particular, the technique has been adopted only by a relatively small subset of electrophysiologists. Even for these experts, in vivo patching has relatively low data yield (for the blind approach, ~20-30% of pipettes used for patching result in the formation of gigaseal and whole-cell configuration, according to Lee et al., 2009; Margrie et al., 2002; for the two-photon image-guided approach, it is -10-20%, according to Margrie et al., 2003), emphasizing the need for automated approaches to enable higher yield and throughput.
1.3. Automated patch clamp recordings
To facilitate the use of patch clamp as a standardized tool in biology, several attempts have been made to automate the sequential steps involved in using the technique, for both in vitro and in vivo preparations. Currently available automated systems and strategies have shown various levels of success at reproducing or surpassing the quality, yield, and throughput of recordings performed by human experimentalists.
1.3.1. Automated patch clamp recordings in vitro
Early efforts to automate the patch clamp technique have led to the development of planar devices for in vitro recordings from cultured cells (Dunlop et al., 2008; Okada, 2012). Instead of
the "top-down" approach used in the manual recordings for the pipette-target cell contact formation, these automated systems use a "bottom-up" configuration (Dunlop et al., 2008), in which each well of a multi-well plate has a small aperture on the bottom surface. After the target cells in suspension are introduced into the wells of these systems, a negative pressure is applied through the apertures to bring the cells close and subsequently form a gigaseal. Although these systems enable automated patch clamp recordings with much higher throughput compared to the manual approach, the planar configuration limits their use to cells that can be isolated and suspended in a solution (Okada, 2012).
Automated systems that utilize conventional patch electrodes and sample preparations have also been developed. For example, the multi-electrode patch-clamp system developed by Perin and Markram (2013) is built around a conventional patch rig and simplifies multi-cell patching in brain slices by automating positioning of patch pipettes close to targeted cells. The system also provides a pneumatic system controlled by a human interface device for repeatable and precise pipette pressure adjustments during patching. However, several key steps are still left for human experimenters to perform (e.g., the final approach to contact the cell with the pipette tip; triggering of pressure level adjustments for sealing and breaking in). With this system, twelve neurons could be patched simultaneously in brain slices of rats, far surpassing the number of cells that can be simultaneously patched using a fully manual approach (Perin and Markram, 2013).
A more recent system called the "Autopatcher IG" ("Image-Guided"; Wu et al., 2016) utilizes computer vision-based algorithms for automatic pipette tip calibration and fluorescent cell detection. It also automates pipette navigation to a targeted cell, seal formation, and break-in, providing a platform for fully automated patching of fluorescent cells in brain slices. The system could be used to automate patching of fluorescent layer V neurons in cortical slices of ThyI-ChR2-EYFP mice, obtaining similar recording quality compared to manual patching of neurons in brain
slices of wild-type mice. The average times spent for pipette positioning, gigaseal formation, and break-in were also significantly reduced compared to manual patching. For patching non-fluorescent cells in wild-type mice (which required manual cell detection using DIC optics), the system required manual adjustments of pipette positioning for 47.7% of the trials (21 out of 44 trials), mostly caused by inaccuracies in automated micromanipulator positioning or failure of the patching algorithm to form a gigaseal (Wu et al., 2016). For fully automated trials (which accounted for 23 out of 44 trials, or 52.3%) and semi-automated trials (i.e., trials requiring manual adjustments), the rates of achieving the successful whole-cell configuration (defined as the condition in which the cell membrane resistance is lower than 300 MU and the holding current is between -200 pA and 100 pA) were 82.6% and 52.4% respectively, while it was 3 5.3% for manual trials. The seal resistance, the membrane capacitance, the membrane resistance, the access resistance, and the holding current were not significantly different between automatic/semi-automatic patching and manual patching, while the average times spent for pipette placement onto the target cell, gigaseal formation, and break-in were significantly shorter for automatic/semi-automatic patching compared to manual patching.
1.3.2. Automated blind patch clamp recordings in vivo
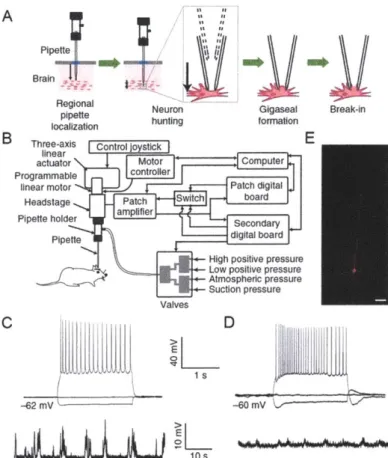
The first automated system for in vivo recordings was developed for blind patching (Kodandaramaiah et al., 2012). The LabVIEW-based system, called the "autopatcher", utilizes an
algorithm that divides the blind patching process into four distinct stages, as shown in Figure 1.2A (Figure 1(a) in Kodandaramaiah et al., 2012).
A
Pipette
Brain
Rieoa Neuron Gigaseal Break-in
localization formation
B Three-axis Control oystick E
actuator Motor Computer
Programmable controller
linear motor Patch digital
Headstage Patch Switch board
Pipette holder ampliffer Secondary
Pipette digital boardsr
High positive pressure Atmospheric pressure Suction pressure
Valves
C D
-62 mV -6 mV
Figure 1.2. The autopatcher algorithm, setup, and performance, as shown in Figure 1 of Kodandaramaiah et al. (2012).
(A) The autopatching algorithm. (B) Schematic of the autopatcher setup. (C) Example current-clamp recordings from an autopatched cortical neuron (top: recordings with 2-s long current injection pulses at -60, 0, and +80 pA; bottom: recording at rest). (D) Example current-clamp recordings from an autopatched hippocampal neuron (top: recordings with 2-s long current injection pulses at -60, 0, and +40 pA; bottom: recording at rest). (E) Example image of a biocytin-filled autopatched cortical neuron.
To run this algorithm, the autopatcher integrates a set of standard patch clamp equipment, such as the pipette holder, the headstage, the patch amplifier, and the patch digital board, with programmable linear motors (for automated pipette navigation), computer-controlled pneumatic valves (for closed-loop pipette pressure modulation), and a digital board (for real-time pipette resistance measurement). Using the autopatcher, successful whole-cell recordings (defined as showing less than 500 pA of current when held at -65 mV for at least 5 minutes) could be obtained from both cortical and hippocampal neurons in anesthetized mice at a rate of 32.9% (gigaseal cell-attached recordings were obtained 36% of the time), which is similar or superior to the success rates for manual in vivo patching reported in literature (Kodandaramaiah et al., 2012; Lee et al., 2009; Margrie et al., 2002). In addition, the quality of whole-cell recordings (assessed using access resistance, holding current, resting potential, and holding time) and the time required to obtain whole-cell recordings were similar between autopatching and manual in vivo patching
(Kodandaramaiah et al., 2012; Lee et al., 2009; Margrie et al., 2002). It was later shown that the autopatcher could also be used to obtain whole-cell recordings from awake, head-fixed mice, either immobilized or freely-running on a floating ball (Kodandaramaiah et al., 2016). Schematic representation of the autopatcher setup and example recordings obtained using the autopatcher are shown in Figure 1.2B-D (Figure 1 (b)-(d) in Kodandaramaiah et al., 2012).
The autopatching algorithm has also been used to enable simultaneous patching of multiple cells (i.e., multi-patching; Kodandaramaiah et al., 2018). The "multipatcher", composed of four interacting autopatching robots, could obtain dual and triple whole-cell recordings 30.7% of the time (which translated to the success rate of 31.7% when each pipette was considered individually, similar to that reported for the autopatcher) in the visual and somatosensory cortices of anesthetized mice, but it could not obtain quadruple recordings. When used in awake, head-fixed, body-restrained mice, the multipatcher led to at least one successful whole-cell recording 55.7% of the time and dual or triple recordings 17.5% of the time (which translated to the success rate of 17.3% when each pipette was considered individually).
Another automated system was recently developed for blind patching in awake, head-fixed, behaving mice (Desai et al., 2015). This MATLAB-based system not only automates the key steps in blind patching, such as penetration of the dura, moving of the pipette tip to a targeted region, searching of a neuron, sealing, and break-in, but it also enables automatic positioning of patch pipettes into craniotomies before the start of the patching process, by integrating a camera and an image-processing algorithm. Using this system, successful whole-cell recordings could be typically obtained in 5 minutes, at a rate of 17% in awake, head-fixed mice running on a wheel. The recording quality, as assessed using series resistance, was comparable to that obtained by manual patching, and the recording duration was 8 minutes on average (Desai et al., 2015).
To improve the yield of automated patch clamp recordings deep in the brain (e.g., in the thalamus), a robotic system that adds automatic lateral pipette navigation to the autopatching algorithm was developed recently (Stoy et al., 2017). As the pipette penetrates the brain to reach a desired region/depth for patching, the system detects an obstruction (e.g., a blood vessel) by detecting an increase in the pipette tip resistance. Once an obstruction is encountered, the pipette tip is retracted parallel to the pipette axis and the pipette tip resistance is subsequently recorded to establish a baseline value. The pipette tip is then moved laterally, lowered back to the depth at which the obstruction was detected, and the pipette tip resistance is checked again to determine if the tip resistance is less than 200 kQ above the baseline value (in which case, it is presumed that the tip has successfully circumvented the obstruction). If the pipette tip still shows a resistance increase above the threshold value, the steps described above are repeated until the resistance increase is below the threshold or the lateral excursion exceeds 50 pm. The system could be used to obtain whole-cell recordings from neurons in the thalamus, with access resistance, holding currents, and resting membrane potentials that were comparable to those from cortical neurons. The success rate for a whole-cell recording from a thalamic neuron was 10%, which was
significantly higher than that obtained without using the automatic lateral pipette navigation for dodging obstruction (Stoy et al., 2017).
One of the first attempts at automating image-guided patching in vivo has resulted in a system called "smartACT" (smart, Adaptive Cell Targeting), which enables automatic
positioning of a patch pipette close to a targeted cell (Long et al., 2015). In the initial stages of its workflow, in which the pipette tip is positioned above the brain surface, smartACT utilizes 3D volume rendering of a two-photon image stack to allow for the selection of the pipette tip and target cell locations by a user. Once the pipette tip is automatically moved into the brain and placed at a certain distance away from the target cell, the system acquires another image stack and performs image segmentation on it to achieve automatic detection of the pipette tip and the target cell. The detection of the pipette tip and target cell locations enables adaptive adjustments of the pipette trajectory, resulting in a more accurate positioning of the pipette tip near the target
cell. A user is then responsible for making the final approach to the cell, establishing contact with the cell membrane, gigasealing, and rupturing the cell membrane for whole-cell recordings.
Using smartACT, the pipette tip could be moved from outside the brain to near a target cell in a similar time as a human experimenter, and manual patching following this automated pipette positioning led to whole-cell recordings in the primary visual cortex of anesthetized mice, with
patched neurons showing electrophysiological characteristics similar to those in literature (Long et al., 2015). Although this system facilitates positioning of a patch pipette near a visually identified neuron, with the final patching process left for a human experimenter to complete, it does not fully address the need for manual skill and experience to perform image-guided patching in vivo.
1.4. Gamma oscillations
Regular and synchronized activity of neurons in the brain gives rise to network oscillations in various brain regions, such as the olfactory bub, thalamus, hippocampus, and neocortex (Bartos et al., 2007; Palop et al., 2007). These network oscillations show a wide range
of frequencies, from delta (0.5 - 3 Hz) and theta (3 - 8 Hz) frequencies to gamma (30 - 90 Hz)
and ultrafast (90 - 200 Hz) frequencies (Bartos et al., 2007). Previous studies have shown that fast-spiking, parvalbumin (FS-PV) expressing interneurons are important for the generation of gamma oscillations (Bartos et al., 2007; Palop et al., 2007), and that these oscillations are related to higher order brain functions, such as attention, memory formation, and recall (Bartos et al., 2007; Palop et al., 2007).
1.4.1. Gamma oscillations in Alzheimer's disease
Disruptions in gamma oscillations have been observed in several brain disorders, including bipolar disorder (Bagar, 2013), epilepsy (Herrmann and Demiralp, 2005), and schizophrenia (Spencer et al., 2003; Uhlhaas and Singer, 2010). In Alzheimer's disease (AD), which is the most common type of primary degenerative dementias (Herrmann and Demiralp, 2005), gamma activity has been shown to be disrupted compared to healthy controls. For
example, a study on spontaneous gamma oscillations during an eyes-closed state showed that the synchronization in the gamma frequency range was lower in AD patients compared to controls (Stam et al., 2002). In addition to the decreased gamma frequency synchronization, gamma responses elicited by sensory or cognitive stimulations were also shown to have a significant delay compared to healthy controls (Bagar et al., 2016).
Mouse models of AD, like human AD patients, show disrupted gamma oscillations in their brain. For example, human amyloid precursor protein (hAPP) transgenic mice, which have abnormally high AP levels in their brain (Verret et al., 2012), show reduced gamma activity as well as spontaneous epileptiform discharges during periods of reduced gamma oscillations (Verret et al., 2012). This potentially supports the observation that human AD patients have increased seizure activity compared to healthy individuals (Amatniek et al., 2006). These findings suggest that abnormal gamma oscillations may play a key role in the AD pathology. 1.4.2. Effect of gamma oscillations on pathology of Alzheimer's disease
Recently, it has been shown that gamma frequency entrainment with flickering lights (called gamma entrainment using sensory stimulus or GENUS) reduces amyloid load and modifies microglia, effectively reducing AD pathology in AD mouse models (Iaccarino et al., 2016). The study first demonstrated that, by driving FS-PV interneurons in hippocampal
subregion CAl at 40 Hz using optogenetic tools, amyloid-P (AP) accumulation was significantly reduced in the stimulated brain region in 5xFAD mice, a well-established AD mouse model. Interestingly, optogenetically driving other cell types at 40 Hz or driving FS-PV interneurons at frequencies other than 40 Hz did not result in the reduction of amyloid levels, suggesting that 40 Hz stimulation of FS-PV interneurons may be key for effective amelioration of AD pathology. Based on these findings, visual stimulation with LED lights flickering at 40 Hz, which was found to increase 40 Hz oscillations in the primary visual cortex of 5XFAD mice (Iaccarino et al., 2016), was explored to see if this non-invasive approach can also lead to a reduction of amyloid levels. Surprisingly, after exposing 5xFAD mice to flickering LED lights for 1 hour, AP levels were reduced by more than 50% in the visual cortex compared to 5xFAD mice exposed to a dark condition for 1 hour, and this reduction was specific to the 40 Hz flicker frequency (i.e., constant light, 20 Hz, 80 Hz, and random flicker frequency conditions did not show significant change from the dark condition). The hour-long stimulation also led to changes in microglia morphology
- namely, enlarged cell body and reduced primary process lengths, both of which are related to enhanced engulfment activity (Wang et al., 2015b) - as well as to increased co-localization of the microglia cell body with AP, suggesting improved amyloid endocytosis by microglia (Iaccarino et al., 2016). In addition, a long-term (i.e., 1 hour per day for 7 consecutive days) exposure to the LED lights flickering at 40 Hz led to not only less number of amyloid plaques but also smaller plaque sizes in the primary visual cortex. Tau phosphorylation, which is another AD-related pathology (Simi6 et al., 2016), was also significantly reduced in the visual cortex following the 7 days, 1 hour per day exposure to the 40 Hz flickering LED lights.
The discovery of the effect of visual GENUS was soon followed by yet another striking finding that gamma entrainment using auditory stimulation can also effectively attenuate AD-related pathology in AD model mice (Martorell et al., 2019). In this study, it was demonstrated that a train of auditory tones repeating at 40 Hz could increase 40 Hz oscillations, decrease amyloid load, induce microglial responses, and reduce tau phosphorylation in the primary sensory cortex (in this case, the auditory cortex), similar to the 40 Hz flickering light. Auditory GENUS also increased the number of reactive-like astrocytes, blood vessel diameter, and co-localization of AfP with lipoprotein receptor-related protein (LRP 1), all of which suggest an improved AP clearance through the vasculature (Martorell et al., 2019). Importantly, it was found that spatial and recognition memory was significantly improved in 5xFAD mice exposed
to 7 days of auditory GENUS (1 hour per day) compared to control mice (i.e., mice not exposed to auditory GENUS), showing for the first time that GENUS can positively impact cognitive
function. Unlike visual GENUS, the effect of auditory GENUS reached brain regions beyond primary sensory areas, inducing periodic modulation of spiking activity, reduced amyloid load,
glial changes, increased blood vessel diameter, and decreased tau phosphorylation in the hippocampus. Auditory GENUS could also modulate neural activity in the medial prefrontal cortex, but the amyloid load in this area was significantly reduced only when both visual and auditory stimulations were presented together for 7 consecutive days (1 hour per day). The effect of the combined stimulation was again frequency-specific, with frequencies other than 40 Hz failing to reduce amyloid levels in the brain of 5xFAD mice. Although these discoveries are promising, the effect of GENUS on the human brain, especially in terms of safety and feasibility of gamma entrainment using sensory stimuli, still needs to be studied to determine the possibility of translating the GENUS approach to people with AD.
1.5. Thesis outline
In Chapter 2 of this thesis, we present a closed-loop real-time imaging strategy that automatically compensates for cell movement by tracking cell position and adjusting pipette motion while approaching a target. We also describe the integration of this automatic pipette positioning with our earlier impedance-based cell detection strategy (Kodandaramaiah et al., 2012, 2016) in an algorithm and the development of a robotic system implementing this
algorithm. We show that our system can patch fluorophore-expressing neurons of multiple types in the living mouse cortex, without human intervention, with yields comparable to skilled human experimenters. In Chapter 3, we use the original autopatcher to obtain patch clamp recordings from cortical and hippocampal neurons in the intact mouse brain undergoing temporally
interfering electric fields-based non-invasive brain stimulation, demonstrating how an automated patch clamping system can facilitate the development and validation of a new tool in
neuroscience. In Chapter 4, we describe a device that we developed for delivering 40 Hz light and sound stimulations at intensity levels tolerable to humans. We then demonstrate that sensory stimulations from our device could induce steady 40 Hz entrainment on cognitively normal subjects, with concurrent visual and auditory stimulation resulting in stronger and more widespread entrainment than visual or auditory stimulation alone. We also show that our stimulations did not lead to any adverse side effects in our human subjects, suggesting that GENUS can be a safe and effective way of inducing widespread 40 Hz entrainment, which may have therapeutic effects in people suffering from AD.
Chapter 2: Automated cell-targeted patch clamp neural recordings in vivo' 2.1. Introduction
Targeted patch clamp recording of visually identified neurons (Dittgen et al., 2004; Kitamura et al., 2008; Margrie et al., 2003) is a powerful technique for electrophysiological characterization of cells of a given class in the living mammalian brain, and is in increasing
demand for its ability to link a cell's molecular and anatomical identity with its
electrophysiological characteristics in the context of specific behaviors, states, and diseases (Chen et al., 2015; Li et al., 2015; Pala and Petersen, 2015; Runyan et al., 2010; van Welie et al., 2016). However, the manual labor and skill required to perform visually guided patching in vivo have limited widespread adoption of the technique. Previously, we discovered that non-image guided (i.e., 'blind') patching in vivo could be reduced to an algorithm, and we accordingly built a robot, which we called the "autopatcher", that automatically performs blind patch-clamp recordings of single neurons in the intact brain by detecting cells based on changes in pipette tip
impedance (Kodandaramaiah et al., 2012, 2016). Since then, several attempts have been made to automate visually guided patch clamp recordings of targeted neurons. Although these attempts have enabled automatic positioning of a patch pipette near a visually identified neuron, all currently available systems either need a human to perform the final patching process itself (Long et al., 2015) or require human adjustment of the patching process for about half of the trials (Wu et al., 2016). We realized that a system that can achieve the whole-cell patch clamp configuration from a targeted cell without human intervention needs to address a key technical challenge: as a patch pipette moves towards a target cell for patch clamping, the cell moves as well, causing the pipette to miss its mark without manual adjustments of pipette motion that compensate for cell movement.
We therefore designed a new kind of algorithm, which we call "imagepatching", in which real-time imaging in a closed-loop fashion allows for continuous adaptation of the pipette
trajectory in response to changes in cell position throughout the patching process. We
constructed a simple robotic system and software suite implementing imagepatching that can operate on a conventional two-photon microscope with commercially available manipulators and amplifiers, and show that we can obtain in vivo patch clamp recordings from fluorescently
labeled neurons, of multiple cell types, in the living mouse cortex without any human
intervention, and with a quality and yield similar to or even exceeding that obtained by skilled human experimenters. Our imagepatching robot is easy to implement, and will help enable scalable electrophysiological characterization of identified cell types in intact neural circuits. 2.2. Closed-loop real-time imaging algorithm for compensation of target cell movement during image-guided patch clamping
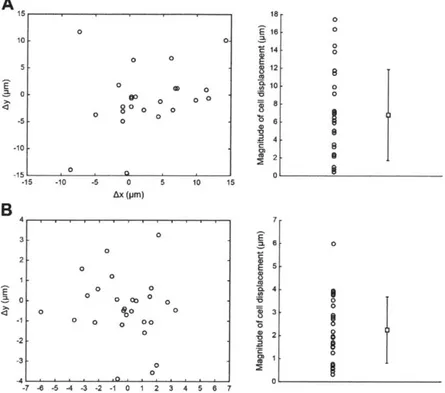
In the anesthetized mouse cortex, we found that moving a patch pipette by 300 - 400 tm from above the brain surface into layer 2/3 along the axial direction (i.e., parallcl to the pipette axis, 300 below the horizontal) resulted in a target cell displacement of 6.8 + 5.1 pm (mean
The contents of this chapter have been published in Neuron (https://doi.org/l0.1016/j.neuron.2017.08.01 1).
standard deviation used throughout; n = 25 cells in 6 mice; Figure S2. IA) in the transverse plane. In addition, we observed that pipette navigations in the vicinity of a targeted cell (i.e., pipettes moving by ~5 - 10 pm when starting ~20 - 30 im away from the cell) caused the targeted cell to move by 2.2 1.4 pm (n = 27 cells in 17 mice; Figure S2.1B) in the transverse plane. These findings suggested that to correctly place the pipette tip on a targeted cell and patch it in a fully automated fashion, the displacement of the target cell resulting from pipette movement needs to be compensated for as the pipette is advanced towards the cell. Accordingly, we developed a closed-loop real-time image-guided algorithm that involves repeated target cell imaging followed by centroid detection (Figure 2. 1A(i)) and pipette movement (Figure 2.1 A(ii) and (iii)) stages, to continuously compensate for cell movement as the pipette approaches the target. We found that with the closed-loop algorithm supporting pipette navigation to a targeted cell, the entire image-guided patching process could be reduced to a six-stage "imagepatching" algorithm (Figure 2. 1B; full flowchart in Figure S2.2). Imagepatching fuses closed-loop real-time image-guided pipette positioning with our earlier impedance-based cell detection strategy (Kodandaramaiah et al., 2012, 2016) to enable automated cell-attached or whole-cell patch clamp recording of visually identified cells in the intact mammalian brain.
A
Top view(i)
Image target cell
& detect cell centroid
(ii) (iii)
Move pipette in the transverse plane Move pipette
until directly above cell centroid down
I
~(ii) ~ (iii)
(i) Objetive
(iv)
Brain
Target cell Pipette tip Brain Closed-loop
detection detection penetration real-time
& selection image-guided
pipette positioning
*
(V) Gigaseal formation (Vi) Break-inComputer I -sWphirelaser PMT21 Two-photon
microscope Dichroic
PMT1 Dichroic
Digitizer -.. -X-Y platform
& Z focus
Autopatcher Switch +|Amplifier Headstagel motor control box
Autopatcher
digital board 4-axis manipulator
iaio lt High positive pressureFxtonae
Low positive pressure 0
Atmospheric pressure
Suction pressure Valves
Figure 2.1. Imagepatching: closed-loop real-time image-guided patch clamping in vivo. (A) The closed-loop algorithm for continuous cell centroid localization and pipette position adjustment while approaching the targeted cell (for step-by-step flowchart, see Figure S2.2). Green, patch pipette filled with fluorescent dye; red, fluorescent cell targeted for patching; black x, target cell centroid; black arrows, pipette movement.
(B) The six stages of the image-guided automated patching algorithm (for step-by-step
flowchart, see Figure S2.2). ACSF, artificial cerebrospinal fluid; red, fluorescent cells; green, patch pipette filled with fluorescent dye; light red, laser for two-photon imaging; black solid arrows, pipette movements; black dotted arrow, cell movement; yellow, target cell filled with the fluorescent dye from the pipette.
(C) Schematic of the imagepatcher hardware, composed of a conventional two-photon image-guided patch clamp rig and our previously developed autopatcher control box (Kodandaramaiah et al., 2012, 2016). Arrows indicate the direction of information flow. PMT, photomultiplier tube.
To implement imagepatching, we built a robotic system ("imagepatcher") on a
commercial two-photon microscope, which we controlled using ScanImage software (Pologruto et al., 2003) integrated with our MATLAB code that performs the real-time closed-loop image analysis. We chose ScanImage as the core software for the imagepatcher, since it works with two-photon systems from multiple vendors, and because its open code allowed us to incorporate real-time analysis of ScanImage-acquired images. The imagepatcher hardware shown in Figure 2.1 C was assembled by augmenting a conventional two-photon image-guided patch clamp rig with an autopatcher control box (Kodandaramaiah et al., 2012, 2016) that was modified to provide a wide range of pressure values (see Methods for details of this, as well as other technical implementation points summarized in the following section). We validated the
imagepatcher by using it to obtain targeted in vivo recordings from tdTomato-expressing cells in somatosensory and motor cortices of anesthetized Cre-dependent reporter mice, namely
parvalbumin (PV)-positive intereurons in PV-Cre x Ail4 mice and calcium/calmodulin-dependent protein kinase 1I isoform alpha (CaMKIIa)-positive pyramidal neurons in CaMKIla-Cre x Ail4 mice (Clarke, 1993; Hippenmeyer et al., 2005; Tsien et al., 1996). PV-positive and CaMKIIa-positive cells had different cortical densities (9.6 6.3 tdTomato-expressing cells per volume of 200 x 200 x 100 pm3 in 9 PV-Cre x Ail4 mice vs 47.0 31.8 tdTomato-expressing cells in this volume in 7 CaMKIIa-Cre x Ai 14 mice) and morphologies (example two-photon images of tdTomato-expressing cells in layer 2/3 somatosensory cortex of each mouse line are shown in Figures 2.4A and 2.4B), and thus allowed us to explore the degree of generality that the imagepatcher offers to an end user.
2.3. Imagepatcher operation
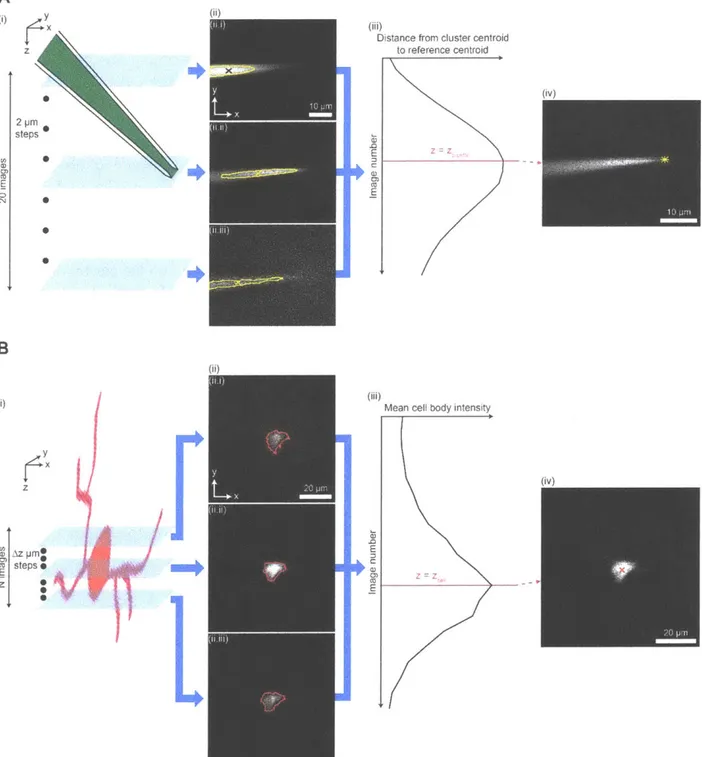
The imagepatcher starts by executing a target cell detection stage (Figure 2.1 B(i)), in which two-photon images of the mouse brain are acquired and then analyzed to identify fluorescent cells. From these candidate cells, the end user can select a neuron of interest using the imagepatcher's graphical user interface (see Appendix A: Imagepatcher user manual for details). The imagepatcher then moves on to the pipette tip detection stage (Figure 2.1 B(ii)), where a dye (e.g., Alexa 488)-filled patch pipette is brought into the field-of-view above the brain, and the tip of the patch pipette is automatically located. The pipette tip is identified using a
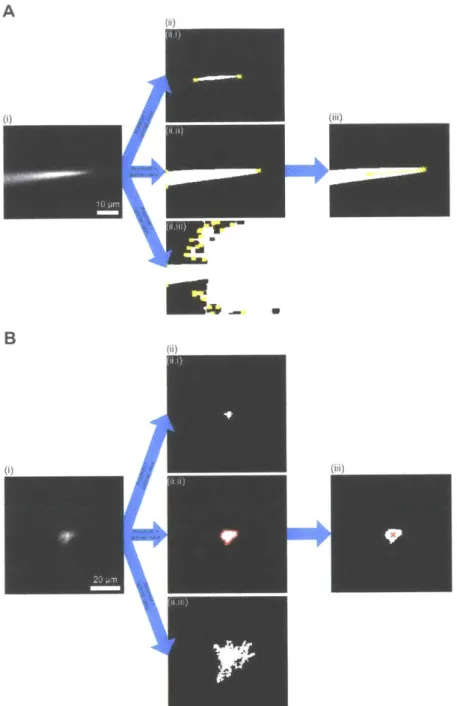
pipette tip detection algorithm (Figure 2.2A) derived from our finding that the cluster of bright pixels in the pipette image (Figure 2.2A(ii), area bounded by yellow outline), which represents the fluorescence from the dye inside the pipette, robustly changes its position as the focal plane of the microscope objective is moved downward from above the pipette tip. Accordingly, we developed a pipette tip detection algorithm to acquire a z-stack around the pipette tip (Figure 2.2A(i)) and to identify the image in the stack capturing the cluster of bright pixels that is furthest away from the far end of the pipette (represented by the centroid of the cluster in the topmost image in the stack; Figure 2.2A(ii.i), black x), assigning the z-coordinate of this farthest-cluster image as the z-coordinate of the pipette (Figure 2.2A(iii), zpipette). The portion of the pipette tip detection algorithm responsible for the identification of the pipette tip in the image at
Zpipette (Figure 2.2A(iv)) was developed based on the fact that an image focused on the pipette tip
shows a triangular object corresponding to the pipette shank converging to a point (i.e., the pipette tip). We therefore designed the pipette tip detection algorithm to find the cluster of bright pixels that captures three vertices of the pipette from the image at Zpipette (Figure S2.3A(ii.ii)),
which is then analyzed to identify the pixel corresponding to the pipette tip (Figure S2.3A(iii)). When tested on 16 z-stacks (2 ptm step size, 20 images, 17x zoom), each of which captured the tip of a separate Alexa 488-filled patch pipette (angled at 30' below the horizontal) at a distinct position within the stack, the pipette tip detection algorithm was capable of accurately extracting the pipette tip, with the tip location determined by the algorithm deviating from the visually assessed tip position by -1.0 0.8 [tm, -0.2 0.4 ptm, and 1.0 2.4 ptm in the x, y, and z directions respectively. The algorithm's performance was similar for patch pipettes at different angles below the horizontal (see Methods, "Performance of the pipette tip detection algorithm at angles other than 300 below the horizontal" for details).
A z 0) 0 2 pm steps 0r) C) 0l 0 Ail, (i)
Distance from cluster centroid to reference centroid E Z Z E
N*
B (,) 0 AZ0) COE
st5 r y pm eps.eL
Mean cell body intensity
CD
E
E
Figure 2.2. Key algorithms for closed-loop real-time image analysis.
(A) Steps of the pipette tip detection algorithm. (i) A z-stack with 20 images and 2 pm step between consecutive images is acquired around a pipette filled with a dye (e.g., Alexa 488, green). (ii) Each image in the z-stack is analyzed to identify the cluster of bright pixels (area bounded by yellow outline, corresponding to the fluorescence from Alexa 488 inside the pipette) and the centroid of the cluster (x). The centroid in the topmost image of the z-stack ((ii.i), black x) is used as a reference location corresponding to the far end (i.e., end opposite to the pipette tip) of the pipette. Images 1 (ii.i), 10 (ii.ii), and 20 (ii.iii) of the z-stack, numbered from top to
bottom, are shown as examples. (iii) The distance between the cluster centroid (x in (ii)) and the fiv)
reference centroid (black x in (ii.i)) is calculated for each image in the z-stack. The image at which this distance is the largest is identified as the image focused on the pipette tip (magenta line). The z-coordinate of the focused image corresponds to that of the pipette tip (zpipette). (iv) The image focused on the pipette tip is analyzed to yield the location of the pipette tip in the transverse plane (yellow star). For image analysis steps used to locate the pipette tip in the
transverse plane, see Figure S2.3A.
(B) Steps of the cell position detection algorithm. (i) A z-stack is acquired around a tdTomato-expressing cell (red), with N images and Az step between consecutive images (N = 24, Az = 3 pm for cell position detection in the brain penetration stage; N = 10, Az = 2 gm for cell position detection in the closed-loop real-time image-guided pipette positioning stage). (ii) Each image in the z-stack is analyzed to detect the boundary of the cell body (red outline). Images 8 (ii.i), 12 (ii.ii), and 16 (ii.iii) of the z-stack, numbered from top to bottom, are shown as examples. (iii) The mean intensity of pixels representing the cell body (i.e., pixels surrounded by the detected boundary in (ii)) is calculated for each image in the z-stack. The image at which this mean intensity is the highest is identified as the image focused on the centroid of the cell body (magenta line). The z-coordinate of the focused image corresponds to that of the cell centroid (zceI). (iv) The image corresponding to the z-coordinate of the cell centroid is analyzed to yield the centroid position in the transverse plane (red x). For image analysis steps used to detect the boundary and the centroid of the cell body, see Figure S2.3B.
The pipette tip location determined during the pipette tip detection stage is used by the imagepatcher to compute the ideal trajectory to the target cell at the start of the brain penetration stage (Figure 2.1 B(iii)), and also to calculate the pipette tip position in subsequent stages of imagepatching; we decided not to utilize the pipette tip detection algorithm (Figure 2.2A) to locate the pipette tip from the brain penetration stage onward, because a pipette that entered the brain without contamination ejected a plume of fluorescent dye that obscured the exact location of the pipette tip, which made it difficult to robustly resolve the pipette tip using an image-based algorithm. To enter the brain, the imagepatcher applies high positive pressure (600 mBar) to the pipette and moves it along the calculated trajectory at about 600 Rm/s (i.e., at the maximum speed that our 4-axis micromanipulator can generate under software control; the same speed is used to move the pipette throughout the imagepatcher operation) until the pipette tip is within 75 gm from the initial target cell location. At this point, the pipette pressure is quickly reduced to 300 mBar to prevent excessive background fluorescence, but if little or no dye is ejected around the pipette tip, or a drastic resistance increase is observed, the pipette is deemed contaminated and brief pulses of positive pressure (>300 mBar) are applied to clean the pipette tip (as
described in Komai et al., 2006). The pressure value of the pulse is increased until the pipette tip is cleared, but no more than 800 mBar is applied as a pipette ejecting the dye at this high
pressure can cause excessive background fluorescence that interferes with cell detection in subsequent steps of imagepatcher operation. If the clogged state persists even after two pulses of high positive pressure, the contaminated pipette is automatically retracted. The imagepatcher applies a pipette pressure of 300 mBar while moving the clean pipette to the vicinity of the target, as we found this pressure value to be high enough to keep the pipette tip clean inside the brain, but not so high as to cause a lingering flood of dye that would lead to excessive
background fluorescence (see Methods, "Derivation of pipette pressure for brain entry and cell approach" for details).
Once the pipette tip is within 50 pm from the target cell's initial location, the
imagepatcher re-images and re-detects the target cell to account for cell movement resulting from pipette entry into the brain, using the cell position detection algorithm described in Figure 2.2B. The algorithm was derived based on the fact that in fluorescence microscopy, a fluorescent object looks the brightest when it is in focus (i.e., an image of a fluorescently labeled cell
captures pixels corresponding to the fluorescence of the cell, and these pixels have higher intensities in an image focused on the cell compared to out-of-focus images). We thus built the cell position detection algorithm to detect the cell body in each image of a z-stack of the target cell (Figure 2.2B(ii)) and then to identify the image with the highest mean pixel intensity within the cell body (Figure 2.2B(iii), magenta line), which yields the z-coordinate of the target cell (Figure 2.2B(iii), Zeell). We also designed the cell position detection algorithm to identify the centroid (i.e., center of mass) of the cell body in the image at zeell (Figure 2.2B(iv), red x), which is then assigned as the cell position in the transverse plane, because the cell body centroid is where investigators manually performing image-guided patching would aim with the tip of a patch pipette (Hausser and Margrie, 2014; Komai et al., 2006). When tested on 21 z-stacks (2 or 3 ptm step size, 20 or 24 images, 17x zoom; from 5 mice), each capturing a PV-positive neuron at a different position within the cortex, the cell position detection algorithm correctly yielded x, y, and z coordinates of the cell centroid in all 21 stacks (visually assessed). Following cell position detection, the pipette is moved so that its tip is 25 im above the updated target cell centroid, and the pipette tip is checked again for contamination.
With the clean pipette in place, the closed-loop real-time image-guided pipette positioning stage (Figure 2.1 B(iv)) begins by lowering the pipette pressure (to 100 mBar) to prevent the target cell from being blown out of place and by performing another cell position detection (as in Figure 2.2B) to update the location of the target cell. The imagepatcher then repeatedly finds the target cell centroid (Figures 2. lA(i) and 2.2B(iv)) and repositions the pipette in the transverse plane according to the offset from the pipette tip to the cell centroid (Figure 2. 1A(ii)) before each downward 3 im z-step towards the target cell (Figure 2.1 A(iii); example data from multiple steps of this closed-loop operation in Figures 2.3A and 2.3B, with
corresponding imagepatching impedance trajectory in Figure 2.3C). Similar to manual image-guided patching in vivo (Hausser and Margrie, 2014; Komai et al., 2006; Margrie et al., 2003), both visual (pipette tip within the boundary of the target cell soma; Figure 2.3A(iii)) and electrical (resistance increase that exceeds a certain threshold; Figure 2.3C(iii)) parameters are repeatedly checked while the pipette advances towards the target cell to determine when the pipette tip touches the target cell membrane. The imagepatcher maintains the pipette pressure at
100 mBar until the pipette tip makes contact with the cell membrane, because we found that this pressure helped prevent pipette tip clogging and allowed a detectable change in pipette resistance to be observed when the pipette tip touched the cell membrane (as in Figure 2.3C(iii)) while not blowing the target cell out of place and not resulting in excessive background fluorescence (see Methods, "Derivation of pipette pressure for brain entry and cell approach" and "Optimization of cell-pipette contact detection, gigaseal formation, and break-in" for details). Once the pipette tip makes contact with the cell membrane, the imagepatcher dynamically changes the pipette pressure from 100 mBar to 30 mBar to prepare for gigaseal formation. We found that this
lowering of pressure resulted in reduction of, and fluctuation of, the amplitude of current pulses that were observed in response to the application of voltage steps to the pipette tip,