OATAO is an open access repository that collects the work of Toulouse
researchers and makes it freely available over the web where possible
Any correspondence concerning this service should be sent
to the repository administrator:
[email protected]
This is an author’s version published in: http://oatao.univ-toulouse.fr/24274
To cite this version:
Atgié, Marina and Masbernat, Olivier and Roger, Kevin
Emulsions Stabilized by Gum Arabic: Composition and
Packing within Interfacial Films. (2019) Langmuir, 35 (4).
962-972. ISSN 0743-7463
Official URL:
https://doi.org/10.1021/acs.langmuir.8b02715
Emulsions Stabilized by Gum Arabic: Composition and Packing
within Interfacial Films
M. Atgié, O. Masbernat, and K. Roger
*
Laboratoire de Génie Chimique, Université de Toulouse, CNRS, INPT, UPS, Toulouse 31432, France
*
S Supporting InformationABSTRACT: Gum arabic is a heterogeneous natural hydro-colloid commonly used in the agro-food industry to provide metastability to oil-in-water emulsions. Since aqueous solutions of gum arabic contain a complex mixture of protein/polysaccharide conjugates, the composition of inter-facial films is expected to differ from the bulk composition. Here, we investigate the composition of interfacialfilms in oil/ water emulsions stabilized by gum arabic at various concentrations, pH and salinity. Using both size exclusion and hydrophobic interaction chromatography separations, we show that the interface is enriched in protein-rich species displaying a broad range of sizes. These species are irreversibly adsorbed as monolayers at the oil/water interface. We observe
that the surface coverage density, or packing, of the adsorbed species at oil/water interfaces drastically increases with both the increasing gum concentration and decreasing ionic repulsions, through increasing the ionic strength or decreasing the pH. Strikingly, these packing changes correspond to only minor composition changes in the adsorbed layer. We thus conclude that the key parameter modified in different formulations is the conformation of the adsorbed species rather than their composition distribution. Thesefindings can be readily used to adjust the amount of gum arabic necessary to produce metastable emulsions.
■
INTRODUCTIONGum arabic, or acacia gum, is an exudate originating from acacia trees in sub-Saharan countries, which has been used for centuries for its binding and stabilizing properties.1Nowadays, it is mainly used to stabilize dispersed systems such as oil-in-water emulsions, in particular,flavored beverages.2
This natural hydrocolloid, highly soluble in water, is composed of a complex mixture of proteins and polysacchar-ides. Many studies have been devoted to elucidate the chemical composition and colloidal structure of gum arabic. In contrast, very few studies have investigated the actual composition of adsorbed gum arabicfilms and its interplay with formulation parameters and emulsion metastability.
Randall et al. analyzed the aqueous phase from a gum-stabilized emulsion by size exclusion and observed that the high molecular weight macromolecules preferentially adsorbed at the interface. Using the same procedure, Padala et al. showed that all classes of molecular weights could adsorb.3,4By preparing emulsions using recovered gum arabic fractions from size-exclusion chromatography (size) or hydrophobic inter-action (protein content), it was shown that using a combination of both small and high molecular weight species provided the best emulsion metastability.5 Studies were conducted to evaluate the surface concentration of gum-stabilized droplets but without evaluating thefilm composition. It was observed that physico-chemical parameters such as lower pH or higher salinity promoted interfacial adsorption3,6,7
but no systematic study was performed to evaluate the related composition changes at oil/water interfaces.
In the present work, we present a method to systematically characterize the interfacial composition in molecular weight and hydrophobicity, in respect to the corresponding bulk solutions. Surface coverage densities of gum arabic-stabilized emulsions as a function of emulsion formulation (gum concentration, pH and ionic strength) are compared. Compositions of the interface as a function of these parameters are then discussed. Finally, we show how these findings can lead to a more rational design of gum arabic-stabilized emulsions and to a notable reduction of its amount in the formulation.
■
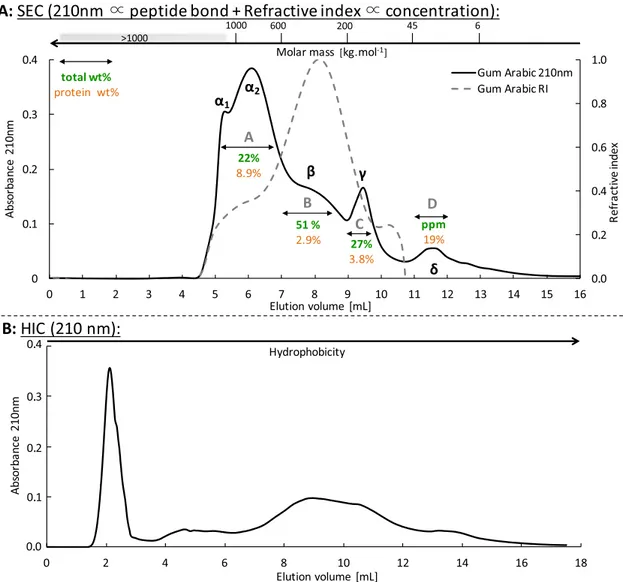
RESULTS AND DISCUSSIONChromatographic Characterization of Gum Arabic Solutions. In this section, we sum up the main results of a chromatographic analysis from a previous study dedicated to gum arabic in solutions that are relevant to the present work.16 Figure 1A displays the size-exclusion chromatogram of our gum arabic sample (Caragum International) using both UV detection at 210 nm, which is mostly sensitive to the peptide bond,8,9 and refractive index detection, which is proportional
to the concentration. Here, we suppose a constant refractive index increment (dn/dc) for all gum arabic species. We verified this hypothesis by comparing the weight fractions for fractions A, B, and C obtained through a calculation from the refractive index chromatogram and from the direct measurement using preparative chromatography. The two methods lead to similar figures within the experimental error margin (FA: 20 vs 22 wt. %, FB: 55 vs 51 wt.%, FC: 25 vs 27 wt.%), which validates the hypothesis and confirms that the refractive index chromato-gram is a good measure of relative concentrations.
This chromatogram is similar to previously published gum arabic chromatograms,10,11,3which ensures the representability of our gum arabic batch. We observe that gum arabic displays a broad range of molecular weight ranging from 6 kg·mol−1to more than 1000 kg·mol−1. From the refractive index detection, we observed that the gum is mainly composed of intermediate molecular masses, whereas the higher molecular masses (peak α1 and α2) represent around 15% w/w of the gum. This is
consistent with the weight fractions of the different gum arabic fractions obtained through a similar preparative chromato-graphic separation (A−D fromFigure 1). The protein weight
fractions were also determined and display variations ranging from 2.9 to 19 wt.% between the different fractions.
The protein content measured in the four fractions (from size-exclusion separation: A−D) suggests that the various species of gum arabic may display amphiphilicity. We have then used hydrophobic interaction chromatography to probe the hydrophobicity of gum arabic, which corresponds to its interaction with a phenyl grafted column. Unlike previous works,5,11,12 a continuous gradient of sodium chloride concentration was imposed along the column height to avoid artefacts during abrupt salinity changes. The resulting chromatogram is displayed in Figure 1B. The first peak is actually the convolution of several peaks as shown inFigure 3D, with the first convoluted peak corresponding to species that are not retained by the phenyl grafted column and the following convoluted peaks to species that are only weakly retained. This indicates the presence of a rather homogeneous hydrophilic population in terms of amphiphilicity. In contrast, the rest of the chromatogram displays a broad elution profile, which emphasizes the heterogeneity of the gum as a continuum of species of increasing hydrophobicity.
Figure 1.(A) Size-exclusion chromatogram of a 30 g·L−1aqueous solution of gum arabic. Thick line: UV detection at 210 nm. Dotted line: refractive index detection. Weight percentages of the recovered fraction using a preparative size-exclusion column (same columnfilling, larger dimensions) are indicated as well as the protein content for these fractions. Scale for molecular weights as a function of elution volumes is displayed on the top of the chromatograms. (B) Hydrophobic interaction chromatogram of a 30 g·L−1aqueous solution of gum arabic using a UV detection at 210 nm. Less hydrophobic species of the gum are not retained by the column and species eluted last are the most hydrophobic ones.
We then performed a two-dimensional chromatographic separation consisting of,first, a size-exclusion chromatography separation, followed by a hydrophobic interaction chromatog-raphy separation, using the same columns as for the data displayed in Figure 1.16 We evidenced that fractions from either method encompassed a diversity of families and that these two properties are thus not correlated. Also, in contrast with previous interpretations based on the finite protein amount within each fraction, we showed that some families include none or a negligible protein amount and should not display amphiphilicity. These hydrophilic populations corre-spond to species of intermediate molecular weight (elution volume between 5.5 and 9 mL).
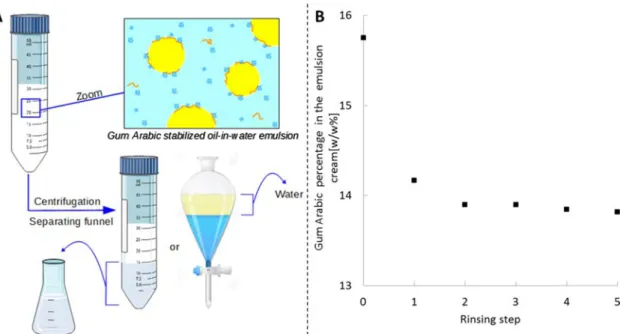
Is the Adsorption of Gum Arabic Species an Equilibrium Process? When an aqueous solution of amphiphilic species is placed in contact with an oil phase, some species are expected to adsorb at the interface. This adsorption may proceed along a thermodynamic pathway and is then controlled by adsorption equilibrium constants, which yields adsorption isotherms. This is typically the case for short chain surfactant molecules.13 Adsorption may alternatively proceed through a kinetic pathway, which will depend on both adsorption equilibrium constants and transport properties during the interface formation. This corresponds for instance to the case of particle-stabilized emulsions.14,15In both cases, the interfacial composition is expected to differ from the bulk composition when species of different amphiphilicity and sizes are present in water. However, distinguishing between thermodynamically and kinetically controlled adsorption is crucial to determine the interfacial composition. To this purpose, we prepared an oil/water emulsion, which was centrifuged to collect a concentrated cream. We then rinsed this cream several times and measured, after each rinsing step, the amount of gum arabic species that swept away from the cream (Figure 2). Around 1.4% of the initial gum amount is collected after the first rinsing, which corresponds to species that were trapped in the aqueous phase in between oil droplets. Subsequent rinsing yields negligible quantities of gum arabic.
Yet, we observed through ultra-centrifugation experiments that rinsed emulsions displayed an even higher metastability than the original emulsion, demonstrating that the adsorbed species are not leached out by dilution as would be expected for an equilibrium adsorption process. Removing both water and oil from the rinsed emulsion yields the total mass of gum arabic adsorbed, which corresponds to 15.8% of the total gum arabic before rinsing and to a constant value of 13.8% after the second rinsing. We can thus conclude that oil/water interfaces of gum arabic-stabilized emulsions are mostly populated by irreversibly adsorbed species. This property is routinely used in the beverages industry, where arabic gum is used to stabilize concentrated aroma oil/water emulsions that will be highly diluted in thefinal beverage.
However, we also observed that upon intense centrifugation conditions, droplet coalescence could occur, leading to a partial desorption of some species. Reducing the interfacial area may thus force some species to desorb, which is consistent with microscopy observations showing that emulsion droplets remain spherical. From a thermodynamic standpoint, this means that the adsorption energy of some adsorbed species is smaller than the gain in relaxing droplet’s shape upon coalescence. The average area occupied by gum species is thus bound by a maximal value.
How Does the Film Composition Compare with the Bulk Composition? Since the adsorption of gum arabic species can be considered as irreversible, the interfacial composition will be preserved upon dilution. Taking advantage of this property, we have designed an experimental method to determine the interfacial composition of gum arabic-stabilized emulsions (as shown in scheme in Figure 2). From a given emulsion, the nonadsorbing species were collected by recovering the emulsion aqueous phase. The remaining emulsion cream was rinsed several times to recover all species that are still potentially present in the aqueous phase of the cream and not strongly adsorbed. These rinsing phases were added to the emulsion aqueous phase. After dialysis and freeze-drying, a dry extract containing the nonadsorbed species was
Figure 2.(A) Scheme of the rinsing procedure. (B) Evolution of gum arabic mass percentage in the emulsion cream (compared to the amount of gum in the emulsion, 100% is the amount used in the emulsion formulation) when rinsing an emulsion cream as a function of the number of rinsing steps. 0 corresponds to the amount of gum in the emulsion cream without rinsing.
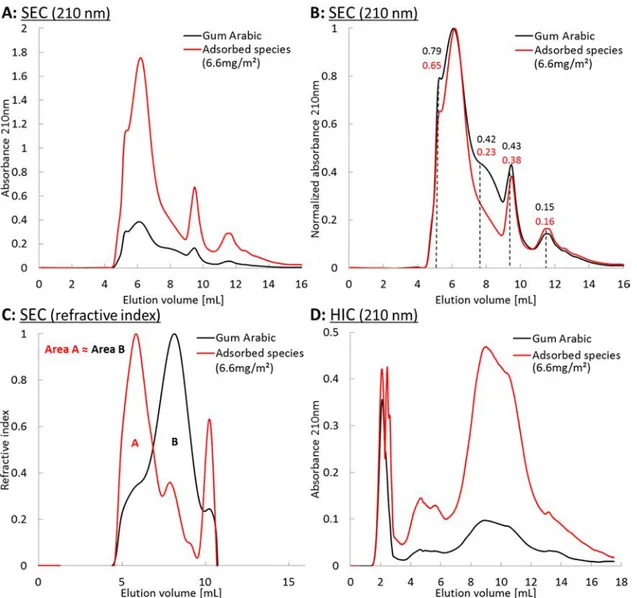
obtained. The expected chromatogram of the adsorbed species was then derived by subtracting the chromatogram of the nonadsorbing species from the chromatogram of gum arabic. Figure 3displays the comparison of gum arabic with adsorbed species chromatograms rescaled to the same weight fraction in water.
Figure 3A shows that the chromatogram of the adsorbed
species is much more intense than the chromatogram of gum arabic with UV detection at 210 nm. This trend is also observed at 280 nm (see Figure 3 in the Supporting Information). This contrasts with the refractive index signal which gives the same area for both samples, which is expected since both solutions have the same concentration in gum species. The difference in absorbance between the adsorbed molecules and gum arabic shows that for a given elution volume several species with different molar extinction coefficient ε are present. This is consistent with our previous results from two-dimensional chromatographic separation of gum arabic. Indeed, species collected from a given elution
volume in the size-exclusion separation yielded a continuum of elution volumes in hydrophobic interaction separation. Interestingly, the area ratio between the two chromatograms using UV detection at 210 nm, and displayed in Figure 3A, equals to 4.1, which is similar to the protein content ratio of 3.7 between the two samples. This is consistent with the sensitivity of UV detection at 210 nm to proteins via the peptide bond. We can thus conclude that the interface is largely enriched in the protein-rich species. To assess the size distributions of the adsorbed species compared to the bulk solution, we normalized both chromatograms to ease peak comparison, as displayed inFigure 3B. Strikingly, the overall features are similar, which means that the interface remains populated by species of diverse sizes, a result in agreement with the study of Padala and co-workers but contradicting the well-spread idea that only the largest species adsorb at the interface.4,3 However, large differences between the native solution and the interface are visible on the refractive index signal, as shown in Figure 3C. The predominant fraction of
Figure 3.Comparison of gum arabic species (black line) and gum arabic species adsorbing at oil−water interface (red line). (A) Size-exclusion chromatograms with UV detection at 210 nm. (B) Both chromatograms from (A) are normalized by the highest intensity to compare intensity ratios between different peaks. Numbers are peak ratios with respect to the highest peak. (C) size-exclusion chromatograms with a refractive index detection and (D) hydrophobic interaction chromatograms with a UV detection at 210 nm. Adsorbed species chromatograms are obtained by subtraction of the nonadsorbed species chromatograms from the total gum arabic chromatogram and rescaled to a concentration of 30 g·L−1to compare the molecular mass composition with that of native gum arabic solutions (same area on refractive index chromatogramsfigure (C)).
gum arabic, which corresponds to intermediate elution volumes, and thus molar masses, is significantly depleted at the interface. Indeed, this fraction contains the majority of the most hydrophilic species that do not display amphiphilicity. On the contrary, the interface is enriched in species corresponding to high molecular masses (>1000−600 kg· mol−1, elution between 4.5 and 7 mL) and small molecular masses (250−45 kg·mol−1, elution around 9.5 and 11.5 mL). As shown previously, these fractions contain most of the protein amount of gum arabic. As mentioned in theMaterials and Methodssection, refractive index detection could not be performed after an elution volume of 10.5 mL. InFigure 4C, the mass percentage corresponding to the peak at 11.5 mL on the UV chromatogram was thus not detected. Nevertheless, its absorbance at 210 nm (and 280 nm) is not negligible and is amplified in the case of the adsorbed species. The preparative separation of gum arabic has confirmed that this peak represents a very low weight percentage with a non-negligible UV absorption. The fact that its intensity increases in the case of the adsorbed species, thus indicates a very high protein content (above 50 wt %). We can estimate that it represents around 1−2 wt % of the adsorbed species.
According to the molecular weight universal calibration and the concentration repartition from the refractive index profile, we estimated that in our emulsions, the oil droplet surface was populated of approximately 19−32% in the number of the smallest species (45-6 kg·mol−1), 37−43 and 12−16% in the number of intermediate molecular weight macromolecules (of respective molecular weight of 250−45 and 600−250 kg· mol−1) and 18−22% of the largest species (>1000−600 kg· mol−1). This estimate shows that gum arabic-stabilized droplets are not primarily covered by large protein− polysaccharide conjugate moieties as discussed in previous studies,12 but by a larger proportion of smaller molecular weight macromolecules from the gum.
Comparing the hydrophobic interaction chromatograms of gum arabic and recovered species from the interface exhibits important differences as shown in Figure 3D. The first important observation from this comparison is that the species recovered from the interface present a chromatogram of much higher intensity than the gum arabic at the same concentration. This observation is in accordance with the trend observed in size-exclusion chromatography and can be ascribed to the larger protein content of this fraction compared to that of native gum arabic. The second observation is that the intensity of thefirst peak, corresponding to the less hydrophobic species, which are not retained by the column, is less intense in the case of the species adsorbing at the interface but not negligible. Since the emulsion cream was rinsed, this shows that even weakly hydrophobic species may adsorb irreversibly at the interface. The third observation is that the interface is composed of a broad range of hydrophobicity, which
corresponds to a broad range of elution volumes on the hydrophobic interaction chromatogram.
To summarize, we showed that the interfacial adsorbedfilm is heterogeneous in molecular mass and hydrophobicity. The high and small molecular masses preferentially adsorb at the interface and these species present a broad range of hydrophobicity. We suggest that the interface is populated by species that all possess a polypeptide chain, whereas pure polysaccharides remain in solution. It can be concluded that the interfacial composition largely differs from the bulk solution but is far more complex than what is routinely assumed, for instance, a layer of large arabinogalactan−protein conjugates (AGP).
Can We Define a Mean Area per Adsorbed Species in This Adsorption Process? The chromatographic analysis has shown that in the emulsification conditions investigated, amphiphilic species are in large excess. Chromatograms of the nonadsorbed species show that the different classes of preferentially adsorbing macromolecules are far from being fully consumed. In a classical adsorption process, for instance involving a surfactant solution, it is expected that a maximal surface density, which corresponds to a mean area per stabilizer, is reached. We decided to measure this quantity as a function of several physico-chemical parameters used in an emulsion formulation (pH or ionic strength, gum concen-tration). In practice, these parameters are coupled to one another, since gum arabic polysaccharides are weak poly-electrolytes, due to glucuronic moieties. Therefore, varying the gum concentration will also result in changing both pH and ionic strengths. Simple comparisons thus require to maintain two parameters approximately constant.
Surface densities were calculated from the known amount of gum adsorbed at the droplet surfaces (from the interfacial separation procedure) and the volume/surface diameter of the emulsion (Sauter diameter), which are presented inTable 1. They are of the same order of magnitude as values from previous studies in which emulsions were not rinsed.3 Estimates of mean area per head are also given using a mean molar mass of 670 kg·mol−1 from the refractive index chromatograms for the adsorbed species. However, these values should be read with caution as averages over a very disperse species distribution.
Padala et al.3 argued that such large values of the surface densities compared to small proteins could be explained either by conformational changes or multilayers. The multilayer hypothesis would require a strong self-association of gum species to withstand rinsing. Although self-association has indeed been observed by us and others,16−18 rheological studies also indicate that such structures do not resist to shear and collapse under moderate mixing conditions.19,20 There-fore, we expect that the rinsing procedure removes any Table 1. Protein Content, Total Mass of Gum Adsorbed, Surface ConcentrationΓ and Mean Area per Adsorbed Species a0as a
Function of pH and Ionic Strength
CGA[g·L−1] pH CNaCl[molc] ionic strength [mol·L−1] protein content [wt %]a Madsorbed[mg] d32[μm] Γ [mg·m−2] a0[nm2]
A 50 3.5 0 4.81× 10⁻² 12.2 180± 15.1 12.8± 0.23 9.6± 0.82 116± 10
B 16 3.5 0 1.67× 10⁻² 10.8 128± 13.1 12.3± 0.26 6.6± 0.69 169± 18
C 16 5 2× 10⁻² 3.70× 10⁻² 9.5 145± 13.6 11.8± 0.22 7.1± 0.67 157± 15
D 16 5 0 1.7× 10⁻² 9.2 110± 10.1 12.7± 0.22 5.8± 0.54 193± 17
aProtein contents were calculated from measured nitrogen content using a 7 conversion factor based on the amino acid composition of the gum
potential multilayer structure. Differences in surface densities can thus be ascribed to conformational changes.
From Table 1, we can observe that the surface density
depends on both the amount of gum and pH and ionic strength. Comparing emulsions C and D yields the effect of ionic strength, whereas comparing emulsions B and D yields the effect of pH. Overall, we can conclude that the surface concentration value is driven by the magnitude of ionic repulsions. The surface density thus increases when the ionic strength increases and the pH decreases, which corresponds to decreasing ionic repulsions. From emulsion B to emulsion A, the important increase in the surface concentration corre-sponds to a simultaneous increase in the ionic strength and a decrease in the pH, both induced by the increase in the gum concentration. These results are consistent with interfacial tension measurements, in which decreasing pH and increasing salinity lead to a decrease in the interfacial tension (see Figure 4 in the Supporting Information). The droplet diameter evolution for emulsions A and B is presented in Supporting
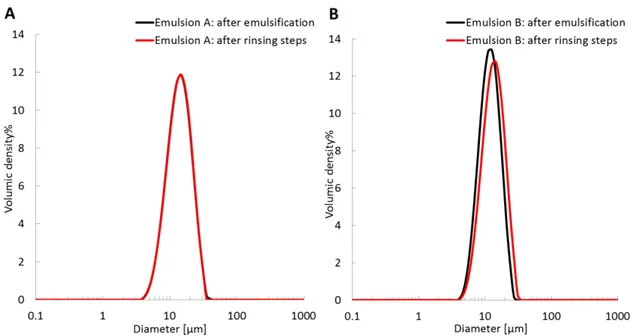
Information Figure 5. The droplet diameter was constant
throughout the rinsing procedure for emulsions A and B. Three scenarios can be proposed to interpret these surface coverage density variations: (i) The emulsification conditions correspond to a defect of species with interfacial properties rather than an excess of them. In addition to the chromato-graphic analysis, which does not support this hypothesis (adsorbing species are far from being fully consumed), comparing emulsions B−D shows that even with the same gum concentration, surface concentrations are different. Additionally, we did not observe a limited coalescence regime when using gum arabic as an emulsion stabilizer. Indeed, there was no linear evolution between the volume/surface diameter of the emulsion droplets and the inverse of gum concentration, indicating that we are not in default of adsorbing species. (ii) There are differences in film composition induced by different conditions, leading to packing changes at the interface since species of various sizes are adsorbed. (iii) There are conformational changes with the different conditions, leading to changes in surface density resulting from the variation of the
mean area per adsorbed molecule, similarly to what is observed with adsorbed polymer brushes.21,22
Film Composition as a Function of Physico-Chemical Parameters. To test the second hypothesis (corresponding to the surface concentration changes induced by composition changes), chromatographic analysis of the adsorbed species for the different conditions ofTable 1was performed.
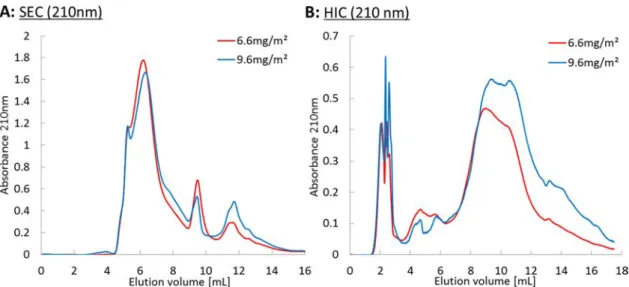
Firstly, we investigated the effect of increasing gum arabic bulk concentration on the interfacial composition. As observed from Figure 4A, the molecular weight distributions for both film compositions are similar in shape. For both SEC and HIC chromatograms, the area ratio between the two samples corresponding to emulsions A and B correlates well with the ratio of their protein content (SEC area ratio: 5.2/4.85 = 1.07, HIC area ratio 6.29/5.16 = 1.22, protein content: 12.2/10.8), within the precision limits of each technique (0.3% SEC, 6% HIC).
This small protein amount difference is consistent with the observation that more amphiphilic species (hydrophobic) are adsorbed upon increasing the surface density. Similar observations were made from refractive index detection (data not shown here). The hydrophobic interaction chromatograms support consistently that more hydrophobic species are present upon increasing the surface density.
Secondly, we examined the effect of ionic strength and pH changes at a constant gum bulk concentration. As observed in Figure 5, all chromatograms corresponding to these different formulations are fairly similar. Weak variations in protein content are observed by direct analysis or by 210 and 280 nm
SEC chromatograms (see Figure 3 in the Supporting
Information). These analyses do not give information on
polysaccharides. However, we have observed, through HIC chromatography, all classes of adsorbed species except for the most hydrophilic ones. This suggests that there is no free polysaccharide at the interface after rinsing, and therefore all polysaccharide chains are linked with proteins. The similarity of the three chromatograms thus suggest similar interfacial compositions.
Figure 4.(A) Size-exclusion chromatograms and (B) hydrophobic interaction chromatograms of the adsorbed species as a function of the amount adsorbed at oil/water interfaces with UV detection at 210 nm (emulsions A and B fromTable 1). Chromatograms were obtained by subtraction of the nonadsorbed species chromatograms from the total gum arabic chromatogram and rescaled to a concentration of 30 g·L−1to compare the molecular mass composition for each adsorbedfilm.
Overall, the composition changes seem too small to provide an explanation for the variation of the surface concentration change (hypothesis (ii)).
Significant differences in surface coverages and mean area per species are observed between the more concentrated emulsion (9.6 mg·m−2/116 nm2) and the less concentrated
emulsion (6.6 mg·m−2/169 nm2), and can therefore be ascribed to conformational changes at the interface (hypothesis (iii)).
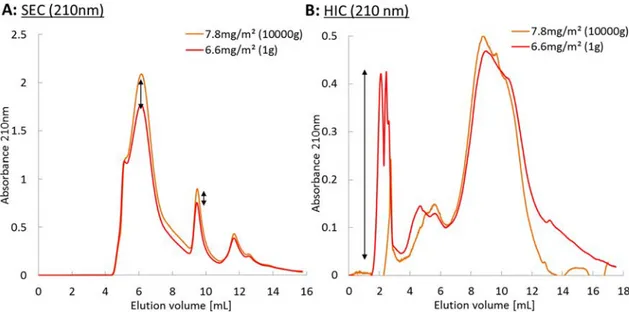
Weakly Hydrophobic Species Desorb upon Reducing the Interfacial Area. Emulsion B was centrifuged at 10 000g prior to recovering the species from the interface and the aqueous phase of the emulsion. It was observed that the Sauter diameter of the emulsion increases after a one-minute
centrifugation. This reduction in the interfacial area leads to an increase in the surface coverage, as indicated by the total amount recovered from the interface.
Comparison of the size-exclusion chromatograms inFigure 6A shows that the interface is enriched in the high molecular weight macromolecules and some of the smaller ones, and therefore further depleted in the intermediate molecular masses. Figure 6B exhibits a major difference between the hydrophobic interaction chromatograms of both samples. Indeed, the first eluted peak completely disappeared in the case of the emulsion that was centrifuged and subjected to coalescence events. A forced reduction of the interfacial area, here achieved by centrifugation and subsequent coalescence, can cause the desorption of the more hydrophilic species, a result consistent with the observation of a much larger protein content after centrifugation (14.7 wt %) than before (10.8 wt %). Interestingly, the emulsion size distribution was modified only during the first centrifugation step, whereas further centrifugation did not lead to further evolution. This observation, suggests that the desorption of hydrophilic species results from conditions where droplets are forced to coalesce to a given extent, above which emulsions reach a high metastability.
Formulating Emulsions with Gum Arabic Using Physico-Chemical Variations. Although we leave a mech-anistic description of gum arabic stabilization of oil/water emulsions for a following structural work, the present results readily suggest some formulation keys.
Gum arabic is widely used in the food industry, in particular, for the stabilization of beverage emulsions. These emulsions are stored as a concentrate that is diluted in thefinal product. Both concentrated and dilute emulsions need to remain metastable for several months or years to meet industrial specifications. In this work, we have shown that species from gum arabic were irreversibly adsorbed at oil/water interfaces, which contrasts with, for instance, common surfactants. This observation thus rationalizes the use of gum arabic for applications involving large emulsion dilutions.
Figure 5.Size-exclusion chromatograms of the adsorbed species as a function of the amount adsorbed at oil/water interfaces. Chromato-grams were obtained by subtraction of the non-adsorbed species chromatograms from the total gum arabic chromatogram and rescaled to a concentration of 30 g·L−1 to compare the molecular mass composition for each adsorbedfilm.
Figure 6.(A) Size-exclusion chromatograms and (B) hydrophobic interaction chromatograms of the adsorbed species after a (10 000g) or without (1g) centrifugal acceleration, with UV detection at 210 nm. Chromatograms were obtained by subtraction of the nonadsorbed species chromatograms from the total gum arabic chromatogram and rescaled to a concentration of 30 g·L−1to compare the molecular mass composition for each adsorbedfilm.
Another important constraint in using gum arabic is the use of a large excess in beverage formulation (>20% w/w), since gum arabic has the reputation to contain a limited amount of surface-active species. This results in an important concen-tration of the non-adsorbed species in the aqueous phase, which may cause unwanted effects such as depletion, osmotic stress, pH, and viscosity changes. However, high concentration of gum arabic also corresponds to a high ionic strength, which, as we showed, promotes adsorption. We have demonstrated that an accurate control of physico-chemical parameters such as pH and ionic strength was an efficient lever to enhance the surface coverage of emulsion droplets, which may be used to counterbalance a concentration decrease. A rational formula-tion design would thus consist of decreasing the gum arabic amount and increase the salt concentration or decrease the pH. Importantly, once the emulsion is formed, the adsorbed layers are extremely resilient to further changes and will not relax their conformation. This resilience can be utilized to subsequently modify the concentration and pH and ionic strength, as required for the final application, since these parameter values are only critical during emulsification.
Following this prediction, a proof-of-concept experiment was performed using a very low concentration of gum arabic to stabilize hexadecane-in-water emulsions. One sample was emulsified without additional ingredients, whereas in the other two, either the pH was decreased or sodium chloride was added. The three samples were compared with an emulsion stabilized with ten times more gum arabic. Size distributions of the emulsions, after one hour of aging, are presented inFigure 7.
It is important to mention that right after emulsification all the emulsions displayed the same size distribution. After 1 h, no noticeable change can be observed with the emulsion made with a solution concentrated in 30 g·L−1in gum at a pH of 3.5 (black curve). Dividing the gum concentration by 10 at the same pH leads to a significant coarsening of the emulsion (green curve). Increasing the pH of the solution to 5.8 leads to a fast destabilization of the emulsion (red curve), whereas adding salt significantly compensates the pH increase, leading to the size distribution slightly unchanged compared to the initial state (orange curve). These observations further underline the importance of the physico-chemical parameters
employed in a gum arabic-stabilized emulsion formulation. The simple example displayed here highlights alternative formula-tion pathways to reduce the amount of gum arabic in formulations, which is cost-efficient and should prevent any issues stemming from depletion effects.
■
CONCLUSIONSGum arabic solutions contain a diversity of polysaccharides and polysaccharide/protein conjugates of various sizes and hydrophobicities. When such solutions are placed in contact with an oil phase, interfacial adsorption occurs. In this work, we quantify the composition difference between the bulk solution and the interface. The main observation is a large enrichment in proteinaceous species of the interface. The interface is also enriched in the minority fractions of gum arabic corresponding to the larger and smaller sizes but depleted in the predominant species corresponding to the intermediate sizes.
Still, the interface remains populated with a large variety of species of contrasting size and hydrophobicity. The adsorption process is out of thermodynamic equilibrium, so that most species present at the interface, except for the most hydrophilic ones, can be considered as irreversibly adsorbed. This explains the wide use of arabic gum as a stabilizer for beverage emulsions, which must withstand extensive dilutions.
A significant increase in the interfacial concentration of gum species with a decrease in ionic repulsions is reported, despite a large excess of gum arabic in the aqueous phase. The ionic repulsions could be varied simultaneously through changes in the gum concentration or separately by changing pH or ionic strength. The composition of the interfacialfilms correspond-ing to these different interfacial coverages only weakly varies, which suggests that the interfacial concentration changes are not related to compositional changes. Rather, these changes stem from structural modifications within the interfacial layer. We suggest that the systematic control of this interfacial density is a key parameter for a rational design of formulations using gum arabic. For instance, decreasing the pH or increasing the salt concentration prior to emulsification allows the formulation of metastable emulsions with much lower amounts of gum arabic, which is cheaper and hinders depletion effects.
■
MATERIALS AND METHODSMaterials. Spray-dried powder of gum arabic (Acacia senegal) was a gift from Caragum International (Marseille, France) and the composition was 2.5 wt % of proteins (Nx7), 11 wt % moisture, 3.16 wt % ash, and nearly no lipid (CG 103). This leads to a protein rate of 2.9 wt % of proteins (Nx7) for the dry gum arabic without ash. Sodium chloride (>99.5% BioXtra), hexadecane (99% ReagentPlus), pentane, and hydrochloride acid were purchased from Sigma Aldrich. Distilled water was used for all experiments.
Emulsion Ionic Strength. The ionic strength of a solution can be calculated usingeq 1 I 1 C z 2 i i i 2
∑
= (1) Ci represents the concentration of each ion in solution and zi represents its valence. In the case of gum arabic-stabilized emulsions, all the ions present ineq 2need to be considered. These include the carboxylic functions present via the glucuronic acid moieties of the polysaccharides, the gum cations, the protons in solution, and additional ions during the emulsion formulation. The protein content of the gum arabic being around 2.9 wt %, the contribution of NH3+ Figure 7.Size distribution of hexadecane-in-water emulsion (20% v/v) stabilized by gum arabic one hour after emulsification with variations of physico-chemical parameters employed in the formulation (pH and salt concentration).
and COO−ions of the gum proteins can be neglected. Ionic strength reads I 1 2( COO 2 Mg 2 Ca K H Na Cl ) 2 2 2 2 = [ ] + [ ] + [ ] + [ ] + [ ] + [ ] + [ ] − + + + + + − (2) The amount of glucuronic acid (mol) is calculated from the percentage of glucuronic acid (molar mass 194 g·mol−1) in gum arabic taken from the literature (around 14% w/w).10 The concentration of deprotonated carboxylic functions is given by eqs 3and4
nuronic acid=nCOOH (3)
n V
COO COOH %COO
aqueous
[ −] = ×
Φ
−
(4) Only the deprotonated form of the carboxylic acid moieties will play a role in the ionic strength of the emulsion. The percentage of deprotonated carboxylic acid is dependent on the pKaof glucuronic acid and the pH of the aqueous phase. Glucuronic acid pKais taken equal to 3.2.23 COO COOH 10 K pH p a [ ] [ ] = − − (5) Thus, for pH = 5 there is approximately 98% of carboxylic acid at deprotonated form, whereas at pH = 3.5 the percentage is approximately 67%.
The concentration of gum cations can be calculated from eq 6
(illustrated with the concentration of magnesium). The weight percentage of each cation in the gum was determined using ion chromatography ([K] = 0.8% w/w, [Mg] = 0.16% w/w, [Ca] = 0.55% w/w). m M V Mg2 wt %Mg GA Mg aqueous [ ] = × × + Φ (6)
Concentrations of the sodium and chloride ions are dependent on the amount of sodium chloride (NaCl) and/or hydrochloric acid (HCl) added to the aqueous phase. Finally, the concentration of free protons is provided by the pH value.
H 10 pH
[ +] = − (7)
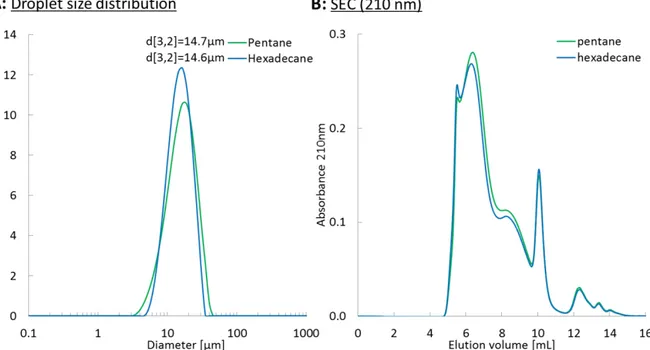
Emulsion Preparation. Oil-in-water emulsions stabilized by gum arabic were prepared using a rotor/stator device (Ultra-Turrax). Alkane oil (pentane or hexadecane) was used as the organic phase. We showed that the nature of the oil did not influence the composition of the interface (see Figure 1 in the Supporting Information). Emulsions of 100 mL were formulated as follows: 40% v/v of oil was dispersed in gum arabic aqueous solution. Gum arabic solutions were prepared at different concentrations and centrifuged under 19 000g to remove insoluble materials. Then, the pH or the salt concentration of each solution was adjusted by adding small amounts of HCl at 1 mol·L−1or NaCl at 3 mol·L−1. Both phases were then mixed for 1 min at 10 000 rpm.
Interfacial Separation. Gum arabic amphiphilic species were separated through an emulsion mediated separation technique. Emulsions of pentane in water stabilized by arabic gum were formed following the aforementioned protocol. Emulsions were then placed in a separatory funnel, diluted with distilled water saturated with pentane (to avoid pentane to diffuse from oil droplets into the aqueous phase) and allowed to cream. The aqueous phase was recovered and the emulsion cream was rinsed again to remove all species that could be trapped between the droplets without being strongly adsorbed at an interface. The aqueous phase containing all the species that did not adsorb was then dialyzed against water and lyophilized. Thefinal cream was dispersed in water and freeze-dried. A mass balance on the recovered species was carried out on each batch to calculate the surface concentration of the droplets.
Drop Size Distribution. Droplet size distributions of emulsions were measured using a static light scattering instrument (Mastersizer 3000, Malvern). The laser wavelength was of 633 nm. An emulsion sample was dispersed in recirculated water until an obscuration value between 1 and 10% was obtained to avoid multiple scattering. The average droplet diameter was determined as the volume−surface mean diameter d[3, 2]. Each measurement was repeated in triplicate at room temperature.
Size-Exclusion Chromatography. Size-exclusion chromatogra-phy was used to separate arabic gum species as a function of their relative hydrodynamic volume. A 7.8 mm× 300 mm BioSuite 450 Å SEC column (Waters) packed with 8 μm porous silica beads was used. The average pore size of the silica beads is 450 Å.
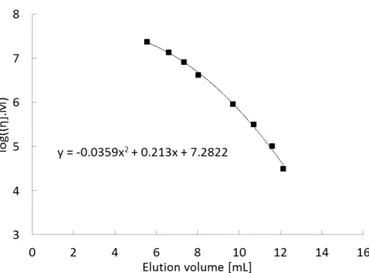
The separation was performed on an Alliance HPLC unit (Waters 2695 separations module), a 0.5 mol·L−1NaCl aqueous solution at 25 °C was used as the eluent phase at a flow rate of 0.8 mL·min−1. Each sample wasfiltrated with a nylon 0.2 μm membrane and a volume of 50μL was injected. UV detection was performed at 210 and 280 nm using a Waters 2487 UV detector. Refractive index detection was performed to measure the mass percentage of each eluted species (Waters 410 differential refractometer). Refractive index detection was performed only until 10.5 mL of elution due to a negative peak appearing from the difference in the refractive index between the sodium chloride of the eluent phase and water from the injected sample. The column was calibrated using branched dextran standards (Waters) (see Figure 6 in theSupporting Information).24
Variation coefficients for each detection were calculated from three injections of the same sample. For UV detection at 210 nm a 0.3% variation coefficient was measured. It was of 0.5% for UV detection at 280 nm and of 13% for refractive index detection.
UV detection at 280 nm is more sensitive to the amount of aromatic amino acid present within the gum polypeptidic moieties (tyrosine and phenylalanine). Aromatic amino acids, however, are not the predominant amino acid moieties in gum arabic, as already observed in the literature.5,12,25UV detection at 210 nm is mostly sensitive toπ → π* transitions from the CO bond of the amide linkages between amino acid moieties and from those of carboxylic moieties present on the polysaccharide backbones and of reducing sugar units at the end of polysaccharide chains.
Hydrophobic Interaction Chromatography. Hydrophobic interaction chromatography was used to separate arabic gum fractions as a function of their hydrophobic properties. A 7.5 mm× 75 mm 10 μm Biosuite Phenyl column (Waters) consists of phenyl groups bonded to a metacrylic ester-based polymeric resin. The average pore size of the column is 1000 Å to accommodate macromolecules with high molecular weights. A gradient of salt concentration is required to create a“salting out” effect and progressively desorb the hydrophobic species. The less hydrophobic species are elutedfirst with the highest salt concentration, whereas the more hydrophobic species are the last one eluted.
The separation was performed on an Alliance HPLC unit (Waters 2695 separations module). The mobile phase was composed of a solution of NaCl at a constant flow rate of 0.5 mL min−1. A continuous time gradient of salt concentration between 4 mol·L−1and 0 was applied for 22 min followed by distilled water for 12 more minutes (see Figure 7 in theSupporting Information). Unlike other studies,5,11,12our experiments have been performed with a continuous gradient of salt concentration to avoid artefacts during abrupt salinity changes. Each sample wasfiltrated with a nylon 0.2 μm membrane and a volume of 30μL was injected. UV absorbance was measured at 210 and 280 nm (Waters 2487 UV detector). We observed that UV absorbance (especially at 210 nm) was very sensitive to NaCl concentration. The baseline was not constant along the separation time. To correct this deviation, the chromatogram of distilled water injected in the same elution conditions was subtracted from each measured chromatogram.
Variation coefficients for each detection were estimated from comparison of three injections of the same sample. A 6% (resp. 11%) variation coefficient was observed at 210 nm (resp. 280 nm).
Interfacial Film Composition. The surface concentration (in mg·m−2) in emulsions was determined usingeq 8. The amount of recovered mass (mads) was determined from the mass balance from the interfacial separation procedure.
m d V 6 ads 3,2 oil Γ = [ ] (8) Chromatograms of the adsorbed species at interfaces were determined using the following procedure: a native gum arabic sample and the species recovered from the aqueous phase of the emulsion (nonadsorbed species) were solubilized in water at a concentration of 3% w/w. The same volume for each solution was injected into both chromatographic columns (SEC and HIC). For both chromato-graphic techniques, the total area of chromatograms has been found to be proportional to the species concentration of each sample (see Figure 2 in theSupporting Information). Knowing from the interfacial separation procedure, the mass percentage of macromolecules from the gum that did or did not adsorb, the chromatogram of the species recovered from the aqueous phase was multiplied by its mass percentage. To obtain the chromatogram of the adsorbed species, the chromatogram of the nonadsorbed species was subtracted from that of the gum arabic. Finally, to compare each chromatogram between them, the resulting chromatogram was multiplied by 100 divided by its mass percentage determined from the interfacial separation procedure (percentage of gum macromolecules that adsorbed from the amount of gum used in the emulsion).
Nitrogen Content Analysis. Nitrogen content analyses were performed at the Laboratoire de Coordination Chimique (Toulouse, France). A Perkin-Elmer 2400 CHN series II was operated at 1050°C with oxygen as carrier gas. Each sample was analyzed in duplicate. Protein fraction content was deduced from the nitrogen content through a protein conversion number calculated from the gum arabic protein amino acid distribution from Renard, Sanchez and co-workers11
%protein=%nitrogen×7 (9) It is worth noting that this value slightly differs from the common value of 6.6 taken from the majority of gum arabic publications. However, we must stress that the 6.6 value does not correspond to the measured amino acid distribution of gum arabic, and is therefore incorrect.
■
ASSOCIATED CONTENT*
S Supporting InformationThe Supporting Information is available free of charge on the
ACS Publications website at DOI:
10.1021/acs.lang-muir.8b02715.
Supporting Information is included with seven (7) figures (PDF)
■
AUTHOR INFORMATION Corresponding Author *E-mail:[email protected]. ORCID K. Roger: 0000-0001-7914-0951 NotesThe authors declare no competingfinancial interest.
■
ACKNOWLEDGMENTSThe authors would like to thank Agence Nationale de la Recherche (ANR) for financial support of Laboratoire Commun SOpHy (Projet-ANR-14-LAB3-0011), a partnership between Laboratoire de Génie Chimique and CARAGUM Int. company. The authors are grateful to J.C. Garrigues from IRMCP laboratory of Toulouse for valuable assistance in
Chromatographic analysis measurements and to Isabelle Borget from Laboratoire de Coordination Chimique of Toulouse for the measurements of nitrogen content.
■
REFERENCES(1) Sanchez, C.; Nigen, M.; Mejia Tamayo, V.; Doco, T.; Williams, P.; Amine, C.; Renard, D. Acacia Gum: History of the Future. Food Hydrocolloids 2018, 78, 140−160.
(2) Mirhosseini, H.; Tan, C. P.; Hamid, N. S. A.; Yusof, S. Effect of Arabic Gum, Xanthan Gum and Orange Oil Contents onζ-Potential, Conductivity, Stability, Size Index and PH of Orange Beverage Emulsion. Colloids Surf., A 2008, 315, 47−56.
(3) Padala, S. R.; Williams, P. A.; Phillips, G. O. Adsorption of Gum Arabic, Egg White Protein, and Their Mixtures at the Oil−Water Interface in Limonene Oil-in-Water Emulsions. J. Agric. Food Chem. 2009, 57, 4964−4973.
(4) Randall, R. C.; Phillips, G. O.; Williams, P. A. The Role of the Proteinaceous Component on the Emulsifying Properties of Gum Arabic. Food Hydrocolloids 1988, 2, 131−140.
(5) Ray, A. K.; Bird, P. B.; Iacobucci, G. A.; Clark, B. C., Jr. Functionality of Gum Arabic. Fractionation, Characterization and Evaluation of Gum Fractions in Citrus Oil Emulsions and Model Beverages. Food Hydrocolloids 1995, 9, 123−131.
(6) Castellani, O.; Al-Assaf, S.; Axelos, M.; Phillips, G. O.; Anton, M. Hydrocolloids with Emulsifying Capacity. Part 2 − Adsorption Properties at the n-Hexadecane−Water Interface. Food Hydrocolloids 2010, 24, 121−130.
(7) Nakauma, M.; Funami, T.; Noda, S.; Ishihara, S.; Al-Assaf, S.; Nishinari, K.; Phillips, G. O. Comparison of Sugar Beet Pectin, Soybean Soluble Polysaccharide, and Gum Arabic as Food Emulsifiers. 1. Effect of Concentration, PH, and Salts on the Emulsifying Properties. Food Hydrocolloids 2008, 22, 1254−1267.
(8) Kobayashi, M.; Utsugi, H.; Matsuda, K. Intensive UV Absorption of Dextrans and Its Application to Enzyme Reactions. Agric. Biol. Chem. 1986, 50, 1051−1053.
(9) Kuipers, B. J. H.; Gruppen, H. Prediction of Molar Extinction Coefficients of Proteins and Peptides Using UV Absorption of the Constituent Amino Acids at 214 Nm To Enable Quantitative Reverse Phase High-Performance Liquid Chromatography−Mass Spectrome-try Analysis. J. Agric. Food Chem. 2007, 55, 5445−5451.
(10) Idris, O. H. M.; Williams, P. A.; Phillips, G. O. Characterisation of Gum from Acacia Senegal Trees of Different Age and Location Using Multidetection Gel Permeation Chromatography. Food Hydro-colloids 1998, 12, 379−388.
(11) Renard, D.; Lavenant-Gourgeon, L.; Ralet, M.-C.; Sanchez, C. Acacia Senegal Gum: Continuum of Molecular Species Differing by Their Protein to Sugar Ratio, Molecular Weight, and Charges. Biomacromolecules 2006, 7, 2637−2649.
(12) Randall, R. C.; Phillips, G. O.; Williams, P. A. Fractionation and Characterization of Gum from Acacia Senegal. Food Hydrocolloids 1989, 3, 65−75.
(13) Fennell Evans, D.; Wennerstrom, H. The Colloidal Domain: Where Physics, Chemistry, Biology, and Technology Meet, 2nd ed.; Wiley, 1999.
(14) Binks, B. P. Particles as Surfactantssimilarities and Differ-ences. Curr. Opin. Colloid Interface Sci. 2002, 7, 21−41.
(15) Arditty, S.; Schmitt, V.; Giermanska-Kahn, J.; Leal-Calderon, F. Materials Based on Solid-Stabilized Emulsions. J. Colloid Interface Sci. 2004, 275, 659−664.
(16) Atgié, M.; Guarrigues, J.-C.; Chennevière, A.; Masbernat, O.; Roger, K.; Gum Arabic: Composition and Multi-Scale Structures in Solution. Food Hydrocolloids 2019, DOI: 10.1016/j.food-hyd.2019.01.033.
(17) Wang, Q.; Burchard, W.; Cui, S. W.; Huang, X.; Phillips, G. O. Solution Properties of Conventional Gum Arabic and a Matured Gum Arabic (Acacia (Sen) SUPER GUM). Biomacromolecules 2008, 9, 1163−1169.
(18) Dror, Y.; Cohen, Y.; Yerushalmi-Rozen, R. Structure of Gum Arabic in Aqueous Solution. J. Polym. Sci., Part B: Polym. Phys. 2006, 44, 3265−3271.
(19) Li, X.; Fang, Y.; Al-Assaf, S.; Phillips, G. O.; Nishinari, K.; Zhang, H. Rheological Study of Gum Arabic Solutions: Interpretation Based on Molecular Self-Association. Food Hydrocolloids 2009, 23, 2394−2402.
(20) Li, X.; Fang, Y.; Zhang, H.; Nishinari, K.; Al-Assaf, S.; Phillips, G. O. Rheological Properties of Gum Arabic Solution: From Newtonianism to Thixotropy. Food Hydrocolloids 2011, 25, 293−298. (21) Balastre, M.; Li, F.; Schorr, P.; Yang, J.; Mays, J. W.; Tirrell, M. V. A Study of Polyelectrolyte Brushes Formed from Adsorption of Amphiphilic Diblock Copolymers Using the Surface Forces Apparatus. Macromolecules 2002, 35, 9480−9486.
(22) Zhao, B.; Brittain, W. J. Polymer Brushes: Surface-Immobilized Macromolecules. Prog. Polym. Sci. 2000, 25, 677−710.
(23) Fernandes Diniz, J. M. B.; Herrington, T. M. PKa Determination of Weak Acids over a Large PH Range. J. Chem. Eng. Data 1993, 38, 109−111.
(24) Kato, T.; Tokuya, T.; Takahashi, A. Comparison of Poly(Ethylene Oxide), Pullulan and Dextran as Polymer Standards in Aqueous Gel Chromatography. J. Chromatogr. A 1983, 256, 61−69. (25) Goodrum, L. J.; Patel, A.; Leykam, J. F.; Kieliszewski, M. J. Gum Arabic Glycoprotein Contains Glycomodules of Both Extensin and Arabinogalactan-Glycoproteins. Phytochemistry 2000, 54, 99− 106.
S1
Supporting information.
Emulsions stabilized by gum Arabic:
composition and packing within interfacial films
M. Atgié, O. Masbernat, K.Roger*
Laboratoire de Génie Chimique, Université de Toulouse, CNRS, INPT, UPS, Toulouse, France *to whom correspondence should be addresse: [email protected]
This supporting information sections contains:
Figure S1: (A) Emulsion size distribution with either pentane or hexadecane as the oil phase using the same
formulation, (B) Same emulsions aqueous phase size exclusion chromatograms. ____________________________2
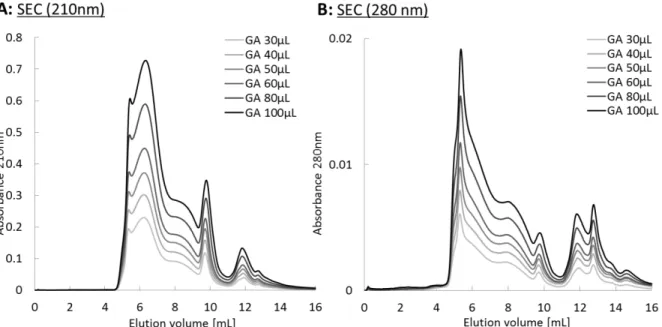
Figure S2: Size exclusion chromatogram of gum Arabic at 30g/L by varying the injected volume. (A) UV detection at 210nm, (B) UV detection at 280nm. ________________________________________________________________3
Figure S3: Comparison of gum Arabic and gum Arabic species adsorbing at oil water interface size exclusion
chromatograms with a UV detection at 280nm. ______________________________________________________3
Figure S4: Evolution of interfacial tension between aqueous solution of gum arabic at 0.5wt% and n-hexadecane as a function of time by varying (A) the pH of the aqueous phase or (B) the salinity of the aqueous phase by addition of NaCl. ________________________________________________________________________________________4
Figure S5: Evolution of the droplets diameters for emulsions A and B during the rinsing procedure ______________4
Figure S6: Universal calibration curve for size exclusion separation on Biosuite 450Å SEC column with a flow rate of 0.8mL/min and 0.5M NaCl as the eluant solution. _____________________________________________________5
S2
Figure S1: (A) Emulsion size distribution with either pentane or hexadecane as the oil phase using the same formulation, (B) Same emulsions aqueous phase size exclusion chromatograms.
Small differences in interfacial composition may arise from the fact that although both
emulsions exhibit similar Sauter diameters, their size distribution are slightly different, with the
emulsion with pentane being more polydisperse. Nevertheless, their interfacial composition is
nearly the same.
S3
Figure S2: Size exclusion chromatogram of gum Arabic at 30g/L by varying the injected volume. (A) UV detection at 210nm, (B) UV detection at 280nm.
Figure S3: Comparison of gum Arabic (black line) and gum Arabic species adsorbing at oil water interface (red line) size exclusion chromatograms with a UV detection at 280nm. (A): Adsorbed species chromatograms was obtain by subtraction of the non adsorbed species chromatograms to the total gum Arabic chromatogram and brought back
to a concentration of 30g/L in order to compare the molecular mass composition with gum Arabic. (B): Both chromatogram from (A) were normalized by the higher intensity in order to compare intensity ratios between
S4
Figure S4: Evolution of interfacial tension between aqueous solution of gum arabic at 0.5wt% and n-hexadecane as a function of time by varying (A) the pH of the aqueous phase or (B) the salinity of the aqueous phase by addition of
NaCl.
According to interfacial tension measurements between gum Arabic solutions and hexadecane,
physico-chemical parameters appeard to influence the adsorption of gum Arabic species at the
interface. This observation might be either the results of an increase in the amount of gum
amphiphilic species adsorbed (isotherms of adsorption), or the difference in the type of
macromolecules adsorbed (chromatographic analysis) or a combination of both.
S5
Figure S6: Universal calibration curve (realized with branched dextran of known molecular weight) for size exclusion separation on Biosuite 450Å SEC column (waters) with a flow rate of 0.8mL/min and 0.5M NaCl as the eluant
solution.