I. ATOMIC RESONANCE AND SCATTERING
Academic and Research Staff
Prof. D. Kleppner
Dr. D. C. Burnham
Dr. M. T. Myint
Dr. D. E. Pritchard
Graduate Students
G. N. Carter
F. G. Walther
F. Y. Chu
P. F. Winkler, Jr.
A.
MAGNETIC MOMENT OF THE PROTON
1.
Introduction
The goall of this experiment is to obtain a measurement of the proton g-factor, in
terms of the electron g-factor, to a precision of one part in 108.
The unique feature of
our experiment is that the proton is examined in atomic hydrogen, thereby minimizing
theoretical uncertainties resulting from diamagnetic effects, which have limited the
pre-cision of previous determinations of this fundamental constant (in all of which protons
were observed in a molecular environment).
Moreover, we employ a double-resonance
technique whereby the electron and proton spin-flip transition frequencies are measured
simultaneously.
Thus systematic errors attributable to sample exchange and magnetic
field fluctuations are eliminated.
In the experiment an atomic hydrogen maser designed to operate in a magnetic
field of 3500 Gauss is used.
The maser is operated as an extremely narrow-band
amplifier at the frequency corresponding to the electron spin-flip transition, a, shown
in Fig. I-1.
The output level of the maser amplifier is changed when the proton
spin-flip transition, b, is stimulated.
This double-resonance technique enables precise
determination of the two resonant frequencies.
By using the Breit-Rabi formula, the
g-factor ratio is calculated from these two frequencies and the well-known hyperfine
separation of ground-state hydrogen.
2The final precision of the g-factor ratio is limited by the precision to which the
pro-ton frequency can be determined.
Since the internal coupling field between the proton
and electron in atomic hydrogen is 40 times stronger than the externally applied field,
the proton frequency must be determined 40 times more accurately than the desired
precision for the g-factor ratio.
The permanent magnet used in the experiment is designed for very high homogeneity
This work was supported by the Joint Services Electronics Programs (U. S. Army,
U. S. Navy, and U. S. Air Force) under Contract DA 28-043-AMC-02536(E), and in part
by the U. S. Navy (Office of Naval Research) under Contract N00014-67-A-0204-0006,
and the Sloan Fund for Basic Research (M. I. T. Grant 170).
(I. ATOMIC RESONANCE AND SCATTERING) w mi mi h + +1
2 2
(b) 0.64 GHz (G) 9.2 GHz B GHz %3500G 2 2Fig. I-1.
Energy levels of atomic hydrogen in an external
magnetic field.
-7
(typically 3 X 10⁻⁷ over the volume of a maser storage bulb, 2 cm in diameter). The
measured fractional linewidth of the electron transition is typically 2
x
10-8, and hence
extremely fine thermal stabilization of the magnet, which has a temperature coefficient
of 250 ppm/° C, is required. We have developed a temperature control system that will
keep the field stable to better than one part in 108 over a period of a few minutes, but
during an evening of data-taking a slow drift of one part in 107 is not uncommon. Thus
it is desirable to have an electronic field regulation system to compensate for thermal
drift.
This has been incorporated into our data-accumulation system.
2.
Automatic Data-Accumulation System
The past few months have been devoted primarily to designing and building a
data-taking system to deal with the aforementioned problems.
The basic functions of the
system are twofold: to provide a feedback scheme to lock the magnetic field, and hence
the electron resonance frequency, at some known value; and to provide a means of
sweeping the proton line and printing out information in a computer-analyzable form.
The field locking is accomplished by square-wave modulation of the field with
TO FIELD
CORRECTION COIL
(I. ATOMIC RESONANCE AND SCATTERING)
a small Helmholtz coil. If the peak-to-peak amplitude of this modulation is roughly equal to the half-width of the resonance line, then the resulting signal output from a phase detector will be proportional to the deviation of the electron resonance fre-quency, v, from the applied frequency v . This DC output is amplified and fed to a field correction coil that nulls any small deviation of v from vo, thereby effectively locking the field to a preset value.
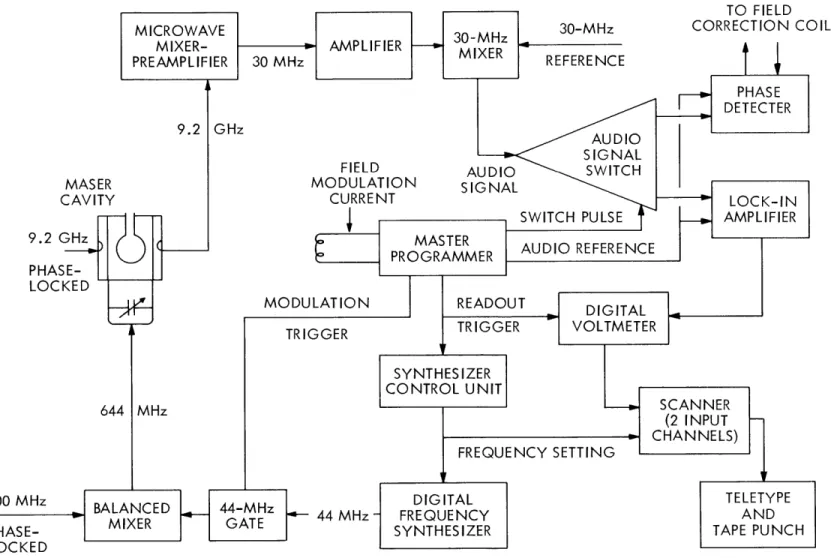
When RF power at the proton resonance frequency is fed into the system, the steady amplitude of the electron resonance signal is changed, because of a mixing of the upper two states shown in Fig. I-1. In order to observe this double resonance effect, RF power to the proton is modulated off-on, and the electron signal is monitored with a lock-in amplifier at the modulation frequency. This output, converted to DC, is read by a digital voltmeter and punched on paper tape. The entire system is illustrated in Fig. 1- 2.
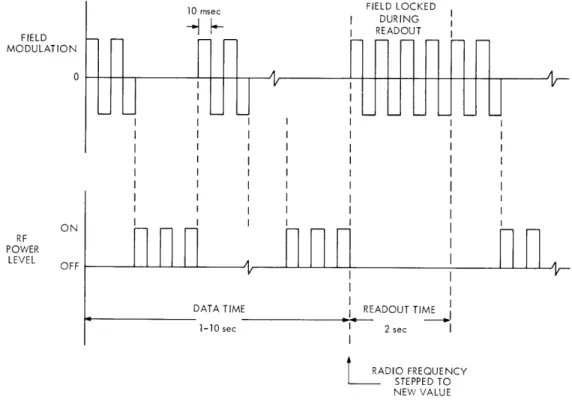
The RF power modulation and field modulation are not carried out simultaneously, since the double resonance is observed through the effect of the proton resonance signal on the electron resonance signal. We use a measurement sequence (Fig. I-3) in which we alternately modulate the field and the RF power. During the field-modulation part of the sequence, the necessary feedback current is determined. Holding this current constant for the short period during which the proton resonance is
stimu-10 msec FIELD LOCKED
SDURING FIELD READOUT MODULATION 0 I I I I II I I II III I I I I I ONI LEVEL OFF
DATA TIME READOUT TIME
I
1-10 sec I 2sec
RADIO FREQUENCY STEPPED TO NEW VALUE
Fig. 1-3. Timing sequence.
(I. ATOMIC RESONANCE AND SCATTERING)
lated maintains the field at the preset value. One data point consists in repeating this sequence several times, after which the data are read out. Then the RF power
is automatically stepped to a new frequency, and another data point is taken. The total time for each point is a few seconds.
The key element of the data-acquisition system is a master programmer, which drives the field modulation coil and the RF power gate. Each modulation is driven for a preset number of cycles of an internal audio-frequency clock. The signal is switched by the programmer either to the phase detector, during the field-modulation part of the sequence, or to the lock-in amplifier, during the proton-modulation period. At the end of a data point, the programmer triggers the digital voltmeter, which immediately reads the lock-in amplifier output. This signal level and the two frequency-settings are punched out on tape.
The RF power for stimulating the proton transition is obtained by mixing a 600-MHz signal with the output of a 50-MHz digital frequency synthesizer. All frequency sources are phase-locked to a reference standard. The synthesizer is set by a versatile control unit that is programmed to sweep the proton line. At the end of a data point the pro-grammer triggers this control unit, which in turn changes the synthesizer output to the proper value for the next data point.
Both the programmer and the synthesizer control are rather complex digital logic devices. Their design and construction was mercifully simplified by the extensive use of inexpensive RTL integrated circuits, several hundred of which were required.
This system has only recently been completed, and we are now testing the system and taking preliminary data. In the coming months we expect to take enough data to improve significantly our knowledge of the proton magnetic moment.
P. F. Winkler, Jr., F. G. Walther, M. T. Myint, D. Kleppner References
1. The experimental goals were described more fully in Quarterly Progress Report No. 84, p. 27. For preliminary results see T. Myint, D. Kleppner, N. F. Ramsey, and H. G. Robinson, Phys. Rev. Letters 17, 405 (1966).
2. S. B. Crampton, D. Kleppner, and N. F. Ramsey, Phys. Rev. Letters 11, 338 (1963).