Publisher’s version / Version de l'éditeur:
Vous avez des questions? Nous pouvons vous aider. Pour communiquer directement avec un auteur, consultez la première page de la revue dans laquelle son article a été publié afin de trouver ses coordonnées. Si vous n’arrivez pas à les repérer, communiquez avec nous à PublicationsArchive-ArchivesPublications@nrc-cnrc.gc.ca.
Questions? Contact the NRC Publications Archive team at
PublicationsArchive-ArchivesPublications@nrc-cnrc.gc.ca. If you wish to email the authors directly, please see the first page of the publication for their contact information.
https://publications-cnrc.canada.ca/fra/droits
L’accès à ce site Web et l’utilisation de son contenu sont assujettis aux conditions présentées dans le site LISEZ CES CONDITIONS ATTENTIVEMENT AVANT D’UTILISER CE SITE WEB.
The 2nd Canadian Conference on Effective Design of Structures: Sustainability of Civil Engineering Structures [Proceedings], pp. 115-131, 2008-05-20
READ THESE TERMS AND CONDITIONS CAREFULLY BEFORE USING THIS WEBSITE.
https://nrc-publications.canada.ca/eng/copyright
NRC Publications Archive Record / Notice des Archives des publications du CNRC :
https://nrc-publications.canada.ca/eng/view/object/?id=e0f2bccc-64a0-40bf-8858-8a4618c52ca9 https://publications-cnrc.canada.ca/fra/voir/objet/?id=e0f2bccc-64a0-40bf-8858-8a4618c52ca9
NRC Publications Archive
Archives des publications du CNRC
This publication could be one of several versions: author’s original, accepted manuscript or the publisher’s version. / La version de cette publication peut être l’une des suivantes : la version prépublication de l’auteur, la version acceptée du manuscrit ou la version de l’éditeur.
Access and use of this website and the material on it are subject to the Terms and Conditions set forth at
Monitoring as a tool for sustainable buildings Said, M. N.; Paquette, J.; Lumsdon, C.
http://irc.nrc-cnrc.gc.ca
M o n i t o r i n g a s a t o o l f o r s u s t a i n a b l e b u i l d i n g s
N R C C - 5 0 4 3 6
S a i d , M . N . A . ; P a q u e t t e , J . ; L u m s d o n , C .
A version of this document is published in / Une version de ce document se trouve dans: 2nd Canadian Conference on Effective Design of Structures, Hamilton, Ontario, May 20-23, 2008, pp. 115-131
The material in this document is covered by the provisions of the Copyright Act, by Canadian laws, policies, regulations and international agreements. Such provisions serve to identify the information source and, in specific instances, to prohibit reproduction of materials without written permission. For more information visit http://laws.justice.gc.ca/en/showtdm/cs/C-42
Les renseignements dans ce document sont protégés par la Loi sur le droit d'auteur, par les lois, les politiques et les règlements du Canada et des accords internationaux. Ces dispositions permettent d'identifier la source de l'information et, dans certains cas, d'interdire la copie de documents sans permission écrite. Pour obtenir de plus amples renseignements : http://lois.justice.gc.ca/fr/showtdm/cs/C-42
Monitoring as a Tool for Sustainable Buildings
M.N.A. Saïd1, J. Paquette2 and C. Lumsdon31Senior Research Officer, Building Envelope and Structure Program, National Research Council
Canada, Ottawa, Ontario, Canada K1A 0R6, Email: nady.said@nrc.gc.ca
2Conservation Engineer, Heritage Conservation Directorate, Public Works and Government
Services Canada, Gatineau, Quebec, Canada K1A 0S5, Email: Jocelyn.Paquette@pwgsc.gc.ca
3Program Manager, Heritage Conservation Directorate, Public Works and Government Services
Canada, Gatineau, Quebec, Canada K1A 0S5, E-mail: carole.lumsdon@pwgsc.gc.ca
Abstract
The city of Ottawa statistics indicate that the construction and demolition industry produces about 30% of the city’s non-residential waste including paper, drywall, wood, concrete, metal, and asphalt. The best way to reduce construction waste is not to produce the waste. Installing sensors in building envelopes to monitor their health and
performance would help ensure the longevity of envelopes and hence reduce repair and demolition waste as well as reduce the impact on the environment. Monitoring results would provide timely warning of potential durability issues and assist in determining their contributing factors. This would aid in implementing an effective repair strategy. When tied into inspection and maintenance plans, monitoring results could assist in identifying envelope areas requiring priority conservation measures. The results will also contribute to a better understanding of in situ performance of a building envelope design, which will contribute to effective design and maintenance guidelines for other similar building envelope designs. This paper discusses monitoring as a tool for sustainable building envelopes. As an example, the monitoring system installed on the Peace Tower will be presented. The Peace Tower is a Federal Heritage Building and a National
Historic Site in the heart of Canada’s capital Ottawa. It was built between 1919 and 1927 as a memorial for peace following World War I. Hygrothermal and structural movements are monitored using approximately 190 sensors located at various locations in the
composite masonry/concrete exterior walls of the tower. Selected monitoring results will be presented.
Introduction
The durability of buildings is a subject of importance in view of current concern on the environment and global warming. Recent headlines highlighted that carbon dioxide in the atmosphere is increasing faster than expected. Carbon dioxide emissions in 2006 were 35% higher than in 1990. One aspect of buildings’ impact on the environment is waste material from construction and demolition of buildings. The impact includes embodied energy and carbon dioxide emission in producing waste materials as well as the impact of the landfill.
The city of Ottawa statistics [1] indicated that the construction and demolition industry produces about 30% of the city’s non-residential waste including paper, drywall, wood, concrete, metal, and asphalt. The best approach to reduce construction waste is to extend the useful life of the envelope and substantially reduce the production of waste. This paper discusses monitoring as a tool to help ensure the longevity of building envelopes and hence reducing repair and demolition waste and the impact on the environment. As an example application, the monitoring system installed in a heritage building, the Peace Tower, is presented, which demonstrates the performance information gained from such monitoring program.
Monitoring as a Tool for Sustainable Buildings
Building envelope health: Monitoring assesses health of building envelopes under actual
environmental exposure conditions both outdoors and indoors. Initially, monitoring determines the normal behaviour of the building envelope under in-use conditions including occupancy function and environment loading. When a change occurs, it is recognized and diagnosed whether the change is expected or not and whether the change affects the building’s durability or not.
Early detection: Sensors located in strategic locations, particularly difficult to reach
locations such as attic space and within building envelope will provide timely warning of potential failure of environment control measures for heat, air, and moisture. Early detection reduces damages and hence reduces waste that would result from replacing damaged materials.
Determine underlying cause of deterioration: Knowing the cause of deterioration ensures
effective repair. Repair measures that address immediate symptoms of deterioration problems without addressing the underlying cause might make more harm than good. As a result, more material waste is generated. Monitoring data would assist in determining the cause whether it is moisture, thermal, structure loading, etc. This reduces waste resulting from implementing an improper repair strategy.
Effective maintenance plans: Using monitoring results in planning priorities for
maintenance programs ensure effective use of resources particularly when they are limited. Timely maintenance measures reduce long-term maintenance costs and materials’ waste.
Improved building envelope designs: Monitoring results provide feedback on the
performance of novel building envelope systems and retrofit and repair strategies. The feedback contributes to development of durable building envelopes’ designs and effective maintenance strategies. As a result, demolition waste from nondurable systems and ineffective maintenance measures is reduced.
What Parameters to Monitor?
Maurenbrecher et al. [2]discusses techniques of monitoring non-structural performance of exterior masonry walls, which is equally applicable to other building envelope systems. References [3 to 7] present examples of applying monitoring techniques to evaluate the performance of building envelopes. Monitored parameters and locations depend on the objectives of the monitoring program. Parameters include the following: Environment exposure conditions
Outdoor and indoor environment exposure parameters determine environmental loadings of the building envelope including temperature, moisture, wind, and solar heat.
Outdoor environment: In large monitoring programs such as in the Peace Tower, a
weather station is installed on site to monitor outdoor exposure parameters, which include temperature and relative humidity of outdoor air, rainfall and its acidity (pH value), wind speed and direction, and solar radiation. Alternatively, air temperature and relative humidity are monitored on site and remaining parameters are obtained from local meteorological station. Moisture sensors, installed at various locations on the façade, monitor time-of-wetness (TOW) and dryness of the façade. Solar radiation sensors placed on the façade measure solar heat received directly by the façade from the sun as well as reflected radiation from the ground and adjacent buildings’ surfaces.
The temperature and humidity of the air determine its dew-point temperature and the partial pressure of the water vapour in the air, which are a measure of moisture content in the air. The two parameters for both outdoor and indoor air affect moisture transport in the building envelope assembly and its drying potential depending on the hygrothermal properties of the building envelope assembly. Solar heat aids in the drying potential of the façade as well as in driving moisture into the building envelope. Solar heat also contributes to freeze-thaw cycles as the heat raises the façade temperature above freezing. Wind-driven-rain is a key mechanism of water entry into building envelopes. Wind pressure is also one of the driving forces of air infiltration and exfiltration through an envelope depending on its air tightness and effectiveness of the air barrier strategy. Infiltration and exfiltration of moisture-laden air poses risk of condensation on envelope surfaces in its path.
Indoor environment: Monitored parameters include temperature and relative humidity of
indoor air. Air pressure differences between interior zones may also be monitored in order to determine the flow pattern of indoor air and its moisture load between interior zones. As noted earlier, the temperature and relative humidity determine the moisture load in indoor air. In winter, as indoor air temperature decreases, frost moves deeper into the wall and the risk of condensation within the envelope assembly increases.
Building envelope health
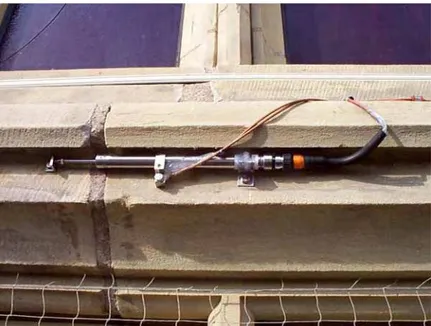
Parameters that monitor performance of building envelopes include: temperature of surfaces in the envelope assembly, heat-flux through the assembly, moisture (TOW and moisture content), air pressure difference across the envelope, and structure movement. Figure 1 shows a photo of an example instrumentation of a masonry wall to monitor its hygrothermal behaviour.
1
2
3
Figure 1. A photo showing an example of instrumentation installed in a masonry wall. Shown are: a pair of stainless-steel screws moisture pins (1), wires for a stone moisture sensor & a thermocouple inserted at 200 mm depth (2), and a thermocouple glued to the surface (3). Notice that attempts are always made to reduce visibility of wires. All photographs by Raymond Demers.
Surface temperature determines its potential for condensation. Temperature variation above and below freezing temperature determines the number of freeze-thaw cycles experienced by the envelope assembly. Temperature cycling also contributes to structure movement and gradual widening of cracks.
Heat flux and the temperature difference across the envelope assembly determine the thermal resistance of the assembly. A decrease in the thermal resistance indicates changes in the thermal insulation value possibly a result of aging, settling, or wetness.
Moisture is a key factor affecting the durability of building envelopes particularly in cold climates where freeze-thaw action can be a major factor. Various types of moisture sensors [8], see Figure 2, are mostly used to monitor TOW of surfaces. Some sensors are used to determine moisture content of the assembly.
Air pressure difference across an envelope assembly determines the likelihood of airflow (infiltration and exfiltration) through openings in the assembly. Air moving through the assembly may contribute to wetting of its surfaces as well as to their drying depending on the dew-point of the air and the temperature of the surfaces along its path.
Figure 2. Various types of moisture sensors, from Left to right: a Sereda, a brick-ceramic, a stone, and a pair of stainless-steel screws moisture pins.
Figure 3. A photo (PT991119) showing a displacement sensor tucked under a windowsill to monitor movement across a repaired crack.
Displacement sensors, Figure 3, are used to monitor movement between adjacent walls with dissimilar construction and movement across existing or repaired cracks. The latter determines whether a crack opening is stable or changing. In special monitoring
programs such as the Peace Tower, vibration sensors may be installed to monitor dynamic movement of the building envelope due to seismic events, blasting, wind, etc.
The Peace Tower
The monitoring program of the Peace Tower is presented, which is an example of a comprehensive monitoring program. It includes both hygrothermal performance and structure movement of the building envelope. The Peace Tower (Figure 4) is a Federal Heritage Building and a National Historic Site in the heart of Canada’s capital Ottawa. It was built between 1919 and 1927 as a memorial for peace following World War I. The Peace Tower is 92 meters tall with exterior base dimensions at the corner buttresses of approximately 13 by 13 meters. The walls are 1.8 meters thick at the base and narrow to 0.6 to 0.9 meters at the observation level just below the clock face. The exterior walls are a composite construction of concrete faced with building stone. Three types of sandstone are used in the walls: Nepean sandstone for the body of the wall and the softer Wallace and Ohio sandstone for decorative features. The walls at the clock level are ashlar stone masonry with no concrete backup. The roof structure is 100 mm thick reinforced concrete with copper roofing over wood battens. A 14-meter high section of the north wall was removed and rebuilt in 1981 to accommodate an inclined elevator shaft, the world’s first slanted elevator. The rebuilt section was built with a steel frame cladded with a 100 mm thick Nepean sandstone veneer. Saïd et al. [7] describes the Peace Tower and its
monitoring program in detail.
Figure 4. View of the south façade of the Peace Tower and the Centre Block (Canada’s Parliament building).
The Monitoring Program
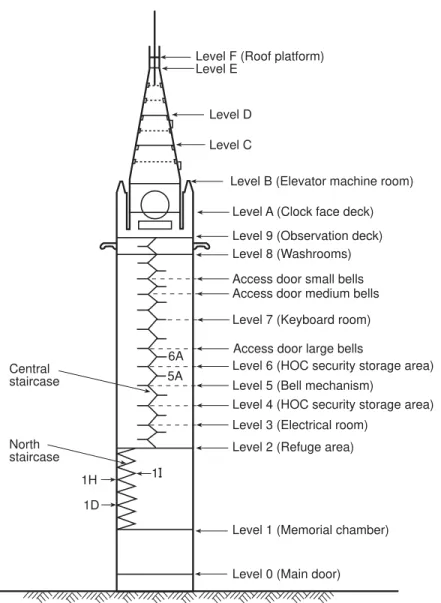
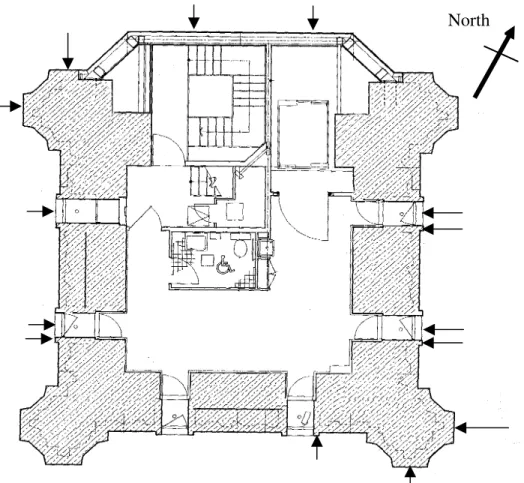
Following completion of the 1996 conservation work of the Peace Tower, approximately 190 sensors were installed in the tower to monitor the health of the composite masonry-concrete exterior walls, particularly the impact of the recent conservation work. The sensors monitor temperature, humidity, moisture, heat flow, air pressure difference across the exterior walls as well as between interior zones, tilt, and movement across selected repaired cracks. In addition, a weather station was installed on the rooftop. Vibration sensors were also installed to monitor the dynamic movement of the tower due to seismic events, elevator movement, ceremonial gun shots, and near by construction excavation. Figure 5 shows schematic of the Peace Tower’s vertical elevation showing monitored levels and Figure 6 shows a plan view at level 2 showing monitored locations. Figures 1 and 3 show some of the installed sensors.
Level 0 (Main door) Level 1 (Memorial chamber) Level 2 (Refuge area) Level 3 (Electrical room) Level 5 (Bell mechanism)
Level 4 (HOC security storage area) Level 6 (HOC security storage area) Level 7 (Keyboard room)
Level 8 (Washrooms) Level 9 (Observation deck) Level A (Clock face deck) Level B (Elevator machine room) Level C
Level D Level E
Level F (Roof platform)
1D 1H 1I 6A 5A Central staircase
Access door small bells Access door medium bells
Access door large bells
North staircase
North
Figure 6. Plan view at Level 2 showing locations of moisture sensors on the façade and in the composite masonry-concrete walls and buttresses.
Selected Monitoring Results
Monitoring results for the period 2004-2005 are presented, which demonstrate the performance information gained from monitored health parameters of the building envelope of the Peace Tower.
Environment exposure conditions
Outdoor environment: In 2005, outdoor exposure conditions were similar to that in the
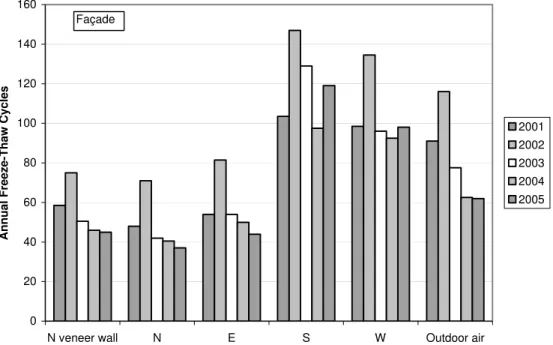
previous year 2004. Outdoor air temperature ranged from -30ºC in January to 35ºC in July. The latter is close to the extreme value 38ºC recorded by Environment Canada for Ottawa. The south face of the SE buttress experienced about 20% more freeze-thaw1 (F/T) cycles than in 2004 (Figure 7, Graph (A)). The other faces of the SE and NW buttresses experienced about the same number of F/T cycles as in 2004. As usual, the south façade (actual orientation is 30° offset) and the west façade experienced the highest number of F/T cycles because these orientations have more exposure to the sun than the north and east façades. Because of its lighter mass construction, the north veneer wall
1
A freeze-thaw cycle is defined as a temperature drop below 0ºC and a return above zero. Within masonry walls, freezing may occur at a lower temperature because of dissolved salts.
experienced higher F/T cycles than the N-face of the NW-buttress (45 cycles compared to 37 cycles). 0 20 40 60 80 100 120 140 160
N veneer wall N E S W Outdoor air
Annual Fr eeze-Thaw Cycles Façade 2001 2002 2003 2004 2005
Graph (A). Annual freeze-thaw cycles experienced by the façade.
0 20 40 60 80 100 120 140 160
N veneer wall N E S W Outdoor air
Annual Fr
eeze-Thaw Cycles
90-mm depth in N veneer wall and 200-mm depth in Buttress 2001 2002 2003 2004 2005
Graph (B). Annual freeze-thaw cycles experienced at 200-mm depth in walls of the NW and SE buttresses and at 90-mm depth in the north veneer wall.
Figure 7. Annual freeze-thaw cycles experienced by the exterior walls at level 2 for the monitoring period 2001 to 2005. Outdoor air is also shown for comparison.
The number of F/T cycles experienced by the south façade (119 cycles) and the west façade (98 cycles) in 2005 is considered high. However, freeze-thaw cycles do not cause damage to the masonry or the mortar unless they have high moisture content (>75% moisture by pore volume). Frost damage potential also depends on the rate of freezing and the pore structure of the material.
Freeze-thaw cycles were also experienced within the exterior walls, but the number of cycles was much less than that experienced by the façade. Figure 7, Graph (B), shows F/T cycles experienced at level 2 at 200-mm depth in the buttresses and at 90-mm depth in the north veneer wall. Similar to the façade, the south and west façades experienced the highest F/T cycles (38 and 32 cycles respectively). At Level 9 (the Observation area level), the number of F/T cycles experienced by the west face at 50-mm depth was in the high side (70 cycles).
The F/T cycles results indicate that the south and west façades should be given priority in the spring inspection in order to insure that mortar joints are in good conditions ahead of the rainy spring and summer seasons. So far frost damage has only been observed in few areas in mortar joints in the west façade at decorative feature areas where snow usually accumulates and areas where snowmelt drains straight onto the masonry. Repair of damaged mortar joints should be given priority because they provide potential paths for water (wind-driven rain, melted snow, and run off water) ingress into the walls.
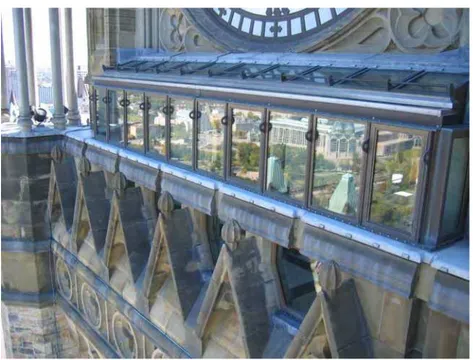
Indoor environment: The control of the conditioned air in the Observation area in 2005
was much better than in the previous year. The air temperature was maintained in the range 22ºC to 25ºC. The relative humidity, not controlled, followed outdoor air RH variations. It ranged from 10% to 30% during winter and 35% to about 60% during summer, which are common seasonal conditions. Under the noted conditions, there was no condensation potential on the walls’ surfaces including the glazing on the north façade. The temperature of the glazing and its frame were always above the air dew point temperature.
In the refuge area (level 2), the baseboard heaters did well in maintaining indoor
temperature around 20ºC during winter. Occasionally the temperature was down to about 12ºC. In the summer months, the temperature followed the variation in outdoor air temperature. It varied from 20ºC to about 30ºC. As expected, indoor air was quite dry during winter where it varied from 6% to 16% in the refuge area. This contributed to the drying of the walls into indoors during winter months. In the summer, RH varied in the range 35% to 60% and occasionally increased to about 70%.
In the roof space, air temperature at the top of the roof space (level E) varied from –13ºC in January to 44ºC in June-July 2005. At the bottom, in level B, air temperature was warmer to about 4ºC in winter because of the electric fan heater. The reverse occurred in the summer; the air temperature in Level B was lower than that in Level E as driven by natural stratification where warmer air rises to the top and cooler air descends to the bottom. The air relative humidity followed humidity variations outdoors. It ranged from quiet dry condition 12% to almost 100%. High relative humidity values were common to both winter and summer. In winter: frost and condensation are common on the glazing
and the concrete walls particularly at level E. The electric fan heater below in level D-2 has small effect on the air temperature at level E. The walls appeared to be managing the frost condition. Frost, however, when formed on the stairs and the concrete floor, present hazard conditions to service personnel.
Exterior walls moisture performance
Moisture in exterior walls: Moisture diffusion and possible capillary suction rates vary
over the tower’s façade because the exterior walls include the hard Nepean stones, the softer Ohio and Nova Scotia Wallace stones, and the mortar. The stones are backed with a less permeable dense concrete. Moisture movement in and out of the walls takes the path of least resistance that is the mortar and the soft stones. As a result, the locations of the soft stones in the exterior walls and buttresses are managing higher moisture load than the locations of the hard Nepean stones. These locations should be checked regularly and given priority in the maintenance program
Figure 8, Graph (A) shows an example of wetness pattern of the west façade of the NW buttress. Moisture pins sensors (stainless-steel screws inserted to a 10-mm depth in a mortar joint) indicated that façade wetness occurred mostly in April to November months. Figure 8, Graph (B) shows the changes in moisture conditions at the 200-mm depth, the stone-concrete interface, in the west façade of the NW buttress. Moisture content started increasing in October and peaked in December-January. This indicates that during the fall-winter months, moisture movement was mostly inward where it accumulated at the less permeable concrete interface. With the start of favorable drying conditions outdoors in the spring, accumulated moisture started to dry to outdoors and the wall returned to its initial moisture conditions in June-July months; i.e. no net moisture accumulation over the 2005 period. Similar moisture variation pattern was observed in the north face of the NW buttress and the south face of the SE buttress.
In the E-face of SE buttress, at the 200-mm depth, the moisture variation pattern was different. Moisture started increasing in May, remained high during the summer months, and returned to its initial conditions in November. Wind driven rain is a primary factor for the noted moisture variation pattern as the east is the prevailing wind driven rain direction in Ottawa. Similar to the other faces, there was no net moisture accumulation over the 2005 period.
Moisture in Wall-cavities: In 2004-2005, the data showed a wetness-drying pattern in the
interior surfaces of the NW and SE buttresses at the level 9 (Observation area). Wetness appeared to increase during November 2004 to March 2005 with occasional drying (return to initial condition). This indicates that the walls were mostly drying to the interior cavity space during these months. The reverse occurred in April as wetness decreased and returned to its initial conditions in May 2005. During the period June to September 2005, wetness cycled between increasing and return to initial conditions. In a visual inspection in September 2007, the north façade at the Observation level appeared damp (see Figure 9). However, the Wallace stone and the mortar joints were in good condition indicating that the wall is managing its moisture load under subjected
environmental conditions. A helping factor is the north façade was subjected to low freeze-thaw cycles (37 cycles in 2005).
0 5000 10000 15000 20000 25000 30000 35000 40000 Ja n-04 Ja n-04 Ma r-04 Ma r-04 Apr -0 4 May-04 Ju n-04 Ju l-04 Aug -04 S e p-04 Oct-0 4 No v-04 De c-04 Ja n-05 Fe b-05 Ma r-05 Apr -0 5 May-05 Ju n-05 Ju l-05 Aug -05 S e p-05 Oct-0 5 No v-05 De c-05 Date W e tn ess (80 0 /R -k oh m )
Graph (A). The façade
0 40 80 120 160 200 Ja n -0 4 J an-04 Ma r-0 4 Ma r-0 4 Ap r-0 4 Ma y -0 4 Ju n -0 4 Ju l-0 4 A u g-04 Se p -0 4 Oc t-0 4 No v -0 4 De c -0 4 Ja n-05 Fe b -0 5 Ma r-0 5 Ap r-0 5 Ma y -0 5 J un-05 Ju l-0 5 A u g-05 Se p -0 5 Oc t-0 5 No v -0 5 De c -0 5 Date W et n ess ( 8 00/ R -k o h m ) Graph (B). At 200 mm depth
Figure 8. Example of wetness variation pattern of the façade and at 200-mm depth of the W-face of the NW buttress, level 2. The vertical scale is an arbitrary wetness scale. It shows changes in moisture conditions. The scale is determined by the formula, 800/R, where R (in k-ohm) is the measured resistance of the moisture sensor.
In the north wall cavity at Level 1I, there was no indication of condensation on the gypsum and steel surfaces during 2005. Their surface temperatures were above the dew point temperature throughout 2005.
Figure 9. Photo showing dampness of the north façade at the Observation level. Notice the good condition of the Wallace stone and the mortar joints. The gray stain is a result of run-off water from the lead flashing above.
Moisture on interior surfaces: There was no indication of surface condensation on the
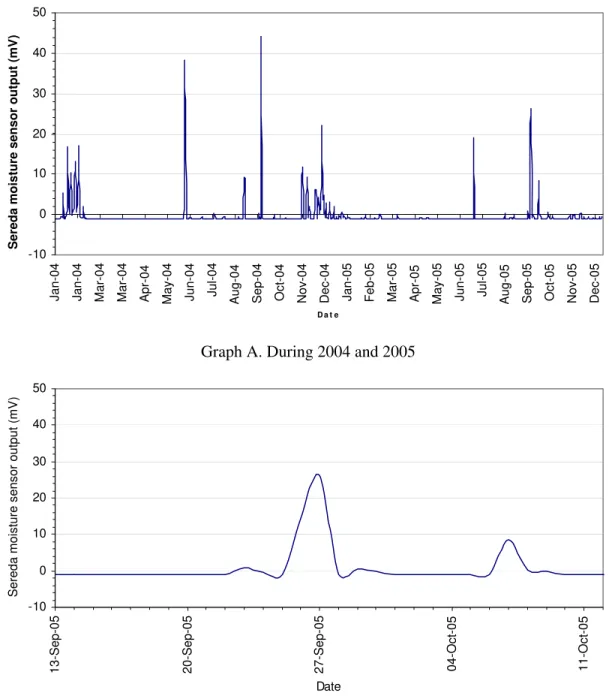
north-glazing units in the Observation area. The surface temperatures of the glazing and the frame were above the dew-point temperature of indoor air during the 2005 period. At the clock level (level A), periods of condensation were recorded in January, July, and October 2005 by the Sereda moisture sensor located by the 6-O’clock numeral on the inside surface of the clock’s north glazing, see Figure 10, Graph A. The condensate dried out within 2 to 3 days (an example is shown in Figure 10, Graph B).
In the roof space, at the top, level E, condensation is prevalent on the interior concrete surfaces from November to May. The surface temperature of the north wall is mostly below the dew-point temperature of indoor air in these months. The condensate turns into frost from December to March when surface temperature dips below freezing. In 2005, the surface temperature of the north wall ranged from –16ºC in January to 36ºC in June-July.
About half way the roof space at Level C, occasional condensation occurred several times on the interior concrete surface during April to November 2005 when temperature of the surfaces fall below indoor air dew-point temperature. The temperature’s usual diurnal variation pattern of the roof’s interior concrete surfaces ranged from about –11ºC in January to 37ºC in June and July, 2005. Indoor air temperature varied from –5ºC in
January to 38ºC in June and July. The air relative humidity varied from 15% in April to 100% in September. -10 0 10 20 30 40 50
Jan-04 Jan-04 Mar-04 Mar-04 Apr-04 May-04 Jun-04 Jul-04 Aug-04 Sep-04 Oct-04 No
v-0
4
De
c-0
4
Jan-05 Feb-05 Mar-05 Apr-05 May-05 Jun-05 Jul-05 Aug-05 Sep-05 Oct-05 No
v-0 5 De c-0 5 D a t e
Sereda moisture sensor output (mV)
Graph A. During 2004 and 2005
-10 0 10 20 30 40 50
13-Sep-05 20-Sep-05 27-Sep-05 04-Oct
-05 11-Oct -05 Date Sereda moist u re sensor out put (mV)
Graph B. Selected period September 13 to October 11, 2005
Figure 10. Periods of condensation recorded by the Sereda moisture sensor located by the 6-O’clock numeral on the inside surface of the clock’s north glazing during 2004 - 2005.
Structural movement:
Structure displacement: Five displacement sensors were placed across former cracks to
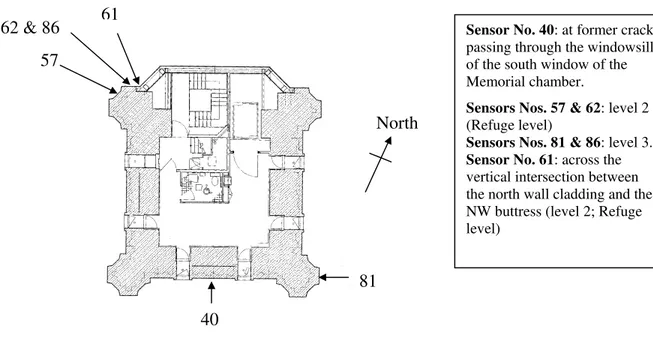
horizontally across the vertical intersection between the north veneer wall and the NW buttress in order to monitor expected movement at the interface of the two claddings. Figure 11 shows the location of the six displacement sensors.
61 62 & 86 57 81 North 40
Sensor No. 40: at former crack passing through the windowsill of the south window of the Memorial chamber.
Sensors Nos. 57 & 62: level 2 (Refuge level)
Sensors Nos. 81 & 86: level 3. Sensor No. 61: across the vertical intersection between the north wall cladding and the NW buttress (level 2; Refuge level)
Figure 11. Locations of the six displacement sensors.
Crack displacement: The displacement sensor (# 40 in Figure 11) located in the south
façade under a windowsill at level 1D changed its normal behaviour in July 2005 (see Figure 12). The displacement showed a gradual contraction leveling off to approximately -1.2 mm. The permanent contraction means that there was no restraint to shrinkage movement probably due to loss of pointing mortar. Figure 3 shows the condition of the mortar joint in November 1999 and Figure 13 shows its condition in September 2007. The displacement at this location is expected and probably was there since the tower’s construction. A finite element analysis [7] indicated that horizontal tension stresses are induced at this location under pure gravity load. Frost damage was probably an aiding factor in the loss of the pointing mortar once it lost adhesion to the stones. The south façade has been experiencing high number of freeze-thaw cycles (see Figure 7). The crack at this location provides a high potential path for water entry into the wall because snow usually accumulates right above it.
The other four displacement sensors located across former cracks indicated possible hairline cracks that have remained stable. The displacement sensor located across the intersection of the north veneer wall and the NW buttress showed a displacement of about 0.5 mm, which is expected because of the light construction of the north veneer wall and the heavy construction of the buttress.
-4 -3 -2 -1 0 1 2 3
01-Jan-04 01-May-04 31-Aug-04 31-Dec-04 01-May-05 31-Aug-05 31-Dec-05
2 0 0 4 - 2 0 0 5
Displacement (mm
)
LVDT # 40
Figure 12. Displacement under a windowsill in the south façade at level 1D over 2004 – 2005 monitoring period. Daily values are based on hourly average before midnight; datum value is January 1st, 2000 and displacement is corrected for temperature.
Figure 13. Photo (Pt070920-24) showing the condition of the mortar joint in September 2007.
Structure Tilt: The tilt of the tower along its two E-W and N-S axes is measured at the
following three locations over the height of the tower:
• level B (bottom of roof space) about 68-m above ground level (about 3/4 Tower’s height). Level B has three tilt sensors; one measures the tilt in the N-S direction and two sensors measure tilt in the E-W direction placed opposite to each other on the north and south walls, and
• level E (top of the roof) about 89-m above ground level.
The tower’s tilt in both the E-W and N-S directions, with one exception, showed the normal yearly cyclical movements and appear to gradually increase in value with time (Figure 14). The exception occurred at Level 2, where the tilt meter in the E-W direction hardly showed any annual cyclical movement and seems to gradually decrease in value with time. This suggests that there is a very small gradual change in the tower’s structure. Also the very small tilt in the E-W direction at level 2 is due to restrain by the connection to the Center Block building close to this level.
Over 2004 – 2005 period, the largest tilt movement was about 1 mm/m in the E-W direction at the top of the tower. The resulted tilt behaviour of the structure is a result of its 30º offset, which expose the E, W, and S façades to the sunrise and sunset heat.
-1.0 -0.8 -0.6 -0.4 -0.2 0.0 0.2 0.4 0.6 0.8 1.0 1.2 1.4
01-Jan-04 01-May-04 31-Aug-04 31-Dec-04 01-May-05 31-Aug-05 31-Dec-05
Jan 2004 - Dec 2005 Tilt (mm/m) Lev el E Lev el 2 Lev el B ( N w all) Lev el B ( S w all)
Figure 14. Tower’s tilt in the E-W direction at levels over the period 2004-2005.
Conclusion
The paper discussed in situ monitoring of building envelopes’ health as a tool to improve their durability and nourish their sustainability. Monitoring helps reduce the building envelope impact on the environment by two factors: reducing impact of demolition’s waste on landfills and reducing the embodied energy and carbon dioxide emission associated with waste material. By shedding the light on the underlying factors for durability issues, monitoring results ensure effective maintenance and repair strategies.
Feedback from in situ performance of building envelope designs and retrofits contributes to development of effective design and maintenance guidelines.
The paper also discussed common monitoring parameters that include outdoor and indoor environment exposure conditions, building envelope hygrothermal behaviour, and
structure movement. The monitoring program of the heritage building, the Peace Tower, has been presented to demonstrate the performance information gained from such monitoring program.
Monitoring results indicated areas in the façade requiring priority in the inspection and maintenance programs. This included:
- The south and west façades because they are experiencing high number of freeze-thaw cycles. It is important to insure that mortar joints are in good conditions ahead of the rainy season. Openings created by the loss of the pointing-mortar provide high potential path for water entry into the wall, which would greatly affect the durability of the walls.
- The soft-stone areas in the façade because they are managing higher moisture load than the hard stone areas.
Moisture sensors in the masonry-concrete walls provided information on moisture
condition, a key parameter affecting the walls’ durability. Results showed the wetting and drying pattern of the walls. During the fall-winter months, moisture movement was mostly inward, where it accumulated at the less permeable concrete interface. In the spring, accumulated moisture dried to outdoors and the walls returned to its initial moisture conditions in June-July months. Thus, over the 2005 monitoring period, there was no net moisture accumulation in the exterior walls and they appeared to be managing their moisture load well.
Displacement sensors showed long-term movement trend of former cracks. Some sensors indicated possible hairline cracks that have remained stable. The sensor monitoring a repaired crack under a windowsill in the south façade showed a gradual contraction leveling off to approximately -1.2 mm a result of pointing mortar loss. Frost damage was probably an aiding factor in the loss of the pointing mortar once it lost adhesion to the stones. The crack at this location provides a high potential path for water entry into the wall because snow usually accumulates right above it.
In conclusion, the monitoring program provided an insight into in situ performance of the composite masonry-concrete wall system as well as the use of hard and soft stones in the cladding. The monitoring system continues keeping an eye on the health of the heritage tower’s building envelope and provides information that help ensure its longevity.
Acknowledgement
The authors gratefully acknowledge the contribution of Dr. Paul Maurenbrecher in the analysis of the structure movement results. The authors also acknowledge the
contribution of Mr. Rob Melanson of the Heritage Conservation Directorate, Public Works and Government Services Canada, who maintains the database and the website of monitoring results.
References
1. Raiswell, J. 2007. City unveils waste-management options. Construction Comment,
September, Publisher: The Ottawa Construction Association, pp. 35-37.
2. Maurenbrecher, A.H.P.; Saïd, M.N.; Fontaine, L. 2003. Monitoring non-structural
performance of exterior masonry walls. Proceedings of RILEM TC 177-MDT
Workshop on Site Control and Non-Destructive Evaluation of Masonry Structures and Materials (Mantova, Italy, 2001-11-12), October, pp. 119-128.
http://irc.nrc-cnrc.gc.ca/fulltext/nrcc45358/
3. Saïd, M.N.A., W.C. Brown, and I.S. Walker. 1997. Long-Term Field Monitoring of
an EIFS Clad Wall. Journal of Thermal Insulation and Building Envelopes, V. 20,
April, pp. 320-338. URL: http://irc.nrc-cnrc.gc.ca/pubs/fulltext/nrcc41075.pdf
4. Maurenbrecher, A.H.P., C.J. Shirtliffe, M.Z. Rousseau, and M.N.A. Saïd. 1998.
Monitoring the Hygrothermal Performance of a Masonry Wall With and Without Thermal Insulation. Proceedings of the 8th Canadian Masonry Symposium, Jasper,
Alberta, Canada, June 1998.
5. Saïd, M.N.A., W.C. Brown, C.J. Shirtliffe, A.H.P. Maurenbrecher. 1999. Monitoring
of the Building Envelope of a Heritage House - A Case Study. Energy and Buildings
Journal, Vol. 30, No. 3, August 1999, pp. 211-219. URL: http://www.nrc.ca/irc/fulltext/nrcc40629.pdf
6. Saïd, M.N.; Demers, R.G.; McSheffrey, L.L. 2003. Hygrothermal performance of a
masonry wall retrofitted with interior insulation. Proceedings of the 2nd International Conference on Building Physics, Sept. 14-18, Antwerpen, Belgium, pp. 445-454.
http://irc.nrc-cnrc.gc.ca/fulltext/nrcc46109/
7. Saïd, M.N, D. Duchesne, A.H. P. Maurenbrecher, K. Ibrahim, C. Lumsdon, and D. Stephenson. 2005. Monitoring the long-term Performance of a Heritage Building –
The Peace Tower. APT Bulletin, 36, (1), May 01, pp. 53-59.
URL: http://irc.nrc-cnrc.gc.ca/fulltext/nrcc47706/.
8. Saïd, M.N.A. 2007. Measurement methods of moisture in building envelopes - a
literature review. International Journal of Architectural Heritage, 1 (3), July, pp.
293-310, July 01, 2007, (NRCC-50039)