Publisher’s version / Version de l'éditeur:
Journal of chemical education, 83, 12, 2006-12-01
READ THESE TERMS AND CONDITIONS CAREFULLY BEFORE USING THIS WEBSITE. https://nrc-publications.canada.ca/eng/copyright
Vous avez des questions? Nous pouvons vous aider. Pour communiquer directement avec un auteur, consultez la première page de la revue dans laquelle son article a été publié afin de trouver ses coordonnées. Si vous n’arrivez pas à les repérer, communiquez avec nous à PublicationsArchive-ArchivesPublications@nrc-cnrc.gc.ca.
Questions? Contact the NRC Publications Archive team at
PublicationsArchive-ArchivesPublications@nrc-cnrc.gc.ca. If you wish to email the authors directly, please see the first page of the publication for their contact information.
NRC Publications Archive
Archives des publications du CNRC
This publication could be one of several versions: author’s original, accepted manuscript or the publisher’s version. / La version de cette publication peut être l’une des suivantes : la version prépublication de l’auteur, la version acceptée du manuscrit ou la version de l’éditeur.
For the publisher’s version, please access the DOI link below./ Pour consulter la version de l’éditeur, utilisez le lien DOI ci-dessous.
https://doi.org/10.1021/ed083p1761.2
Access and use of this website and the material on it are subject to the Terms and Conditions set forth at
Understanding isotopic distributions in mass spectrometry [Letter]
Meija, J.
https://publications-cnrc.canada.ca/fra/droits
L’accès à ce site Web et l’utilisation de son contenu sont assujettis aux conditions présentées dans le site LISEZ CES CONDITIONS ATTENTIVEMENT AVANT D’UTILISER CE SITE WEB.
NRC Publications Record / Notice d'Archives des publications de CNRC:
https://nrc-publications.canada.ca/eng/view/object/?id=fe23e6c2-2c58-4c43-9c3d-7402d89373ec https://publications-cnrc.canada.ca/fra/voir/objet/?id=fe23e6c2-2c58-4c43-9c3d-7402d89373ec
Chemical Education Today
www.JCE.DivCHED.org • Vol. 83 No. 12 December 2006 • Journal of Chemical Education 1761
Letters
Understanding Isotopic Distributions in Mass Spectrometry
The article “Using Punnet Squares to Facilitate Students’ Understanding of Isotopic Distributions in Mass Spectrom-etry” by Lawrence T. Sein, Jr. (1) is an interesting attempt to promote the understanding of the construction of isotopic distributions at the same time showing an interesting rela-tionship between the isotope patterns and genetic traits. Here I want to bring to your attention an alternative simple graphi-cal tool for obtaining complex isotopic distributions.
It is known that isotope patterns of molecules and ions form according to the binomial expansion (2). The peren-nial Pascal’s triangle is a graphical form of such an expansion and it is easy to see that the coefficients in the standard Pascal’s triangle resemble the isotope patterns of bromine. Although the use of Pascal’s triangle is widely advocated in textbook explanations of multiplets in 1H NMR spectra, considerably
less attention is paid to the fact that isotopic distributions of molecules can be explained in a similar fashion. As a slight modification of the standard Pascal’s triangle, isotopic distri-butions can be rendered in the form of cellular automata, which generate complex isotopic patterns in an education-ally friendly manner (3).
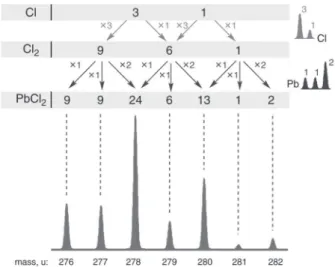
As an example, the isotope pattern of PbCl2 can be
con-sidered. Lead has three isotopes in a ratio of ∼1:1:2 (206Pb, 207Pb, and 208Pb) and chlorine has two isotopes in a ratio of
∼3:1 (35Cl and 37Cl). The rather complex isotopic
distribu-tion of PbCl2 can be easily obtained as shown in Figure 1. In
this process, the isotopic distribution of PbCl2 is obtained
in two consecutive steps: first, the isotopic distribution of Cl2 is obtained and then the isotopic distribution of Pb is
added leading to the PbCl2. Such construction of complex
isotope patterns captures the very essence of the problem— complex isotope patterns can be generated using very simple rules. As can be seen from the above example, no calculators are needed to obtain the isotopic distribution of PbCl2.
Figure 1. Complex isotopic distribution of PbCl2.
Literature Cited
1. Sein, Lawrence T., Jr. J. Chem. Educ. 2006, 83, 228–232. 2. Margrave, J. L.; Polansky, R. B. J. Chem. Educ. 1962, 39, 335–337. 3. Meija, J. Anal. Bioanal. Chem. 2006, 385, 486–499.
Juris Meija
Institute for National Measurement Standards National Research Council Canada
Ottawa, ON K1A 0R6 juris.meija@nrc-cnrc.gc.ca