Publisher’s version / Version de l'éditeur:
Vous avez des questions? Nous pouvons vous aider. Pour communiquer directement avec un auteur, consultez la première page de la revue dans laquelle son article a été publié afin de trouver ses coordonnées. Si vous n’arrivez pas à les repérer, communiquez avec nous à PublicationsArchive-ArchivesPublications@nrc-cnrc.gc.ca.
Questions? Contact the NRC Publications Archive team at
PublicationsArchive-ArchivesPublications@nrc-cnrc.gc.ca. If you wish to email the authors directly, please see the first page of the publication for their contact information.
https://publications-cnrc.canada.ca/fra/droits
L’accès à ce site Web et l’utilisation de son contenu sont assujettis aux conditions présentées dans le site
LISEZ CES CONDITIONS ATTENTIVEMENT AVANT D’UTILISER CE SITE WEB.
TAC Annual Conference [Proceedings], pp. 1-18, 2005-09-01
READ THESE TERMS AND CONDITIONS CAREFULLY BEFORE USING THIS WEBSITE.
https://nrc-publications.canada.ca/eng/copyright
NRC Publications Archive Record / Notice des Archives des publications du CNRC :
https://nrc-publications.canada.ca/eng/view/object/?id=7711fcbd-765c-4eb8-883a-46e5c6146369 https://publications-cnrc.canada.ca/fra/voir/objet/?id=7711fcbd-765c-4eb8-883a-46e5c6146369
NRC Publications Archive
Archives des publications du CNRC
This publication could be one of several versions: author’s original, accepted manuscript or the publisher’s version. / La version de cette publication peut être l’une des suivantes : la version prépublication de l’auteur, la version acceptée du manuscrit ou la version de l’éditeur.
Access and use of this website and the material on it are subject to the Terms and Conditions set forth at Review of the new mechanistic-empirical pavement design guide - a material characterization perspective
http://irc.nrc-cnrc.gc.ca
N a t i o n a l R e s e a r c h C o u n c i l C a n a d a
Revie w of t he ne w m e cha nist ic
-e m piric a l pav-e m -e nt d-e sign
guide – a m at e ria l
cha ra c t e rizat ion pe rspe c t ive
N R C C - 4 6 0 1 8
Z e g h a l , M . ; A d a m , Y . E . ; A l i , O . ;
E l h u s s e i n H . M o h a m e d
A version of this document is published in / Une version de ce document se trouve dans:
TAC Annual Conference, Calgary, Alberta, Sept. 18-21, 2005, pp. 1-18
REVIEW OF THE NEW MECHANISTIC-EMPIRICAL PAVEMENT
DESIGN GUIDE - A MATERIAL CHARACTERIZATION PERSPECTIVE
Morched Zeghal, National Research Council Canada Yassin E. Adam, Carleton University
Osman Ali, Carleton University
Elhussein H. Mohamed, National Research Council Canada
Paper prepared for presentation
At the Investing in New Materials, Products and Processes Session
of the 2005 Annual Conference of the Transportation Association of Canada
ABSTRACT
Characterization of pavement materials in the three hierarchical design levels of the proposed mechanistic-empirical pavement design (MEPD) guide involves application of the dynamic modulus technique for asphalt concrete and the resilient modulus for unbound materials. This approach, if adequately implemented, is expected to improve the road design processes. The advance design level recommends using actual laboratory test data of the dynamic and resilient modulus determined under simulated environmental and traffic loading conditions. To circumvent the need for conducting the mechanical test in lower design levels, predictive equations and correlations established with physical properties are used to estimate the mechanistic properties needed as input to the design software. This paper examines the simplifications incorporated in the model using results of dynamic and resilient modulus tests performed at the National Research Council Canada (NRC).
Analysis of the data revealed that rating of materials is not consistent and mainly follows current binder and unbound material classifications, which does not necessarily conform to the actual response. Comparison between AC dynamic modulus measured in the laboratory and that predicted by the model lead to a relatively high average percent difference of 77%. Accordingly, an alternative approach is offered in this paper for adopting generic AC dynamic modulus values which may be developed from limited tests performed on local mixes and compiled in a database (material library). The paper discusses the accuracy expected from this alternative in comparison with the MEPD guide proposed approach involving the use of an empirical predictive equation.
INTRODUCTION
Effective characterization of pavement materials is a key requirement for a successful design. To be effective and useful for pavement design, characterization should be based on material properties that accurately capture the material response to external stimuli of traffic loading as influenced by construction quality and environmental conditions. The proposed AASHTO guide is mechanistic-empirical in nature and advocates the use of some mechanical properties such as the dynamic modulus of asphalt concrete and the resilient modulus of unbound materials, which include granular materials and native soils.
The guide provides 3 levels of input depending on the criticality of the project, the sensitivity of the pavement performance to a given input, the resources available to the designer, and the availability of input information at the time of the design.
Level 1: Site and/or material specific inputs for the project are to be obtained through direct
testing or measurements. This level of input uses the state of the art techniques for characterization of the materials such as the dynamic modulus of HMA as well as characterization of traffic through collection of data from weigh-in-motion (WIM) stations.
Level 2: Correlations are established in the model to determine the required inputs. For example,
the dynamic modulus could be estimated based on results of tests performed on binders, aggregate gradation and mix properties. The level of accuracy for this category is considered as intermediate.
Level 3: This level produces the lowest accuracy. Inputs are typically user selected from national
or regional default values, such as characterizing the HMA using its physical properties (gradation) and type of binder used.
The two major material properties applied as input in Level 1 and 3 were evaluated analytically and in the laboratory. Results related to the dynamic and resilient modulus are discussed separately.
DYNAMIC MODULUS
The dynamic modulus is intended to feature the response of asphalt concrete as affected by mix type, mat temperature and rate of loading. In the proposed AASHTO guide, the effect of temperature and rate of loading is determined from a master curve constructed at a recommended reference temperature of 70o F. The means for obtaining a value for dynamic moduli at different temperatures and loading frequencies differs from one input level to another. At input level 1, the dynamic modulus is determined directly in the laboratory by performing the complex modulus test at different temperatures and loading frequencies according to the guidelines set in the NCHRP 1-28A project. At input level 2 and 3, the complex modulus test is not required and the dynamic modulus is estimated using a predictive equation.
Before furnishing material laboratories with equipment capable of performing the dynamic modulus test, Canadian users of the proposed AASHTO design guide are expected to rely on input level 3; making the accuracy of predictive equation that estimates the dynamic modulus an important parameter to evaluate. In this paper, the evaluation process relied on comparison between model predictions and actual laboratory measurements of the dynamic modulus for typical asphalt concrete mixes.
The complex modulus testing approach focuses on capturing the viscoelastic response of AC materials where traffic loading is simulated in the laboratory with a sinusoidal load. The response of the material is also sinusoidal in nature but with a phase lag [1] as shown in Figure 1. Asphalt concrete is subjected to loadings at different frequencies within the linear viscoelastic range. Equation 1 gives stress applied to the laboratory sample
σ = σ0Sin (ω.t) ...[1]
Equation 2 gives the corresponding strain
ε = ε0Sin (ω.t-φ) ...[2]
Where σ0 is the stress amplitude, ε0 is the strain amplitude (see Figure 1) and ω is the angular
velocity related to the frequency f by Equation 3:
ω = 2πf ...……...[3]
φ is the phase angle related to the time that the strain lags the stress. The phase angle is an indicator of the degree of the viscoelastic behaviour of asphalt concrete with values between 0 and π/2. A value of 0 is an indicator of a purely elastic behaviour, while a value of π/2 is an indicator of a purely viscous behaviour.
It is useful to express the sinusoidal relations in the complex notation in which they are commonly dealt with. Hence, the previous functions can be rewritten as in Equation 4:
0.
iwt e
σ σ= ...………...[4] Equation 5 gives the corresponding strain:
( 0. i wt e φ) ε ε= − ...……...[5]
There is general agreement among researchers about the effectiveness of the complex modulus concept in evaluating the fundamental stress-strain response of asphalt concrete mixes. The modulus is a complex number, which defines the relationship between the stress and strain for a linear viscoelastic material subjected to sinusoidal loading. The real part of the complex modulus is a measure of the material elasticity and the imaginary part is a measure of the viscosity. The complex modulus is defined (by analogy to the Young modulus of elasticity) as shown in Equation 6 [2]: 0 1 0 * ( ) i E iw σ σ eφ E iE2 ε ε = = = + ...[6] The ratio of the stress to strain amplitudes defines the absolute value of the complex modulus known as the dynamic modulus and is expressed by Equation 7:
* 0 0
E σ
ε
= ...………..[7] The dynamic modulus is the only component of the complex modulus that has been implemented in the proposed AASHTO guide. The structural response model of the guide is based on linear elasticity, and hence, the phase angle is not being considered in the analysis. Future development in mechanics may make it possible to incorporate the effect of the phase angle in the structural response model.
The laboratory investigation performed (at NRC) as part of this study covered a wide range of HMA (hot mix asphalt) mixes prepared with different binders (PG 58-22, PG 64-34 and PG 52-34). Ministry of Transportation of Ontario (MTO) specifications [3] were followed in designing the mixes (HL3, HL4 and HL8). AASHTO specifications [4] were followed to design two Superpave mixes. The results of physical and mechanical tests are discussed in the following sections to compare measured dynamic modulus with those estimated from physical properties using the predictive equation incorporated in the proposed AASHTO guide.
PREDICTIVE EQUATION
Although the proposed AASHTO guide considers laboratory measured dynamic modulus to be the accurate approach for characterizing AC materials, many empirical predictive equations were evaluated and an improved version of the 1996 formula developed by Fonseca and Witczak [5] was finally incorporated in the guide. The formula (Equation 8) estimates the dynamic modulus based on aggregates gradation and asphalt binder properties.
* 2 200 200 4 2 4 38 38 ( 0.603313 0.313351log 0.393532 log ) log 1.249937 0.029232 0.001767( ) 0.002841 0.058097 [3.871977 0.0021 0.00395 0.000017( ) 0.00547 ] 0.802208 ( ) 1 a beff f beff a E P P P V P P P V V e− − − η = − + − + − − + − + − + + + 34 V P ..[8] where: *
E = Asphalt mix dynamic modulus, in 106 psi η = Bitumen viscosity, in 106
poise,
f = Loading frequency, in Hz,
Va= Percent air voids in the mix, by volume,
P34, P38, P4, P200= Percent retained on ¾”, 3/8”, No. 4, No. 200 sieves, by total aggregate weight
The predictive equation was used in this study to estimate the dynamic modulus of the mixes designed and tested at NRC. Predicted and measured dynamic modulus values are discussed in the following section.
MEASURED VS. PREDICTED DYNAMIC MODULI
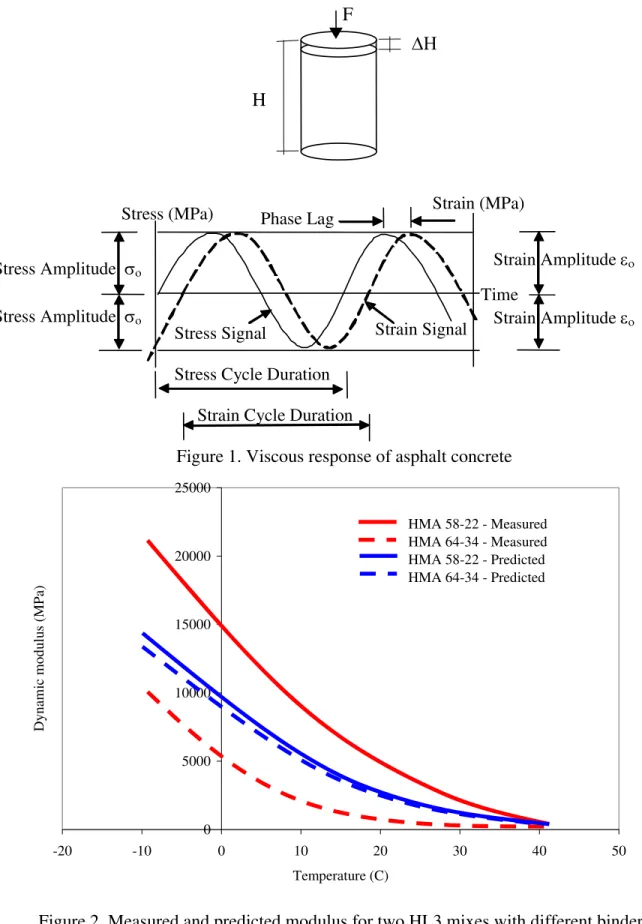
The results of the NRC testing program are used in general to gauge the merit of the dynamic modulus concept in characterizing asphalt concrete materials. The ability of the dynamic modulus to discriminate between two mixes prepared with uniquely different binder types (PG 64-34 and PG 58-22) is demonstrated in Figure 2. The response of the engineered binder (PG 64-34), compared with the neat binder, suggests that the objectives of the binder design aimed at reducing its brittleness at low temperatures in order to minimize the potential for cracking, are fulfilled. The measured dynamic modulus of the HL3 mix prepared with a PG 64-34 binder is half that prepared with a PG 58-22 binder (see Figure 2). However, both binders produced similar dynamic modulus values at relatively high temperatures, reinforcing the role-played by the aggregate skeleton at such a condition.
The level 3 inputs (produced from the laboratory test) pertaining to the same mixes were used to estimate the dynamic modulus. Dynamic modulus values predicted for the different temperatures for the two binders are shown in Figure 2. The predictive equation managed to correctly rate the mix response at low temperatures as influenced by the properties of the two binders. However, the predictive equation was less successful in quantifying the difference between the two binders as measured in the laboratory using the complex modulus test. The predictions of the response for two binders suggest a difference of less than 10 % whereas the measured response reflected a difference of 100%.
Comparison between the complex modulus test and the predictive equation was also performed on Superpave mixes with a nominal maximum aggregates size of 19 mm and the same gradation. Two binders, PG 58-22 and PG 52-34, were used to prepare the two mixes. The results of the complex modulus test, plotted in Figure 3, properly rated the two mixes based on the response measured at low temperature. The results of the test discriminated between the different binders where the mix prepared with the PG 52-34 binder showed less stiffness at low temperatures. Dynamic modulus estimates produced using the predictive equation incorporated in the proposed AASHTO guide are also shown in Figure 3. The estimates made by the predictive equation produced an accurate rating. However, similar to the previous mixes, it was less successful in quantifying the difference between the two Superpave mixes. The difference between dynamic modulus values estimated by the equation was only 32% while that calculated from results obtained from direct measurements made in the laboratory reached 110%.
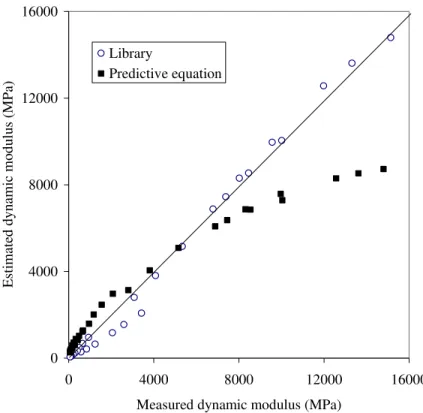
Data points (representing all mixes examined in this study) as produced using the predictive equation and laboratory measurements were plotted in Figure 4 to further evaluate capabilities of the predictive equation in estimating the dynamic modulus. Comparison between estimated and measured values was conducted examining the distribution of data points along the equality line drawn at 45o. Points located above this line indicate that equation over-predicted the dynamic modulus value and those below indicate under-prediction. Actual coordinates of data points (measured and predicted) were used in this study to quantify deviation of predicted values from
those measured in the laboratory. Lines that represent different percentages of deviations from the equality line were used to highlight deviation observed under different conditions. The results show that the predictive equation over-estimated the value of the dynamic modulus under conditions of relatively high temperature and low loading frequency (represented in Figure 4 by measured values that were lower than 5000 MPa. The deviation reached as high as 300% under these conditions. Data for measurements made above the 5000 MPa modulus value are scattered above and below the equality line with prevalence of over-estimation, which reached as high as 100%. The average percent differecne calculated considering all data points produced by the predictive equation was 77%.
ALTERNATIVE TO PREDICTIVE EQUATIONS
Further analysis was performed to examine the impact of the error in prediction and to seek an alternative solution. Early applications of the proposed AASHTO guide in Canada will be confronted with the absence of adequate resources for producing the mechanistic properties in the laboratory to perform Level 1 design. Accordingly, reliance will be on Level 2 and 3 inputs to analyze and design the road structure. These two design levels rely on the predictive equation discussed earlier to estimate the mechanistic properties needed by the software. The significant difference between measured and predicted dynamic modulus values may produce inaccurate designs and discourage users from implementing the proposed guide. This part of the paper discusses an NRC proposed initiative for pursuing an alternative to the predictive equation. Instead of relying on the predictive equation, a material library populated with results from a limited number of laboratory tests conducted on local mixes may be used as input for running the software. Results of the NRC pilot study that compared between the predictive equation and the use of the produced generic data listed in the material library are discussed in this section to convey the benefits gained from implementing this alternative approach.
Typical HMA mixes were designed in accordance with MTO specifications including dense hot mix asphalt (HL4) and coarse graded mixes (HL8). Two gradations for each mix type were selected, one to simulate the generic value listed in the Library and the other to represent an actual mix portrayed as the job mix formula. The aggregate gradation specifications of the four mixes used in this study are shown in Figures 5 and 6. Physical properties (Table 1) and mechanical properties (Table 2 and 3) were analyzed and later used as input for running the proposed AASHTO design and analysis software.
Plot of the dynamic modulus for the HL4 mix, listed in the Library to represent the generic value, against that measured for the job mix formula is shown in Figure 7. Similarly, actual dynamic modulus measured in the laboratory and that estimated by the predictive equation were plotted in the same figure. From Figure 7, it is clear that the error in estimating the dynamic modulus using the predictive equation far exceeds that resulting from the use of Library generic values. The average percent error in the determined dynamic modulus for relatively high temperature and low loading frequency (EHL4 less than 4000Mpa) is 35% when the pilot Library value is used
compared with 149% when the predictive equation is used. A Similar trend is observed in the results of the HL8 mix shown in Figure 8. The average percent error for relatively high temperature and low loading frequency (EHL8 less than 5000Mpa) is 30% when pilot Library
value is used compared with 121% when the predictive equation is used. These differences reflected on performance predictions made by the proposed AASHTO design guide software
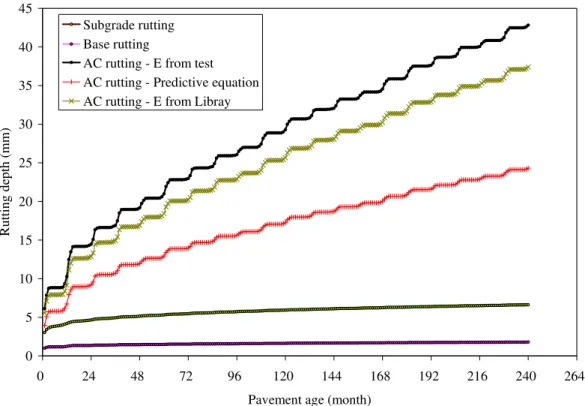
(Beta version available in the web). Rutting predictions for mix HL4 evaluated for the three dynamic modulus scenarios that represent actual laboratory measurements (used as a reference for other values), Library values and predictive equation estimate are shown in Figure 9. Similar inputs were used in the software runs for all other parameters (road structure, traffic, environment, base and subgrade materials, etc). As shown in Figure 9, application of the dynamic modulus value estimated by the predictive equation resulted in underestimating rutting by 45%. On the other hand, the use of the dynamic modulus corresponding to mix HL4 listed in the pilot Library underestimated the rutting potential by only 12%.
Analysis provided in this section compared between AC dynamic modulus measured directly in the laboratory and estimates based on two approaches involving either the use of generic values produced from limited tests and listed in a material library or through the predictive equation incorporated in the proposed AASHTO guide. Because the error associated with application of a generic modulus value has been found to be significantly lower than that associated with the use of the predictive equation, researchers at NRC are pursuing the development of a material library, which could be populated with local mix properties using the results of a limited number of tests. The small number of tests performed in this pilot study suggests the need for a larger testing program to cover a wide range of HMA mixes involving a wide range of binder types and
aggregate gradations covering different geographical zones. Such an R&D investigation is needed to confirm findings of this study and to provide potential users of the proposed AASHTO guide with the opportunity to evaluate the software under relevant local conditions and practice.
RESILIENT MODULUS FOR UNBOUND MATERIALS
The resilient modulus parameter was adopted for the characterization of unbound materials in the proposed AASHTO design guide. The resilient modulus along with the Poisson’s ratio is used in the pavement response model to quantify the stress dependent stiffness of unbound materials layers. The resilient modulus, Mr, is defined as the ratio of the applied deviator stress, (σd) to the recoverable resilient strain (εr):
r d r M ε σ = ... [9] Different levels of input are incorporated in the proposed guide as a mean for obtaining the resilient modulus of unbound layers. Level 1 resilient modulus is determined from laboratory testing of representative material samples. Two standard test methods are recommended in the guide (NCHRP 1-28A and AASHTO 307). Results of the laboratory test are used to determine the non-linear elastic coefficients and exponents of the generalized model (Equation 10).
3 2 1 1 k a oct k a a r p p p k M ⎟⎟ ⎠ ⎞ ⎜⎜ ⎝ ⎛ + ⎟⎟ ⎠ ⎞ ⎜⎜ ⎝ ⎛ = θ τ ………[10] where
Mr: resilient modulus (psi) Pa: Atmospheric pressure
σ1: Major principal stress
σ3: Minor principal stress
τoct: Octahedral shear stress
k1, k2 and k3: regression constants
Currently there is no access in the model to level 1 input, and hence, no evaluation has been performed in this study to examine the proposed characterization of unbound materials at this level. At level 2 inputs, the resilient modulus may be estimated using the correlations (with other material properties such as the CBR, R-value, and plasticity index and gradation) established in the model. At level 3 inputs, typical resilient modulus values and ranges are recommended based on AASHTO and unified soil classifications.
In the absence of laboratory resources for conducting the resilient modulus, Canadian users of the proposed guide are expected to rely on levels 2 and 3. The effectiveness of the approach of using physical properties as indicators of the expected mechanical response of unbound materials was evaluated in this study. The study examined two granular materials (Granular A and B), which were tested in the laboratory using standard AASHTO techniques for evaluation of physical and mechanical properties. Relevant properties for the two materials, considered suitable for the construction of a base course, are shown in Table 4. Based on the determined physical properties, these materials are classified as A-1-a according to AASHTO specifications. Using input level 3 and entering the material class, one resilient modulus range will be proposed. Commonly, users are expected to select the average of the two limits. However, laboratory experiments conducted at NRC revealed that the measured resilient modulus of the two materials differed substantially from the recommended average (see Table 4). Actually, measured modulus of the two materials was found to be outside the proposed range, one above and one below the two limits.
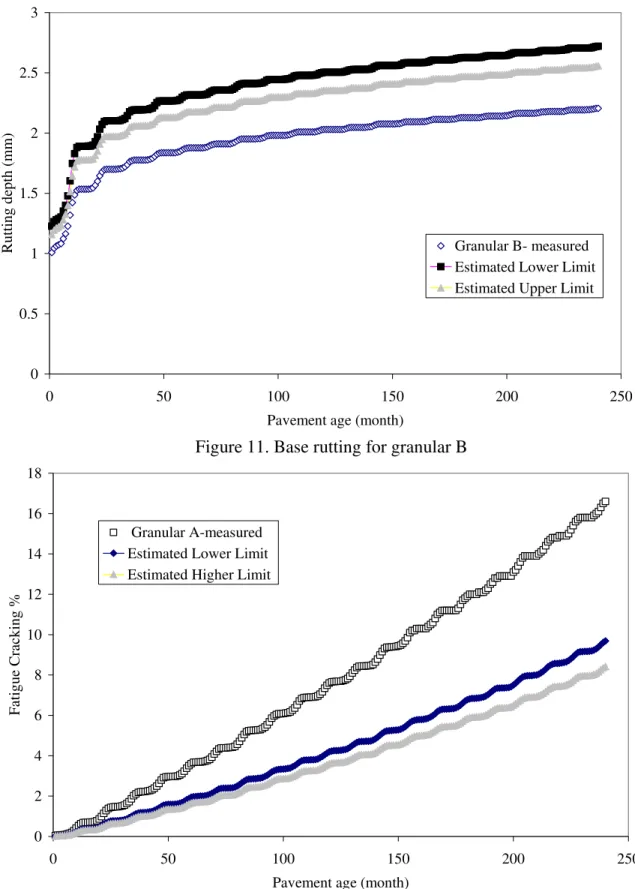
To highlight the impact of the difference between measured and recommended modulus, the software of the proposed AASHTO guide was used to predict the performance associated with the four different moduli. Base rutting and bottom-up fatigue cracking were selected as the performance criteria for the software applications. Base rutting predictions are shown in Figures 10 and 11. Base rutting predictions were different for the different modulus values used as input. The application of the two resilient moduli limits proposed in the guide resulted in the prediction of relatively low rutting, which is similar for both materials. However, the application of the modulus measured in the laboratory for Granular A resulted in a base rutting magnitude that is 25% higher than that produced based on applying modulus values estimated by the guide (see Figure 10). Similarly, the application of the modulus measured in the laboratory for Granular B resulted in a base rutting that is 20% lower than that produced based on applying modulus values estimated by the guide (see Figure 11). Reliance on AASHTO classification to estimate the resilient modulus, as suggested in the proposed guide, may underestimate or overestimate base rutting.
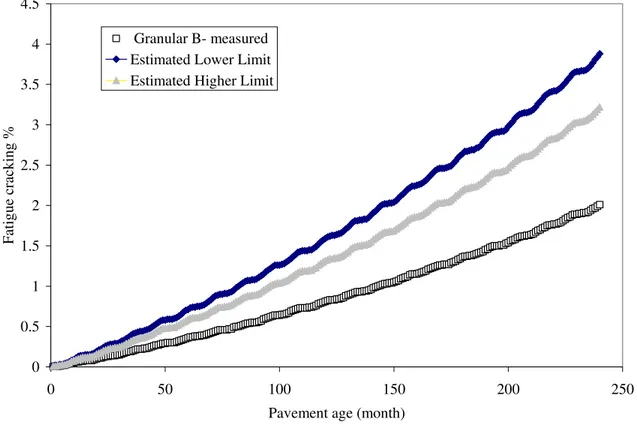
Similarly, analysis based on another performance criteria, namely fatigue cracking, produced high error when the resilient modulus estimated by the proposed AASHTO guide was used instead of actual values measured in the laboratory (see Figures 12 and 13). For granular A, an underestimation of 45% was predicted (see Figure 12) and for granular B and overestimation of 77% was noted (see Figure 13).
CONCLUSIONS AND RECOMMENDATIONS
The newly proposed AASHTO design guide is currently under evaluation to assess the numerous modules introduced to address deficiencies in the previous guide related to traffic loading and the environment. Introduction of the mechanistic material characterization technique for AC and unbound materials made it possible to incorporate damage assessment capabilities in the proposed guide. This new feature will facilitate the implementation of performance based design and analysis practices in the near future. The importance of a well-executed material characterization process to the success of the proposed AASHTO guide motivated NRC researchers to review the manner in which these new approaches to characterization has been implemented in the proposed guide. The following are conclusions based on the results of this study:
The model reflected sensitivity to variation in asphalt concrete mix types with unique physical and mechanical properties. Performance predictions produced using the proposed AASHTO guide while implementing laboratory measured dynamic modulus values (input Level 1) are in agreement with performance patterns established in the current practice and reported in the literature.
However, AC dynamic modulus estimated using the predictive equation incorporated in the guide proved to be substantially different from measured values. The error in estimating the modulus (input Level 3) led to underestimates of accumulated damage, which will consequently result in undersigning the road structure.
Similarly, input Level 3 for unbound materials, mainly based on correlation between physical properties (including AASHTO classification) and the resilient modulus, produced unreliable values when compared with actual measurements made in the laboratory. Applications based on a modulus estimated using the guide proposed values to run the software resulted in substantially different performance predictions compared with those produced using measured modulus values.
In the absence of adequate facilities and enough expertise nationwide for conducting the tests necessary to measure the required mechanical properties, reliance will be on performing design exercises using input Levels 2 and 3. In order to produce more reliable pavement design solutions using these two levels, this paper proposes a scheme for building a database (Material Library) for potential Canadian users of the proposed guide. The Library may be populated with generic dynamic modulus values of local AC mixes and resilient moduli of commonly used unbound materials. Implementation of such generic properties in running the proposed design software will result in lower design errors compared with those produced using modulus estimated from correlations established for the proposed guide. These minor errors associated with the use of generic properties may be minimized in the future by introducing additional results to the database from tests performed on possible local alternatives that reflect variations in the real practice.
REFERENCES
[1] Sayegh, G. 1967. Viscoelastic properties of bituminous mixtures. Proceedings of the 2nd
International conference on structural design of asphalt pavement, pp. 743-755. Held at
[2] Sayegh, G. 1967. Viscoelastic properties of bituminous mixtures. Proceedings of the 2nd
International conference on structural design of asphalt pavement, pp. 743-755. Held at
Rackham Lecture Hall, University of Michigan, Ann Arbor, USA.
[3] Ontario Ministry of Transportation (MTO). 1990. Ontario Provincial Standard Specification, OPSS 1149 -1152, Ottawa, Ontario, Canada
[4] AASHTO 1993. Standard Specifications for SuperPave Volumetric Mix Design. Designation MP2-02.
[5] Fonseca, O.A. and Witczak, M.W. 1996. A Prediction Methodology for the Dynamic Modulus of In Place Aged Asphalt Mixture. Journal of the Association of Asphalt Paving
F
ΔΗ
H
Stress Amplitude σο
Stress Signal Strain Signal
Stress (MPa)
Stress Cycle Duration
Strain (MPa)
Strain Cycle Duration Phase Lag
Time
Stress Amplitude σο
Strain Amplitude εο
Strain Amplitude εο
Figure 1. Viscous response of asphalt concrete
0 5000 10000 15000 20000 25000 -20 -10 0 10 20 30 40 5 Temperature (C)
Dynamic modulus (MPa)
HMA 58-22 - Measured HMA 64-34 - Measured HMA 58-22 - Predicted HMA 64-34 - Predicted
0
0 5000 10000 15000 20000 -20 -10 0 10 20 30 40 5 Temperature (C) Dynamic modulus (MPa) 0 58-22 - Measured 52-34 - Measured 58-22 - Predicted 52-34 - Predicted
Figure 3. Measured and predicted modulus for two coarse Superpave mixes with different binders
0 10000 20000 30000
0 10000 20000 30000
Measured dynamic modulus (MPa)
Predicted dynamic modulsu (MPa)
Predictive equation 45 degree line 40% underprediction 100% over-prediction line 300% over prediction line
A
B
E
F
0 10 20 30 40 50 60 70 80 90 100 0.10 1.00 10.00 100.00 Sieve size (mm) % Passi ng Coarse Limit Fine Limit Fine mix Coarse mixFigure 5. HL4 gradation specifications
0 20 40 60 80 100 0.10 1.00 10.00 100.00 Sieve Size (mm) % Passi ng Coarse Limit Fine Limit Coarse mix Fine mix
0 4000 8000 12000 16000 0 4000 8000 12000 16000
Measured dynamic modulus (MPa)
Estimated dynamic modulus (MPa)
Library
Predictive equation
Figure 7. Library vs. predictive equation for HL4 mix
0 5000 10000 15000 20000 25000 0 5000 10000 15000 20000 25000 Measured dynamic modulus (MPa)
Estimated dynamic modulus (MPa)
Library
Predictive equation
0 5 10 15 20 25 30 35 40 45 0 24 48 72 96 120 144 168 192 216 240 264 Pavement age (month)
Rutting depth (mm)
Subgrade rutting Base rutting
AC rutting - E from test AC rutting - Predictive equation AC rutting - E from Libray
Figure 9. Impact of complex modulus determination method on performance
0 0.5 1 1.5 2 2.5 3 3.5 4 4.5 0 50 100 150 200 250
Pavement age (month)
Rutting depth (mm) Granular A- measured
Estimated Lower Limit Estimated Upper Limit
0 0.5 1 1.5 2 2.5 3 0 50 100 150 200 250
Pavement age (month)
Rutting depth (mm) Granular B- measured
Estimated Lower Limit Estimated Upper Limit
Figure 11. Base rutting for granular B
0 2 4 6 8 10 12 14 16 18 0 50 100 150 200 250
Pavement age (month)
Fatigue Cracking %
Granular A-measured Estimated Lower Limit Estimated Higher Limit
0 0.5 1 1.5 2 2.5 3 3.5 4 4.5 0 50 100 150 200 250
Pavement age (month)
Fatigue cracking %
Granular B- measured Estimated Lower Limit Estimated Higher Limit
Figure 13. Fatigue cracking for granular B
Table 1. Physical properties of mixes considered
HL4 52-34 HL8 52-34
Property
Job Formula Library Job Formula Library
Pb (%) 4.9 5 4.5 4.5 Gmm 2.503 2.524 2.547 2.566 Gmb 2.375 2.402 2.418 2.429 Gsb 2.720 2.742 2.721 2.740 VMA 17.0 16.8 15.1 15.3 Va 5.1 4.8 5.1 5.3 Vbeff 11.9 12.0 10.1 10.0
Table 2. Dynamic modulus of the HL4 mixes Dynamic Modulus 0.1 Hz 1 Hz 5 Hz 10 Hz 20 Hz Freq Temp Library Job Formula Library Job Formula Library Job Formula Library Job Formula Library Job Formula -10 6885 6783 9966 9568 12571 11979 13618 13312 13618 15138 0 2802 3079 5158 5342 7452 7384 8546 8459 10044 10013 20 290 579 647 1244 1174 2054 1553 2592 2075 3422 30 108 121 246 263 490 486 675 656 954 932 40 58 67 100 121 171 212 235 291 336 412
Table 3. Dynamic modulus of the HL8 mixes
Dynamic Modulus 0.1 Hz 1 Hz 5 Hz 10 Hz 20 Hz Freq Temp Library Job Formula Library Job Formula Library Job Formula Library Job Formula Library Job Formula -10 8555 11005 13305 15515 15998 18685.65 16638 19774.49 17510 21266.55 0 2770 3825 5264 6891 7515 9675 8611 11040 9965 12783 20 375 285 672 716 1137 1317 1475 1781 1925 2438 30 267 125 349 303 520 599 660 835 871 1174 40 258 60 276 120 337 235 378 322 435 459
Table 4. Properties of different granular materials (A-1-a)
Measured Property Guide Proposal Property
Granular A Granular B Lower Limit Upper Limit
Plasticity Index 0 0 0 6 Passing # 200 (%) 6 7 0 15 Passing # 4 (%) 19 21 15 30 D60 (mm) 11 7 2 25 MDD (kg/m3) 2366 2400 1972 2403 Specific Gravity 2.72 2.73 2 4 OMC (%) 5.0 5.4 2 40