An Analysis of Network Management Traffic and
Requirements In Wireless Networks
by
Pratip K. Banerji
Submitted to the Department of Electrical Engineering
and Computer Science in partial fulfillment of the
requirements for the degree of
Bachelor of Science in Electrical Engineering and
Computer Science and Master of Engineering in
Electrical Engineering and Computer Science
at the
:
Massachusetts Institute of Technology
-2 91997
May 23, 1997
© 1997 Pratip K. Banerji. All Rights Reserved.
.i,
The author hereby grants to M.I.T. permission to
reproduce and distribute publicly paper and electronic
copies of this thesis and to grant others the right to do so.
A uthor
... ...
...
...
Department of Electrical Engineering and Computer Science
y
May 23, 1997
Certified by
...
,...
....
.
... .
..
...
Steven G. Finn
Thesis Supervisor
A ccepted by
... .
..
...
..
...
Arthur C. Smith
Chairman, Department Committee on Graduate Theses
An Analysis of Network Traffic and Requirements in Wireless Networks
by
Pratip K. Banerji Submitted to the
Department of Electrical Engineering and Computer Science May 23, 1997
In partial fulfillment of the requirements for the degree of Bachelor of Science in Electrical Engineering and Computer Science and Master of Engineering in Electrical Engineering and Computer
Science
Abstract
Mobile wireless packet networks are becoming more common with the advances in the technology of digital communications, portable computers, and semiconductors. Network management in mobile wireless networks involves a variety of new issues not dealt with when managing immobile networks, and commonly used network management tools and protocols may not be ideal for a mobile environment. In this thesis, we show that the lim-ited bandwidth of mobile wireless networks along with the need to monitor topology changes while keeping network management bandwidth usage at less than 5% may
require alternative network management data gathering strategies on BBN Corporation's mobile wireless networks. Three alternatives to standard network management tools (SNMP) are discussed and analyzed for network bandwidth requirements, and a guide for choosing network management data gathering strategies on mobile wireless networks is proposed.
Thesis Supervisor: Dr. Steven G. Finn
Acknowledgments
First off, I'd like to thank everyone at my 6A company, BBN Corporation, and in particu-lar, Tony Michel and Mitch Tasman. With their guidance and support I have learned an immense amount, and without their support to the end, this thesis probably would not be completed. Also, many thanks to Dimitri Vlachos, Ted Haines, Franz Bronzo, and Bob Welsh for stimulating discussions as well as helping to make my time at BBN enjoyable. Many thanks to Dr. Steven Finn. His uncountable hours of advice, proofreading, correct-ing, and rewriting have molded this thesis into what it is.
I'd like to thank my friends for their positive encouragement, concern, advice, late night zephyrs, coffee runs, and attempts to pleasantly distract me from the stress of thesis work. Most importantly, I would like to thank my parents and my sister for their endless love, support, and encouragement all throughout my life. Without them, none of this would have been possible.
Table of Contents
Chapter 1: Background information ... 9
Section 1.1: Introduction ... ... 9
Section 1.2: Mobile wireless packet data networks ... ... 9
Section 1.3: The type of wireless networks considered in this research...14
Section 1.4: Network management issues...14
Section 1.5: Current network management tools ... ... 15
Section 1.6: Differences between mobile wireless networks and wireline networks ... 17
Section 1.7: Problem statement and network model ... 18
Section 1.8: Thesis goal ... ... 20
Chapter 2: Information model for wireless network management ... 25
Section 2.1: Introduction ... ... 25
Section 2.2: General network management goals ... ... 25
Section 2.3: Fault and performance management in mobile wireless networks...27
Chapter 3: N etw ork m odels ... ... 33
Section 3.1: Introduction ... ... 33
Section 3.2: Characteristics of mobile wireless networks... ... 33
Section 3.3: Network bandwidth usage...35
Section 3.4: Typical network scenarios ... 39
Section 3.5: General conclusions ... .. ... 49
Chapter 4: Alternative network management data gathering solutions ... 51
Section 4.1: Introduction ... 51
Section 4.2: Standard SNMP polling ... 51
Section 4.3: Adaptive SNMP polling rate...52
Section 4.4: Network management proxying...56
Section 4.6: Summary ... 68
Chapter 5: Guidelines for choosing a network management strategy ... 71
Section 5.1: Introduction ... 71
Section 5.2: Steps for choosing a network management strategy... 71
Section 5.3: Standard SNMP polling ... ... 73
Section 5.4: Adaptive SNMP polling... ... ... 74
Section 5.5: Proxy servers...76
Section 5.6: Using OSPF routing updates to do network management ... 78
Section 5.7: Summary ... 81
Chapter 6: Conclusion...83
Chapter 1
Background information
1.1 Introduction
Mobile wireless packet networks are becoming more common with the advances in the technology of digital communications, portable computers, and semiconductors. Network management in mobile wireless networks involves a variety of new issues not dealt with when managing immobile networks, and commonly used network management tools and protocols may not be ideal for a mobile environment. In this thesis, we show that the lim-ited bandwidth of mobile wireless networks along with the need to monitor topology changes while keeping network management bandwidth usage at less than 5% may require alternative network management data gathering strategies on BBN Corporation's mobile wireless networks. Three alternatives to standard network management tools (SNMP) are discussed and analyzed for network bandwidth requirements, and a guide for choosing network management data gathering strategies on mobile wireless networks is proposed.
1.2 Mobile wireless packet data networks
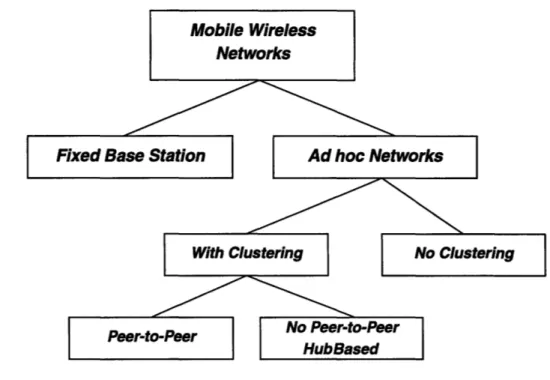
Many different types of wireless networks exist (i.e. cellular telephony networks, sat-ellite communications, etc.). This thesis focuses on mobile wireless packet data networks where packetized digital communication occurs between computers. Different strategies exist for routing of packets between computers in a mobile wireless networks. These
strat-egies range from using fixed based stations (similar to the routing used in cellular tele-phony), to ad hoc networks with peer-to-peer networking and clustering (Figure 1.1).
Figure 1.1: Types of wireless networks
The ensuing sections describe two major subsets of mobile wireless packet data net-works: fixed base stations and ad hoc networks.
1.2.1 Fixed Base Station
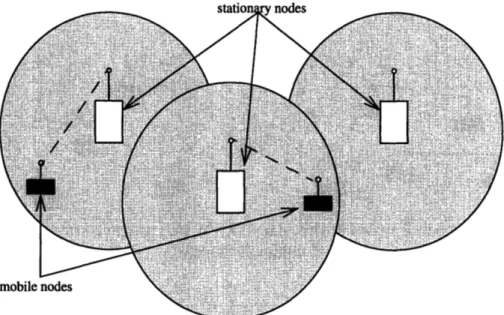
The Internet Engineering Task Force (IETF) Mobile IP Working Group has been working to develop a standard for mobile communications over wireless networks [1]. The standard is based on a Fixed Base Station model, and relies on a static network infrastruc-ture with mobile nodes connecting to stationary nodes (base stations). Each stationary node is responsible for radio communications with mobile nodes within its surrounding area. As a mobile node moves from cell to cell, the stationary node passes along the responsibility of handling the mobile node's packets. Ground based physical lines are used
similar to the networking used in the cellular phone world, except that it does not rely on guaranteed bandwidth once a connection is open. A distinguishing characteristic of the IETF model is that it requires an existing static network infrastructure to function (Figure 1.2).
Figure 1.2: IETF model of wireless networking with three stationary nodes and two
mobile nodes.
1.2.2 Ad Hoc Networks
At times, a fixed infrastructure may not be available for mobile nodes (or mobile hosts). For example, imagine a network formed in a battle area. Mobile hosts must form an ad hoc network, communicate among themselves as hosts, and through themselves to con-vey messages to other mobile hosts [1]. In essence, each mobile host is acting both as a switch (intermediate point), and a host (end point). The crucial difference between this and the IETF model of wireless networking is that there are no ground based physical lines between the intermediate points. In addition, the mobile hosts are mobile, so the entire topology of the network may be in constant transition.
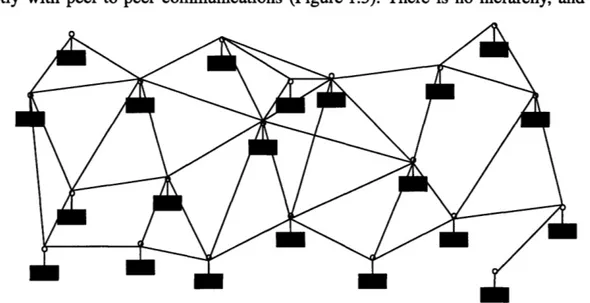
Without clustering. Ad hoc mobile networks can be further divided into two types: those
without clustering, and those with clustering. Without clustering, ad hoc networks operate strictly with peer-to-peer communications (Figure 1.3). There is no hierarchy, and each
Figure 1.3: A mobile network with ad hoc networking and no clustering; peer-to-peer
communications
mobile host acts as a router, forwarding packets as necessary. A mobile host needs to reconfigure its links when it either moves out of range of another mobile host that it has a communication link with or moves into the radio range of another mobile host. Such reconfigurations involve breaking a communication link and establishing a new communi-cation link, respectively.
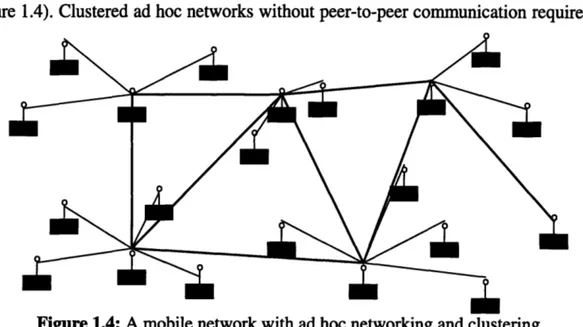
With clustering. Clustering provides a sort of subnetting (not at the IP level) by allowing
a subset of mobile hosts to form their own sub network. One of the mobile hosts in each cluster is elected to be the cluster head, with the responsibility of communicating with other cluster heads. With clustering, the network is divided into two layers. The top layer is intercluster communication, and is carried out by the cluster heads. The bottom layer is intracluster communication, and involves messages passed between members of a cluster
(Figure 1.4). Clustered ad hoc networks without peer-to-peer communication require that
Figure 1.4: A mobile network with ad hoc networking and clustering
communication between mobile hosts within a cluster pass through the cluster head, whereas in a clustered ad hoc network with peer-to-peer communication, mobile hosts in the same cluster may communicate directly with each other. Although cluster heads have a promoted status and the extra responsibility of handling packets leaving the cluster, they still also act as mobile hosts.
The different methods for affiliating mobile hosts with clusters are not addressed in this thesis, but one potential method has each cluster head constantly transmitting a bea-con. Each mobile host then constantly listens for beacons to ensure that the beacon with the strongest signal is the cluster head they are affiliated with. If it discovers a beacon from another cluster head is substantially stronger than the one from the cluster head it is affili-ated with, it switches to the new cluster. If it finds that there are no cluster heads within range, it raises its power and becomes a cluster head.
1.3 The type of wireless networks considered in this research
The research described in this thesis focuses on ad hoc networks with no clustering. In addition to handling inter host routing, each mobile host must act as a router for a wireline local area network (LAN) connected to it.
1.4 Network management issues
Generally speaking, the network management process can be divided into two major components - the data display and processing (DDP) program and the data gathering and dissemination component. The DDP program is a high level network management appli-cation. This application is the primary interface between the network operator and the data gathering component. It generally provides a display map of the network topology, along with status indicators for each node. In most cases, this interface also provides some sort of alarm service. If there is a change in the network that the operator should be aware of, the DDP program is responsible for setting off an alarm that brings the change to the oper-ator's attention. Also, the DDP program provides options and menus to help the operator with the network configuration process.
Underneath the DDP program lies the network management data gathering and dis-semination component. This component acts as the broker between the network and the network operator's DDP program. Abstractly, it is responsible for populating the DDP program with data regarding the network topology, network node status, link status, traffic statistics, and other information that is needed from the network. It is also responsible for disseminating network management information to the network when needed. In many networks, tools such as SNMP [2] are used to obtain and distribute this information.
This thesis will focus the data gathering engine. We will develop information require-ments for it, analyze its effectiveness and traffic load on the network, and propose alternate tools for use within the engine (Figure 1.5).
area of focus
Figure 1.5: Our area of focus in network management
1.5 Current network management tools
For the purposes of data gathering and dissemination, network management applications use several different lower level tools to gather data and set configuration parameters. These tools are generally run by the DDP program, and they report their results back to the DDP program. Two commonly used low level tools for data gathering are SNMP and ping.
1.5.1 SNMP
SNMP is a protocol which defines two types of components - a manager, and agents [2].The manager is located on a host computer -typically one computer per network -and is responsible for polling the agents to request information. Agents run on each node of the network, collecting various information and storing it in an internal database. Agents return requested information to the manager when polled. SNMP's popularity stems from its simple design, ease of use, straightforward implementation, and expandability. It has become the industry's de facto standard, and almost all new networking products are built to support it.
SNMP provides various other functions including the capability to set as well as get parameters. It also allows for the setting of traps, or requests for the agent to notify the manager on some event triggering.
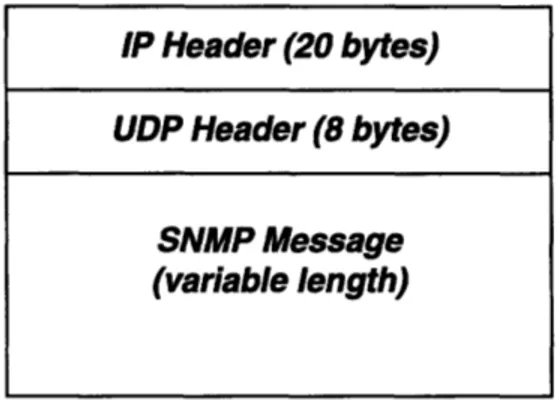
SNMP uses UDP for sending polls and receiving responses. SNMP packet format con-sists of a 20 byte IP header, an 8 byte UDP header, and a variable length ASN. 1 encoded SNMP message [10].
Figure 1.6: SNMP packet format
1.5.2 Ping
Another commonly used, but less revealing tool is the ping protocol. A ping is an ICMP echo request, which elicits an echo response from a host if the host is up [3]. A
host's response to a ping poll indicates whether its network interface and operating system is working or not. Ping's small packet size make it a good tool for quickly assessing whether a host or router is up or down, but it provides no additional information.
1.5.3 Other network management data gathering tools
Other network management data gathering tools such as CMIP exist [4], but SNMP and ping are the most widely used industry tools. Our work primarily focuses on the use of the industry standard -SNMP.
IP Header (20 bytes) UDP Header (8 bytes)
SNMP Message (variable length)
1.6 Differences between mobile wireless networks and wireline networks
While SNMP and ping are today's most common network management data collection tools in wireline networks, it is not clear that these tools are appropriate in many mobile wireless networks because of important differences between the two types of networks. Two major differences between wireline and mobile wireless networks are that mobile wireless networks usually have less bandwidth between network nodes, and that the net-work topology of wireless mobile netnet-works is changing frequently (as opposed to thealmost constant topology of wireline networks).
1.6.1 Bandwidth limitations
Links between hosts in a mobile wireless network typically provide significantly less bandwidth than those in a wireline networks. Typical wireline network link bandwidths are between 1 Mbps and 100 Mbps, whereas typical mobile wireless links are between 1 kbps and 100 kbps [5]. With wireless bandwidths that are 3 to 5 orders of magnitude lower than that of a wireline network, network managers need to be more careful with traffic introduced on wireless networks than they are on wireline networks. Often, increases in power can offer higher link bandwidths on wireless networks, but mobility requirements often restrict the size and power of the battery source on mobile hosts.
Using SNMP and ping to poll for network management data may takes up consider-able network bandwidth [7]. Although the individual packet sizes for SNMP messages are not by themselves overwhelmingly large, polling's constant retransmission of requests and responses consumes large amounts of bandwidth. An analysis of mobile wireless network bandwidth requirements for network management traffic will be developed in the thesis.
Differences between wireline and wireless link capacities may necessitate changes in or the replacement of the standard polling mechanisms of SNMP and pinging. It is not
clear when these changes will be required (what types of wireless network topologies and which bandwidth limitations), nor is it clear whether these polling tools can be modified to accommodate these changes. We investigate and quantify these limitations for different network topologies, and propose alternatives to SNMP and ping polling.
1.6.2 Dynamically changing network topologies
Typical network management tools aren't built to deal with the dynamic changing topology of ad hoc wireless networks. Links on conventional networks may occasionally go up and down, and the amount of traffic flowing on a particular link may change, but changes in topology are uncommon. In addition, nodes are usually stationary in location and connectivity. Even in a cellular network with fixed base stations, there is movement of the phone user within a cell and between cells, but the position of the cell's base station remains fixed.
For the network management tool to follow topology changes as well as node status changes of mobile hosts, it must poll at least once each time the topology changes. If topology has the potential to change rapidly, then the network management tool must poll frequently to discern the changes. Picking a constant polling rate may be inefficient when the rate at which topology is changing is not constant. We will also explore adaptive poll-ing rates in this thesis.
1.7 Problem statement and network model
This work was originally started at BBN Corporation as a project to optimize the use of network bandwidth by network management traffic in BBN multihop packet radios. BBN has been researching multihop packet radios since the late 1970s [6], and in recent years has been applying variations of this technology to numerous research, commercial, and military networks. The variation of the multihop packet radio that we are studying is a
mobile wireless network that uses ad hoc peer to peer networking without clustering.
1.7.1 Network management on the BBN network
We are interested in investigating whether standard SNMP polling mechanisms can be used to monitor BBN's mobile wireless network. Specifically, bandwidth over the wireless links between the mobile hosts is limited, and SNMP's polling intensive nature can intro-duce large amounts of network management traffic on these links [7]. BBN requires that network management traffic not exceed 5% of the overall network bandwidth. In other words, 95% of each network link's bandwidth should be available for user and other sys-tem traffic. Standard SNMP polling may not meet this restriction as the number of mobile hosts in the network increases.
1.7.2 BBN network model and information requirements
Two sets of parameters are used throughout this thesis in analyzing network
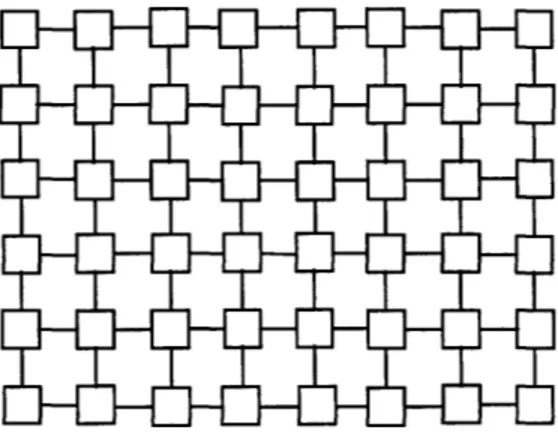
manage-ment traffic: network parameters and information model parameters. After accounting for link setup, maintenance, and tear down overhead, each mobile host has approximately 400 kbps is available for data transmission. In our analysis, we will assume a grid topology,
with each mobile host connected to a maximum of four other mobile hosts (Figure 1.7). With half duplex links, this allows for a 50 kbps link rate over each link in each direction.
Figure 1.7: Typical BBN mobile wireless network topology
BBN also has certain network management information requirements - high priority fault detection within 30 seconds, low priority fault detection within 5 minutes, topology change detection within 60 seconds, and performance management updates at 1800 sec-ond intervals (these terms are explained in detail in Chapter 2). The specific quantity of data (number of SNMP polls and responses, and the size of their packets) required by BBN to stay within these requirements will be discussed in Chapter 2.
1.8 Thesis goal
We will explore the suitability of SNMP for collection of network management informa-tion in BBN's mobile wireless network, consider possible alternatives, and examine their efficiency.
1.8.1 Motivation
With limited bandwidth provisions over BBN's mobile wireless network links, and an increasing number of mobile hosts to monitor, it is not clear that current network manage-ment technologies and tools are adequate to maintain sufficient and timely network status
information while maintaining a bound on the percentage of network management traffic on the network.
Under conditions with a small number of mobile hosts, a long polling interval, and high bandwidth links, SNMP tools may provide adequate and timely network manage-ment data for BBN's mobile wireless network. With a larger number of mobile hosts, the number of poll requests that must be made to adequately monitor the network increases. With that, the amount of network management traffic generated by the network manage-ment tool increases, and a large amount of traffic must be transmitted over the links of the mobile host adjacent to the network management tool. Similarly, networks with lower link bandwidth capacity, or network management requirements for more timely responses to network status changes (requiring a higher polling rate) lead to a higher percentage of net-work management traffic on a netnet-work.
1.8.2 Alternatives to standard network management
Several alternatives exist to the current network management SNMP based tools. In this work we will focus on three alternatives that reduce network management data gather-ing bandwidth requirements. Each of these alternatives uses a different mechanism for lowering the amount of bandwidth generated by network management traffic, but with each of these solutions comes certain tradeoffs. The tradeoffs include implementation man hours, modularity of network management system, ease of transition of network manage-ment method to new technology networks (new routing algorithms, different media, etc.), timeliness of response to active polls, and the time taken for the network management tool to realize a status change in the network.
The first, and perhaps most simple to implement, strategy is an adaptive SNMP polling algorithm. Only the network management station's (NMS) client program needs to be
modified to perform this task, but with its simplicity comes a reliance on an upper bound on network mobility.
The second strategy is to have mobile hosts proxying network management responses for groups of mobile hosts. Major software modifications of the network management pro-gram on the mobile hosts and the NMS are required for this strategy. In addition, it may take longer to get information because information must be staged first in the proxy server mobile host.
The third strategy is to use a network management method which reads Open Shortest Path First (OSPF) routing updates to provide network status information. This method can replace a significant amount of network management traffic but cannot replace all the information required by the data display and processing program on the NMS. In addition,
this requires writing additional software on the network management tool. Each of these methods is discussed in detail in Chapter 4.
1.8.3 Thesis goal and organization
The broad goal of this thesis is to provide a guide for network architects and planners of network management systems to use in determining which type of network manage-ment data collection techniques are suitable for mobile wireless networks. The assump-tions, models, and final presentation of results is based on BBN's specific mobile wireless network, but the parametrized model should be of use to different wireless network situa-tions.
The second chapter of this thesis is devoted to developing the network management information model requirements for mobile wireless networks. It begins by defining gen-eral network management goals, and then moves on to describing how these goals com-pare to wireline network management goals. In the process, it also defines different types
of faults, configuration management issues, and how much performance management needs to be done. It concludes with a traffic model for BBN's mobile wireless network's network management traffic requirements.
The third chapter identifies two representative mobile wireless network topologies and develops analytical techniques for calculating the link bandwidth required to support the network management system's data collection traffic as defined by the information model. These techniques calculate link bandwidth requirements as a function of the topology, message sizes, number of nodes, and polling rates.
In the fourth chapter we describe the three proposed alternative strategies to standard SNMP for network management data collection in a wireless network and analyze their bandwidth requirements. The fifth chapter draws conclusions and proposes some guide-lines for which strategy is appropriate for a mobile wireless network as a function of BBN's available link rate, and network management information requirements. The sixth chapter provides a conclusion.
Chapter 2
Information model for wireless network management
2.1 Introduction
In this chapter we introduce general network management goals for wireless networks, show how mobile wireless networks differ from wireline networks, and develop a parame-trized information model for estimating network management data gathering bandwidth requirements.
2.2 General network management goals
Network management's twin goals are to reduce the number of network problems, and minimize inconvenience and contain damage when problems occur. To achieve these goals the Internet Standards Organization (ISO) has defined five network management func-tional areas. These five areas are fault management, configuration management, perfor-mance management, security management, and accounting management [8].
1. Fault management
The facilities that enable the detection, isolation, and correction of abnormal operation of the Open Systems Interconnection environment .
2. Performance management
The facilities needed to evaluate the behavior of managed devices and the effectiveness of communications activities.
3. Configuration management
1. The Open Systems Interconnection reference model describes network protocols, and was devised by the ISO.
The facilities that exercise control over, identify, collect data from, and provide data to managed devices for the purpose of assisting in providing for continuous operation of interconnection services.
4. Security management
Addresses those aspects of OSI security essential to operate OSI network management correctly and to protect managed devices. There are two aspects of security management. The first is the management of the security of a network, and the latter is the security of the management aspects of the network. To contrast, one involves monitoring whether a given network is secure, while the latter is composed of ensuring the security of the net-work management process.
5. Accounting management
The facilities that enable charges to be established and costs to be identified for the use of managed devices.
In this thesis we focus on the first two areas of network management: fault manage-ment and performance managemanage-ment. We do this because these two dominate the band-width and timeliness issues of network management.
Normally, transmission of data through radio is considered insecure, but in our case, we will assume that the wireless hosts use secure transmissions at the physical layer (e.g. cryptography). In other words, anything that is transmitted over the air is assumed trans-mitted securely, so the network management layer does not need to worry about that aspect of the network.
Generally speaking, accounting is difficult in ad hoc wireless networks. Everyone's radio acts as a common resource for other radios to route packets through, and it is diffi-cult to track actual packet flow per user. For the purposes of this thesis, we will disregard billing and accounting.
Although configuration management is a vital part of the network management model, there are a variety of reasons for not including it within our analysis of bandwidth usage. Configuration changes occur at random intervals on random hosts within the network. Configuration changes do not occur often, and most mobile host configuration is done before network deployment. Hence, the actual bandwidth consumed by configuration changes is both unpredictable and small compared to the total network management
traf-fic.
2.3 Fault and performance management in mobile wireless networks
2.3.1 Fault management
With respect to network management, our first and foremost concern is to be aware of faults in the network, and correct them, if possible, when they occur. Generally speaking, a fault refers to a problem that can cause a network to not function as planned. Specifically, the ISO defines fault management to consist of the facilities that enable the detection, iso-lation, and correction of abnormal operation of the ISO environment [10].
To facilitate our information model requirements, we will break network faults into two categories: high priority network faults, and low priority network faults. The first is a fault that results in a mobile host being completely inoperational or unreachable. In this case the mobile host will not respond to any network queries, including SNMP or ping requests. Furthermore, it will be unable to perform in its role of forwarding packets. Typi-cal causes of this in a wireless network can be a mobile host equipment failure or loss of connectivity to the rest of the network due to its drifting out of radio range.
The second type of fault, a low priority fault, is one that doesn't completely incapaci-tate the mobile host, but leaves a small portion of the network dysfunctional or
unreach-able. An example of this would be a mobile host which is able to communicate with other mobile hosts, but for some reason, cannot communicate with its local users.
High priority network fault. What makes a high priority network fault high priority?
BBN's mobile hosts have multiple network interfaces, with the primary interface being the wireless interface, and the secondary interfaces being wireline connections to local users. The wireless interfaces construct the primary backbones for end-to-end communication between the devices on the wireline network. The physically wireline interfaces provide connectivity for the users actually involved in end-to-end communication. Any network fault that has the potential to affect more than the local users connected to a mobile host is considered a high priority fault.
The consequent network-wide problems that high priority network faults can cause requires that we poll for high priority network faults frequently. We define the high prior-ity fault polling interval (in seconds between polls) as PIhpf, and the length of a high prior-ity poll and its response as LPhpf and LRhpf, respectively.
Low priority network fault. A low priority network fault is one that does not affect the
overall network performance, but rather, a small subset of the network. More concisely, faults involving other local area network interfaces hanging off each mobile host qualify as low priority faults. For example, one of the local interfaces could fail, or one of the local terminals could fail.
Due to the isolated effects of each of these outages, low priority faults need not be monitored by the network management tool at the same frequency as that of high priority network faults. We define the low priority polling interval (in seconds between polls) as PIlpf, and the length of a low priority poll request and its responses as LPlpf and LRlp f, respectively.
2.3.2 Performance management
Monitoring network performance is a critical aspect of network management. Current network performance in conjunction with performance history can be used to predict fail-ures before they occur. Unlike fault management, which is reactive process of learning when network faults occur, and then correcting them, performance management needs to be a proactive process. The performance of the network needs to be frequently monitored to understand traffic usage patterns and where network bottlenecks exist, etc. Network performance monitoring is a heavy user of network bandwidth.
Performance management can detect problems such as congestion (too much traffic flowing through one mobile host, resulting in large packet queues and delays). Congestion is prone to occur in networks with bottlenecks and coupled with moderate to high traffic flow, it can lead to high or low priority faults in a network.
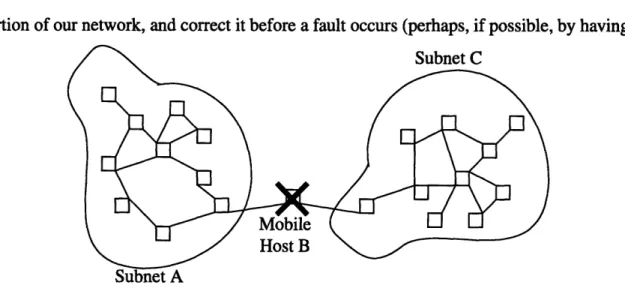
An example of a network bottleneck can be seen in Figure 2.1. By watching topology changes we can actually predict when a mobile host fault may lead to the isolation of a portion of our network, and correct it before a fault occurs (perhaps, if possible, by having
Figure 2.1: A network becomes disjoint due to a bottleneck condition
another mobile host move in between the two almost-disjoint networks the provide another redundant path).
Because mobile wireless mobile networks have topologies that are more dynamic than wireline networks, topology detection needs to occur more frequently than other perfor-mance detection tasks. Therefore, we feel it is rational to separate perforperfor-mance manage-ment into two parts -topology monitoring, and the rest of performance management. The former should be monitored frequently, and the latter need not be followed as closely. We will refer to the polling interval of topology monitoring (in seconds) as PItm, and the length of the poll and its response (in bytes) as LPtm, and LRtm, respectively.
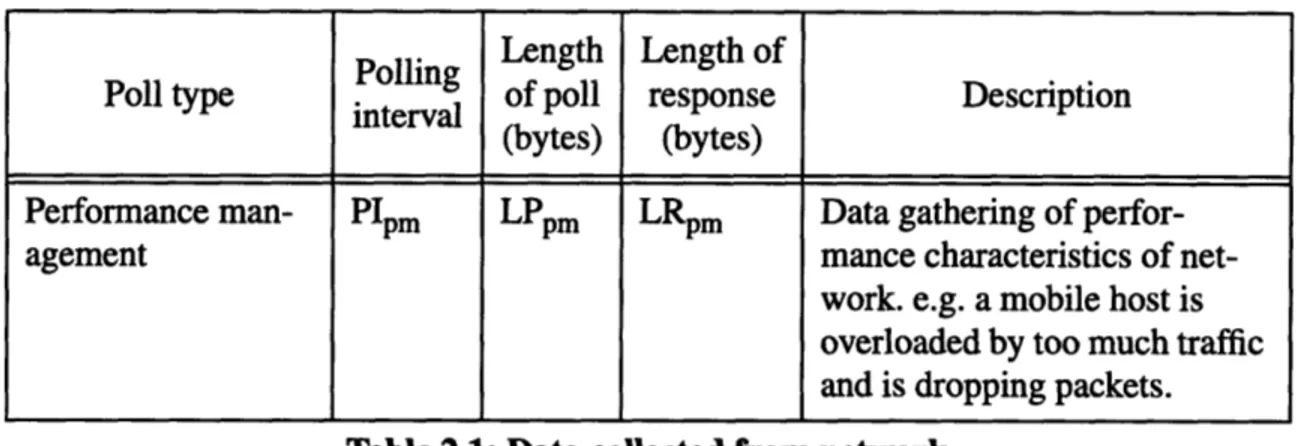
We feel that the rest of performance management is similar in timeliness requirements to low priority fault detection timeliness requirements. Variables on a mobile host such has packets in/packets out, CPU load, etc., should be monitored as frequently as low priority faults. We use PIpm to denote the polling period for performance management (exclusive of topology management), and LPpm and LRpm to denote the length of a performance management poll and its response.
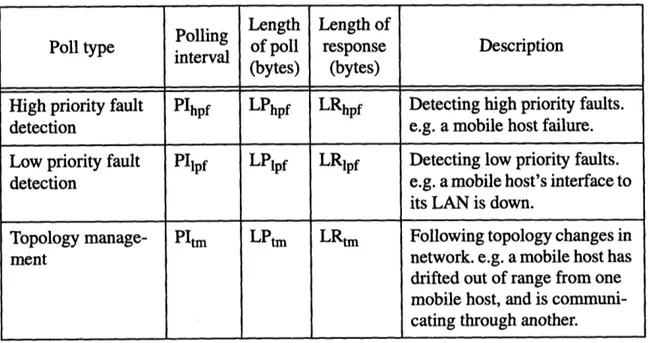
In Table 2.1 we provide a summary of the different poll types, their respective polling intervals and poll/request lengths, and a brief description of their functions.
Polling Length Length of
Poll type interval of poll response Description (bytes) (bytes)
High priority fault PIhpf LPhpf LRhpf Detecting high priority faults.
detection e.g. a mobile host failure.
Low priority fault PIlpf LPIpf LRIpf Detecting low priority faults.
detection e.g. a mobile host's interface to
its LAN is down.
Topology manage- PItm LPtm LRtm Following topology changes in
ment network. e.g. a mobile host has
drifted out of range from one mobile host, and is communi-cating through another.
Polling Length Length of
Poll type interval of poll response Description (bytes) (bytes)
Performance man- PIpm LPpm LRpm Data gathering of
perfor-agement mance characteristics of
net-work. e.g. a mobile host is overloaded by too much traffic and is dropping packets.
Chapter 3
Network models
3.1 Introduction
In this section, the characteristics of BBN's mobile wireless networks are identified. Using that as a base, the bandwidth consumed by the network management traffic is analyzed for polling mobile hosts for two different wireless network topologies, different bandwidth limitations, and topology change notification requirements. We will determine the link bandwidth at which the network limit network management traffic is less than 5% of over-all network traffic capacity over each link.
3.2 Characteristics of mobile wireless networks
3.2.1 Communication link performance
Performance characteristics of a network link are often expressed in terms of link rate and propagation delay. Link rate is the rate (in bits per second) at which data can be sent over a link at a certain bit error rate. The propagation delay refers to the time elapsed between a bit of data entering the network link at the source mobile host and it leaving the network link at the destination mobile host.
The SNMP packets we are sending are more than 32 bytes (UDP/IP packets are a min-imum of 32 bytes for headers alone) [11], or 256 bits. Assuming we have a 100 kbps link, it would take a minimum of 2.56 milliseconds to transmit this packet on to the link. Mobile hosts are typically within a few miles of each other (1 to 5 miles, or 1.5 to 8 km), and rate of propagation is the speed of light (3x10⁸ m/s). Hence, the propagation time for two mobile hosts that are 8 km apart is 0.025 milliseconds. The ratio of the propagation time to the transmission time is approximately 1x10⁻² (Equation 3.1).
propagation time 0.025 10-2 (3.1) transmission time 2.56
Therefore, for the purposes of this analysis, we consider propagation delays to be insignificant compared to transmission times (linearly related to link rate). We disregard propagation delays, and focus solely on link rate.
As stated in Chapter 1, BBN's mobile wireless network has link rates of 50 kbps per second in each direction. For this analysis, we will leave the link rate as a variable param-eter so as to allow this analysis to be reapplied if BBN improves their network's link rate.
3.2.2 Mobility (topology changes)
One crucial factor differentiating mobile wireless networks from wireline networks is that the topology may be constantly changing. When referring to topology change, we are not explicitly discussing a mobile host changing its geographical location by moving around on the field, but rather, a movement that causes a change in the node to node topol-ogy. For example, a mobile host can establish a link with another mobile host who it moves closer to, while losing a link with a mobile host that it was once linked to.
For high mobility networks, the topology polling interval, PItm, needs to be short. For networks that are not as dynamic, a larger polling interval can be used.
3.2.3 Network structure
In analyzing BBN's dynamic mobile wireless networks, there are too many possible network topologies for one to consider all. We chose to analyze variants of 2 network structures that we believe offer a reasonable representation of typical mobile wireless net-work topologies. These netnet-work structures have a maximum of four links connecting any mobile host to another mobile host. In reality, the number of links between mobile hosts is dictated by the location of each mobile host, the number of radio frequencies or interfaces
available for communication, and by the range of its radio signal. A consideration for future work is a more rigorous analysis of statistics gathered by observing mobile wireless networks in use.
The two different topologies that will be analyzed: 1. Uniform distribution (jF x AF grid)
2. Elongated distribution ( xaiF grid, with a>1)
These two topologies will be considered in more detailed in section Section 3.4.
Network characteristics Description
Communication link performance Link rate -the rate at which data can be sent over a link.
Mobility A movement that causes a change in the node to node topology of the network
Network structure The node to node topology of the network
Table 3.1: Summary of network characteristics and descriptions
3.3
Network bandwidth usage
To understand network management bandwidth requirements, we must first determine the amount of data that must flow across each network link over a period of time.
High priority network fault detection, as described in Chapter 2, must occur fre-quently. BBN requires high priority fault detection within 30 seconds, so we choose the high priority polling interval (PIhpf) as 30 seconds. SNMP uses UDP to send messages with ASN.1 encoding (no fixed fields) [11]. The size of the SNMP poll requests are approximately 73 bytes (20 bytes for the IP header, 8 bytes for the UDP headers, and a varying size for the SNMP message, with the typical size being 45 bytes). Each mobile host needs to be polled once every 30 seconds, so within each polling period there is one
high priority fault poll of 73 bytes (LPhpf). SNMP responses have the same header infor-mation, but the actual data in the SNMP message can vary considerably. We assume the size of a simple SNMP response for high priority fault information is also 73 bytes (LPRhpf).
Low priority network faults need to be monitored less frequently. To meet BBN's requirement of detecting low priority faults within 5 minutes, we set the low priority poll-ing interval, PIlpf, at 5 minutes (300 seconds) [12]. Each of BBN's mobile hosts has four external interfaces that need to be monitored for low priority network faults. We need to send one SNMP poll for each interface. The total length of the polls per mobile host is approximately 292 bytes (73 bytes -4 interfaces). The size of the SNMP responses to these polls is also approximately 292 bytes.
Because wireline networks generally have static network topologies, no standard SNMP variable exists for storing topology information. One possible method for deducing network topology is to use SNMP to retrieve the routing tables of mobile host. This method may not always return complete results, and in the case of mobile wireless ad hoc networks, each mobile host needs to have a route to every other mobile host. Hence, the size of the routing tables returned is large (increasing linearly with N, the number of mobile hosts). BBN feels a better way to monitor topology on wireless networks is to have the mobile host store an SNMP table variable in the management information base (MIB) with the list of mobile hosts it is connected to. To request the entries in this table, the SNMP polling client first requests the first entry in the mobile host's mobile host connec-tion status table, followed by the second, and continues until all the connecconnec-tion informa-tion has been collected. The size of the polls and responses are constant, and the number of polls and responses is linearly related to the number of connections to mobile hosts. The size of an SNMP poll is approximately 73 bytes, and one response is approximately
77 bytes. For our model, we are assuming that on the average, each mobile host is con-nected to four other mobile hosts, so there are a total of four polls and four responses. Hence, a total of 292 bytes are sent in polls, and 308 bytes in responses. BBN requires topology detection within 60 seconds, so the polling interval for topology management (PItm) is 60 seconds [12].
Numerous performance monitoring MIB variables exist, and it is up to the network architect and network management planner to decide which variables need to be moni-tored. BBN requirements state that the network management station needs to monitor approximately 10 MIB variables per mobile host to monitor performance. Each poll, once again, requires 73 bytes. For the variables required from BBN's mobile hosts, each response requires an average of 80 bytes. Generally, performance management polling intervals are high, and in practice, are sometimes not even gathered at periodic intervals. BBN requires performance management updates at 30 minute intervals, so we choose a polling interval for performance management (PIpm) of 30 minutes (1800 seconds).
Table 3.2: Polling interval and length of poll of different poll types per mobile host
The links on BBN's mobile wireless network provide for duplexed communications, hence half of the total bandwidth is used for traffic in each direction. BBN's OSPF routing
Poll interval Total length of Total length of
Poll type poll responses
(PI) polls (LP) (LR)
High priority fault 30 seconds 73 bytes 73 bytes (hpf)
Low priority fault (lpf) 300 seconds 292 bytes 292 bytes
Topology monitoring 60 seconds 292 bytes 308 bytes
(tm)
Performance 1800 seconds 730 bytes 800 bytes management (pm)
algorithm always provides the shortest path between the NMS and polled node, so given any link we know that network management polling traffic is guaranteed to flow in only one direction, and the responses are guaranteed to flow in the other. Hence, because the lengths of the responses are larger than the polls, to maintain the 5% cap on network man-agement traffic we only need to analyze the traffic generated by the responses.
The total NMS bandwidth required by the responses for one mobile host is:
R ( bits LRx
BWNMP=bytes 8 s L bps (3.2)
hpf,lpf,tm,pm
Every packet takes the shortest path from the NMS to the mobile host it is polling, so we can determine the expected traffic on any link over a given period of time. To
deter-mine the bandwidth used by the response traffic in any polling cycle:
1. For each mobile host we are polling, we need to:
* Determine all possible shortest paths between the NMS and the mobile host. * For each possible link traversed, determine the probability of traversing that link
while polling this mobile host (the number of paths crossing this link divided by the number of total paths between the NMS and the mobile host); multiply that probabil-ity by the sum of the size of the poll response.
* Store the value as the bandwidth used on that link for one poll to that mobile host. 2. Do this for all routers that we are polling in one polling cycle.
3. For each link, sum together the bandwidth values stored from each poll.
We would then have the expected total bandwidth used for SNMP responses on each link per polling cycle.
3.4 Typical network scenarios
Here we will discuss different network scenarios typical of our networks, and provide a general mathematical analysis of them.
3.4.1 A uniform network distribution
The first topology is a uniform network distribution. Each mobile host has four links connecting to its neighbor mobile hosts, except for edge mobile hosts which have three links each, and corner mobile hosts which have two links each (Figure 3.1).
F mobile hosts
s o Mobile host A
, mobile hosts * 6O@ 0*O
· ,S·S
N mobile host distribution
As stated in the Chapter 2, in wireless network management we are primarily con-cerned with network management traffic for fault management and performance manage-ment.
The analysis of periodic polling protocols is fairly well established [13]. With one SNMP network management entity polling multiple devices (mobile hosts) every T
sec-0 sec-0 sec-0
0
0 0
LV.&W".WJLO AAWLY& A A
onds, with A being the minimum time required to complete one poll, the number of mobile hosts that can be managed with serial polling is:
T
N5 (3.3)
The components of A include:
1. The time it takes to package the message on the network management tool (processing time).
2. The time it takes to output the message on the radio link (transmission time).
3. The network latency from the network management tool to the polled client (propaga-tion time).
4. The time taken for the polled client to interpret and process the SNMP request (pro-cessing time).
5. The time it takes for the polled client to package the response (processing time). 6. The time it takes to output the message on the radio link (transmission time).
7. The network latency from the polled client to the network management tool (propaga-tion time).
8. The time taken for the network management tool to process the request (processing time).
Looking at the transmission time alone, we find that to poll a uniformly distributed network of N nodes, we need to send an SNMP poll every T seconds to each of the N nodes. Each SNMP poll and its response is at least 60 bytes. With 50 kbps links, the trans-mission time for each node to forward an SNMP poll packet is:
bits 60 bytes -8b
Transmission time per node for SNMP polls = byte= 9.6 milliseconds (3.4)
50, 000 bps
In a uniformly distributed network of N nodes, an average of INf -1 links need to be traversed for each poll, and the same number of links need to be traversed when the
response returns. Hence, on the average, the minimum transmission delay per poll and response are:
Delay per polltransission= (/ - 1) - 2 - 9.6 milliseconds (3.5)
In a relatively small network with 200 nodes, the average delay resulting from trans-mission times is:
Time to poll 200 node network = 200 Delay per pollransmission = 50.4 seconds (3.6)
So, if we assume that we have no queueing, propagation, or processing delays, it takes 50.4 seconds to poll 200 nodes in one polling cycle for high priority faults alone. The packet sizes of the responses to low priority fault polls, topology management polls, and performance management polls are larger, and produce larger delays. If the polling inter-val is not longer than the time it takes to cycle through polling all the nodes, the network's nodes cannot be monitored using the technique described above. The key problem in this polling mechanism is the fact that the network management tool has one client process that executes a poll and blocks until a reply is returned (i.e. serial polling).
To overcome this problem, network management tools typically start multiple threads which concurrently poll routers on the network (i.e. parallel polling).
Analysis strategy. Instead of evaluating all the paths between the source host (the NMS) and the destination host (the mobile host being polled), and then, for each link, counting the number of paths that crossed it, the number of paths crossing a particular link can be represented as the product of the number of paths between it and the source, and the num-ber of paths between it and the destination.
For example, assume we are trying to find the expected network management traffic over one link from one poll of a node on a x
A-N
network such as the one shown inFigure 3.1. With the bottom left node with the NMS labeled (0,0) and the top right node labeled (FNi -1,4Fi -1), assume we are polling node (m,n) (with m < rN - 1 and n < 4- 1 ),
and are looking for the traffic over the link between (p,q) and (p,q+1) (with p 5 m and
q + 1 < n). The number of paths between (0,0) and (p,q) can be given by the combinatoric function:
+ q _ (p + q)! - (+ q)!
P )_ (p+q-p)!p! p!q!
This can be derived through the following process. First of all, assume we are trying to find the number of shortest lattice path from (0,0) to (r,s), where r and s are nonnegative integers. Each of these paths can be decomposed into horizontal and vertical moves of the respective forms:
(x,y) -> (x+1,y) and (x,y) -> (x,y+1)
Any given shortest path between (0,0) and (r,s) will clearly have r+s moves, and any sequence of these moves must be some combination of r horizontal and s vertical moves. Therefore, counting the paths between (0,0) and (r,s) is equivalent to counting the number of sequences of moves.
So, essentially, the problem is one of how many sequences of r+s symbols are there, where r or them are "H" (horizontal) and s of them are "V" (vertical). To solve this prob-lem, envision r+s empty slots, and count the number of ways you can fill r of them with "H"s, with the remainder filled with "V"s. The number of size r subsets (the slots with "H"s) of a set r+s elements (the total number of slots), is equal to "(r+s) choose r", or the binomial expansion of (r+s,r), or:
(r+s) (r + s)! _ (r + s)! (3.8)
This can easily be seen if we look at a simple 3x3 network (Figure 3.2).
Figure 3.2: A simple 3x3 grid network
The shortest path from 1 to 9 is 4 hops, and by simply counting the paths, it is clear that there are 6 paths between the two. Using Equation 3.8, and setting r and s both equal to 2, we get:
+2 (2 + 2)! 4.3 -2 - 1 246 (3.9)
S6 (3.9)
2 2!2! 2.12- 1 4
Similarly, through counting, we can see that a simple 2x3 network should have 3 paths. Setting r equal to 1, and s equal to 2, Equation 3.8 yields:
(1+2 (1 +2)! 3!
2 = 3 (3.10)
2
2!1!
2!
Now that we've established the number of paths between a source node and the node under the link, we need to determine the number of paths from the node on the other side of the link to the destination node. With Equation 3.8, we find that the number of paths between the other end of the link, (p, q+1), to the node we are polling, (m,n) is given by:
(m-p) + (n - (q+ 1))= (m + n - p-q-1)!(3.11)
m-p (n-q- 1)!(m-p)!
Multiplying Equation 3.7 and Equation 3.11 together, we get the total number of paths between the network management tool and the polled router that cross that link:
(+qP +n-p-q-1 (3.12)
(3.12)
This, divided by the total number of paths between the NMT and the polled host will give us the probability that a path crosses the link (p, q) -4 (p, q + 1):
(p
+q + n-p - q - 1)
m nP (3.13)
(m+
n)Now, we can sum the bandwidth used on this link in polling all the mobile hosts. Assume that we have a (h+l)x(k+1) network, with (h,k) being the top right mobile host, and (0,0) being the bottom left mobile host. We know that a packet will always take the shortest path between two hosts, so we can neglect mobile hosts that are closer to the
NMS. Hence, the expected number of network management responses over the link above
(p,q) in one polling cycle, with V denoting that it is a vertical link, is:
k h (+p+qym+n-p-q-l1)
p(p, q)= (3.14)
n= (q+ 1)m =p m
The expected high fault detection network management traffic from SNMP responses is:
High Priority Fault Detection Traffic(, q)=
(ba
te.
L) f bps (3.15)Similarly, the expected traffic generated on any particular link for the topology change detections. Topology change polling must occur every 60 seconds (PItm), and can be rep-resented by:
v
=
bits
.
PV
LR,
Topology Change Detection Ttraffic q)= = 8byte v PItm ps (3.16)
The low priority fault detection must occur every 300 seconds (PIlpf):
Low Priority Fault Detection Traffic, )= ( byte P q) PLpf ) ps (3.17)
Finally, performance management polls must occur every 300 seconds (PIpm):
Performance Management Traffic( )= byte . ') ) (3.18)
Summing these together, we derive the total network management traffic generated by SNMP responses over vertical links:
Net Mgt. SNMP Response Traffic(,,q)= b • , q, BWNM ps (3.19)
Where BWRsNMP the expected bandwidth per second of the SNMP responses, is
defined as:
R ( bits LRhpfLRt LRjpf LRpm",
BWSNMP bi + +- -+ - L - )ps (3.20)
N byte Plhpf PI T lpf P-Ipm ))b
Equation 3.19 can be used to deduce the bandwidth over each link above the point (i,j), but does not tell us what the bandwidth on the horizontal links are. For horizontal links, the expected number of responses travelling over the link to the right of (i,j) in one polling cycle is:
H (p+q m+n-p-q-1)
P(p,q)= P m (3.21)
The total network management traffic generated by SNMP responses over any given horizontal link to the right of (p,q) is:
Net Mgt. SNMP Response Trafficp q)= (p,q)BWsNMP)bps H (3.22)
For a FN x FN uniform distribution network, p, q) and p,,,q are:
•N-1 -(p+q Xm+n-p-q-1 P q)=
xp,
-P (3.23) n = (q +1) m = p (m+n -1 (Pp+qXm+n-p-q-1 H • ýp mPp-1 P(p, q)=I p + -p- (3.24) n= (q+ 1) m = p mNetwork management data gathering traffic is centered around (0,0), the mobile host that the NMT is connected to. As an example, for a moderate size 400 node mobile net-work, the network management bandwidth from each of the two links extending from (0,0) is the maximum of this network. The number of responses that must pass over the two links in one polling cycle is:
,-1 -• 1 P+qXm+n-p-q-1
po, o)= m 199.5 (3.25)
This number agrees with intuition -we know that for responses to return to (0,0) from the other 399 mobile hosts, half must travel over the link about (0,0), and the other half must travel over the link to the right of (0,0).
In standard SNMP polling, with the values we have attributed to the polling intervals and length of responses:
R bits bytes
BWsNM= 8 8.98 = 71.9 bps (3.26)
byte second
The total network management SNMP response traffic for the 400 node uniform mobile network over the link above (0,0) is:
Net. Mgt. SNMP Response Traffic(0,0)= 199.5 - 71.9= 14339.2bps (3.27)
= 14.3kbps
Based on the criteria that network management traffic should compose less than 5% of a network links' overall traffic, and knowing that on the mobile host with the most net-work management traffic (0,0), each link has netnet-work management traffic of 17.9kbps. This implies that each of our network links must have a link rate of 286.8 kbps in each direction, or a total of at least 573.6 bps. This requirement is above the bandwidth pro-vided by BBN's wireless networks.
3.4.2 An elongated network distribution
The second topology is an elongated distribution from one edge to another. A •Xa xa, networking topology has the same number of mobile hosts (N), but the diagonal length of the network is longer (Figure 3.3). In other words, the maximum number of hops
that can be taken to get from one corner of the network assuming the shortest path is taken is higher.
acxN mobile hosts
(0,0)
- mobile ho
a
Figure 3.3: An elongated N mobile host distribution
By substituting the following for p ,,q) and p,,q) in equations Equation 3.19 and Equation 3.22, we obtain equations for network management traffic for any link on a net-work with a xnxa/i distribution.
lA (p+qym+n-p-q-1) P P r m-p (3.28) m=p n=q+l (+rn) S(P +qXrnm +n-p-q-1) PH p m -p -1(3.29) p(p, q)= (3.29) m=p+1 n=q (m
The maximum network management traffic will flow through the mobile host that the network management station is connected to. Once again, as an example, we consider a moderate sized 400 node mobile network. Using Equation 3.19 and Equation 3.22 with Equation 3.28 and Equation 3.29, we find that the expected number of polls or responses that will traverse the links connected to the mobile host that the NMS is connected to, with
a set to 4 (i.e. a 5x80 network):
· · · · · · · · · · · · · · · · · · · · · · · ·
a .i-1 4-p+qm+n-p-q-1 P o,o) m p - 36.07 (3.30)
m=O
n=1m
I)m
,.
(p
+qym+n-p-q-1)
pHO,0= -m 362.93 (3.31) P(o,o)=X. X
p =32.9m=1
n=
(mn
As a check, we see that the sum of the expected number of polls and requests that go through the link above (0,0) and the link to the right of (0,0) is 399.
We also see that it is expected that more network management traffic will flow over the horizontal link adjacent to (0,0). Using that as a threshold, we find that the total traffic floating over that link is expected to be:
Net. Mgt. SNMP Response Traffic; =q)= 362.93 - 71.9bps = 26085.8 bps (3.32)
= 26.1 kbps
To contain network management traffic to 5% of total bandwidth of this link, every this link needs to allow at least 521.7 kbps in each direction.
3.5
General conclusions
For any given network distribution, the bandwidth used by network management traffic increases linearly with the number of mobile hosts in the network. The amount of band-width needed per link increases linearly as a function of number of mobile hosts also.
Quantitatively, the minimum amount of network management traffic from SNMP responses is:
Net Mgt. SNMP Response Traffic= - BWsRMP bps (3.33)
With four links from each mobile host, and the NMS on a corner, at least half of the polls and responses passing over the link with the maximum network management traffic, so NMSlinks=2. In mobile wireless networks with the NMS in the center of the network instead of the corner can have NMSlinks=4, and one of the edge of the network (but not a comer) can have NMSlinks=3.
The maximum number of polls that have to pass over a link is N-1 (for a completely elongated lxN network). The network management SNMP response traffic in that case is:
Chapter 4
Alternative network management data gathering
solutions
4.1 Introduction
In this chapter we first discuss bandwidth usage of standard SNMP polling over BBN's mobile wireless network. We then propose three alternative strategies to standard SNMP polling - adaptive SNMP, proxy server SNMP, and a hybrid SNMP/OSPF network data gathering strategy -and analyze the bandwidth used by each.
4.2 Standard SNMP polling
As described in Chapter 1, standard SNMP relies on polls and responses for obtaining information from the network. The traffic generated by standard SNMP polling has been described in Chapter 3, and is summarized in Table 4.1.
# of PI LR Total
polls per per LR
Poll type polls p poll per LP per LR
per poll poll per
MH (sec.) (bytes) MH
hpf 1 30 73 73 73 73
lpf 4 300 73 73 292 292
tm 4 60 73 77 292 308
pm 10 1800 73 80 730 800
Table 4.1: Standard SNMP polling traffic table
As shown in Chapter 3, Equation 4.1 describes the traffic flow over the link with the maximum network management traffic: