Breaking the power law: Multiscale
simulations of self-ion irradiated tungsten
The MIT Faculty has made this article openly available.
Please share
how this access benefits you. Your story matters.
Citation
Jin, Miaomiao et al. "Breaking the power law: Multiscale
simulations of self-ion irradiated tungsten." Journal of Nuclear
Materials 504 (June 2018): 33-40 © 2018 Elsevier B.V.
As Published
http://dx.doi.org/10.1016/j.jnucmat.2018.03.018
Publisher
Elsevier BV
Version
Author's final manuscript
Citable link
https://hdl.handle.net/1721.1/130085
Terms of Use
Creative Commons Attribution-NonCommercial-NoDerivs License
Breaking the Power Law: Multiscale Simulations of Self-Ion Irradiated Tungsten
Miaomiao Jina, Cody Permannb, Michael P. Shorta,∗
a
Dept. of Nuclear Science and Engineering, Massachusetts Institute of Technology, 77 Massachusetts Ave., Cambridge, MA, 02139, USA
b
EROB (Engineering Research Office Building) 2525 N. Fremont Ave., Idaho National Laboratory, Idaho Falls, ID, 83145, USA
Abstract
The initial stage of radiation defect creation has often been shown to follow a power law distribution at short time scales, recently so with tungsten, following many self-organizing patterns found in nature. The evolution of this damage, however, is dominated by interactions between defect clusters, as the coalescence of smaller defects into clusters depends wholly on the balance among transport, absorption, and emission to/from existing clusters. The long-time evolution of radiation-induced defects in tungsten is studied with cluster dynamics parameterized with lower length scale simulations, and is shown to deviate from a power law size distribution. The effects of parameters such as dose rate and total dose, as parameters affecting the strength of the driving force for defect evolution, are also analyzed. Excellent agreement is achieved with regards to an experimentally measured defect size distribution at 30K. This study provides another satisfactory explanation for experimental observations in addition to that of primary radiation damage, which should be reconciled with additional validation data.
1. Introduction
Tungsten has been chosen as one of the most suit-able armor materials for the divertor in fusion reac-tors, as this region will be subject to the most extreme conditions during operation. The divertor will be
ex-5
posed to simultaneous, heavy neutron irradiation and intense heat fluxes of up to 10 MW/m2 [1]. Defects accumulated during the exposure to neutron irradi-ation are known to degrade key material properties, such as ductility and thermal conductivity [2].
Stud-10
ies on radiation-induced defect cluster creation and evolution are key to providing fundamental explana-tions and predicexplana-tions of thermomechanical property evolution, which will drastically impact the service lifetime of the components. It is therefore crucial to
15
understand and be able to predict the long time evo-lution of microstructural change from the perspective of defect creation, interaction, and evolution.
Experimental research on radiation induced mi-crostructural evolution is still limited, especially when
20
∗
Corresponding author
Email addresses: [email protected] (Miaomiao Jin), [email protected] (Cody Permann), [email protected] (Michael P. Short)
fusion-relevant conditions are considered. Due to the extreme environment to be present in fusion reactors, fission neutrons and ion irradiation are commonly used as surrogates to study the radiation damage by fusion neutrons (typically at an energy of 14 MeV 25
from deuterium-tritium fusion). However, due to the significant difference in the energy spectra of primary-knock-on atoms (PKA), the validity of using results from fission neutrons or ion beams to approximate fusion neutrons is still a matter of debate. Neverthe- 30
less, a number of previous studies have shed light on the mechanisms of radiation damage recovery. Resid-ual electrical resistivity has been measured during the recovery process of radiation damage, to iden-tify which defects were responsible and how quickly 35
they moved [3]. However, the physical mechanisms governing damage recovery and evolution still remain controversial, as the microstructural changes respon-sible for damage cannot yet be fully characterized. Recent direct observations of defect creation in tung- 40
sten in the transmission electron microscope (TEM) with automated image processing to detect cluster size distributions [4] have given indications of the longer-term evolution of defect clusters produced im-mediately by radiation damage cascades. More re- 45
cent experiments on annealing of polycrystalline and single-crystal tungsten present a better picture of de-fect evolution [5, 6] and links with material property changes [7].
In this work, we combined multiple simulation
50
methods, including binary collision, molecular dy-namics (MD), and rate theory (RT) in the form of cluster dynamics (CD), to model radiation damage in tungsten. Our results show a deviation from pre-viously predicted power law distributions of defect
55
sizes. The result agrees well with the observations in a recent self-ion irradiation experiment [4], param-eterized only by the types and sizes of mobile self-interstitial atom (SIA) clusters. This implies that the mobility of small SIA clusters in irradiated tungsten
60
can be significant enough to explain experimental re-sults, even at cryogenic temperatures. The influence of dose, dose rate, and PKA energy spectrum are also analyzed.
2. Background
65
Radiation damage continues to be quantified us-ing displacements per atom (dpa) [8], which only de-scribes the initial, ballistic stage of radiation damage. It was initially introduced to reconcile differences in observed radiation damage from reactors or
irradi-70
ations with different energy spectra [9], and made great strides in discovering similarities between for-merly disparate experiments. However, the residual radiation damage in the form of various microstruc-tural defects, ultimately of interest in experiments
75
and material property evolution predictions, is sig-nificantly affected by the types of incoming particles [10], the temperature [11], and the dose rate [12]. Also, the long timescale evolution of produced defect clusters over periods of seconds to decades can
in-80
duce microstructural evolution [13], causing material property changes such as void swelling, hardening, and embrittlement [14]. Thus long timescale studies are important to quantify real damage to irradiated materials. Such lengthy experiments are often
infea-85
sible to conduct in realistic conditions, owing to the worldwide scarcity of steady-state neutron sources es-pecially with fusion-relevant neutron energies. There-fore, heavy ion irradiations and simulations are often used as surrogates to neutron irradiation. Commonly
90
employed simulation approaches include the binary collision approximation (BCA) of the initial stage of radiation damage, molecular dynamics (MD)
simu-lations of radiation damage cascades, kinetic Monte Carlo (kMC) for longer timescale evolution of defects, 95
and rate theory (RT) approaches for mean field ap-proximations of defect concentrations. It is these final concentrations at extremely long times, ranging from seconds to years, which are of interest to
experimen-talists and reactor designers. 100
The initial production of defects by irradiation can be obtained from BCA Monte-Carlo simulations. The Norgett-Robinson-Torrens (NRT) model can fur-ther save computational cost by calculating defect production in terms of dpa with simplified equations 105
[15]. While the dpa cannot determine the defect pop-ulations produced by radiation damage, the result-ing PKA spectrum turns out to be very useful in follow-on simulations of damage cascades, which al-lows for the precise description of the movement and 110
formation of defect clusters. MD has been exten-sively used in this regard to generate a comprehensive database of surviving defects in bulk tungsten result-ing from various PKA energies [16]. It was found that interstitial and vacancy cluster production on 115
MD (nanosecond) timescales varies significantly with temperature, cascade energy and interatomic poten-tial. Meanwhile, the MD simulation time and length scales are on the order of nanoseconds and tens of nanometers respectively, preventing the accurate sim- 120
ulation of further annealing of residual damage from multiple damage cascades. Object Kinetic Monte Carlo (OKMC) picks up here, and can be applied to model the microstructural evolution of materials from the atomic to the mesoscopic scales [17, 18, 19]. 125
It relies on pre-existing knowledge of all important interaction mechanisms of modeled entities, defect stability, and migration properties [20]. While low-barrier events may dominate the kinetics of OKMC simulations, focusing on the reactions of interest can 130
allow one to leapfrog through time to approach ex-perimental timescales. In addition, the number of simulated entities should be large enough to guaran-tee statistical quality of the results. Finally, rate the-ory approaches such as cluster dynamics can simulate 135
meso- and macroscale time and length evolution of microstructures due to radiation damage. Similar to OKMC, it also requires the parameterization of inter-action coefficients and stability constants. Neverthe-less, it approximates all defects and other simulated 140
objects with mean field concentrations, thus there is no constraint on dose as encountered in OKMC due to timestep limitations from simulating discrete
pro-cesses. One merit is that it can flexibly deal with spa-tial distributions and time evolution of defects
dur-145
ing irradiation and annealing. A full picture of the multiscale evolution of radiation damage, culminat-ing in the accurate prediction and understandculminat-ing of long timescale phenomena, should combine these ap-proaches to reach experimental timescales without
150
sacrificing more detailed information.
The long timescale modeling of radiation damage has made many recent advances. Starting with ini-tial CD studies of point defect cluster evolution [21], a number of improvements have been made.
Multi-155
ple species have been modeled simultaneously, such as triple beam (H, He, and Fe) irradiation of ferritic alloys [22]. CD modeling of anisotropic materials, such as zirconium, has matched experimental predic-tions of growth [23]. Stoller et al have discovered the
160
conditions under which KMC and rate theory calcu-lations overlap well [24]. More recently Jourdan et al compared the effectiveness of different CD models and cluster size grouping methods [25]. Major ad-vances have also been made in directly linking CD
165
with experiments, such as direct observation of de-fect production and migration under in situ ion ir-radiation [26], and parameterizing cluster dynamics simulations directly with experimental TEM obser-vations [27]. Building on the lessons learned from
170
these previous studies, the tungsten self-ion irradia-tion experiment of Yi et al [4] is chosen as an ideal test case for our CD code, as its relatively low helium generation rate (from its (n,α) cross section) makes for a relatively simple validation case. In addition,
175
these simulations can provide insights on the evolu-tion processes of defects, and addievolu-tional sensitivity studies would help identify the important factors that contribute to the final experimental observations. 3. Methods
180
The SRIM code [28] is widely used to study ion beam implantation, and to compute radiation dam-age exposure in dpa using the binary collision ap-proximation. A recent study [29] recommends that the Kinchin-Pease (K-P) option of SRIM should be
185
selected for accuracy. In this work, 150 keV and 400 keV tungsten self-irradiation were simulated in SRIM using Quick (K-P) mode with 100,000 ions, a dis-placement threshold energy of 80 eV [30] and a sur-face binding energy of 11.75 eV [31]. This resulted
190
in PKA energy distributions for each ion irradiation
condition, from which PKA energies were sampled in the subsequent MD simulations of damage cascades in tungsten. PKA energies were binned into energy groups with binning boundary [101.9, 102.1, · · · , 105.9] 195
eV .
For these simulations, we have tested two EAM potentials from [32] and [33], both of which are splined to the ZBL potential [34] for short range interactions. The system is first equilibrated for ∼ 20 ps at 30 K 200
before introducing each PKA. Damage cascades are initiated by assigning a velocity to the center atom with a random direction. Each PKA energy studied consists of 10-20 independent simulations with differ-ent initial directions, with the full PKA energy range 205
from 100 eV to 250 keV studied using the binning method described above. Note that this energy is a reduced form of particle kinetic energy, where elec-tronic loss is excluded. Each cascade is simulated in the NVE ensemble cooled to 30 K by applying the 210
Berendsen thermostat on boundary layers. The cas-cade process lasts around ∼50ps using an adaptive time step which allows a maximum one-step displace-ment of 0.01 ˚A. The simulation box is chosen for each PKA energy in order to ensure the whole damage 215
cascade lies well within the periodic boundary. The subsequent point defect production from each simu-lation is analyzed using the Wigner-Seitz occupancy criterion. To identify defect clusters, the third near-est neighbor (NN3) and the fourth nearnear-est-neighbor 220
(NN4) distances are used to identify SIA and vacancy clusters, respectively [18].
Direct point defect and cluster production terms from each MD-simulated damage cascade are aver-aged across all directions and aggregated with weights according to the PKA energy spectrum from the SRIM simulations. In this way, the final distribution of clus-ters from self-ion irradiation at 150 keV and 400 keV is acquired. This quantity is used as the input to rate theory simulations as direct defect production terms, with pre-defined defect interaction coefficients from atomistic calculations [17]. The evolution of defect clusters can be described in terms of an evolving size distribution, with negative sizes representing vacancy clusters and positive sizes representing SIA clusters. The general description for the evolution of mobile species concentrations can be written as follows [25] which assumes diffusion-limited reactions between
de-fects: dCm dt = X n Jm−n,m− X n Jm,m+n+ ∇ · (Dm∇Cm) −X t X s∈N (t) k2t,s,mDm(Cm− Ct,s,mm ) + Gm (1)
where Cm is the concentration of size m clusters of
either vacancy or SIA type, Gm is its source term
from the MD simulations, and Dm is its diffusion
co-efficient. Summation over all defect types and sizes is performed by automatically creating one equation for each cluster size and type, with the cross-terms (those with subscript n) providing the coupling be-tween cluster sizes. Microstructural damage sinks such as dislocations in current study are identified by their type t; N (t) are the subsets of type t sink; k2t,s,m is the sink strength for cluster size m; Ct,s,mm is the concentration of species in the matrix close to sink s, approximated as Cmeq, the thermal equilibrium
concentration. Jm,m+nis the net flux of point defects
between clusters of size m and m + n, and Jm−n,m is
the net point defect flux between clusters of size m and m − n.
Jm,m+n= βm,nCmCn− αm+n,nCn+m (2)
Jm−n,m= βm−n,nCm−nCn− αm,nCm (3)
Here, βm,n is the absorption rate and αm+n,nCn+mis
the emission rate of clusters of size n from clusters of size m + n, both of which can be calculated either by
225
using parameters from lower length scale simulations or from empirical expressions.
If we assume that only very small clusters are mo-bile, such that −mv ≤ n ≤ mi, then the generalized
equation for immobile clusters reads as follows: dCn dt = mi X m=−mv (βn−m,mCn−mCm− αn,mCn) − mi X m=−mv (βn,mCnCm− αn+m,mCn+m) (4)
A calculation framework is built in MOOSE [35] to solve this very large number of equations, which rep-resent the evolution of different defect species and
230
sizes during tungsten self-ion irradiation. The func-tionality of the MOOSE custom ”Action” object en-ables a relatively smooth approach to building a sys-tem with thousands of similar, fully coupled partial
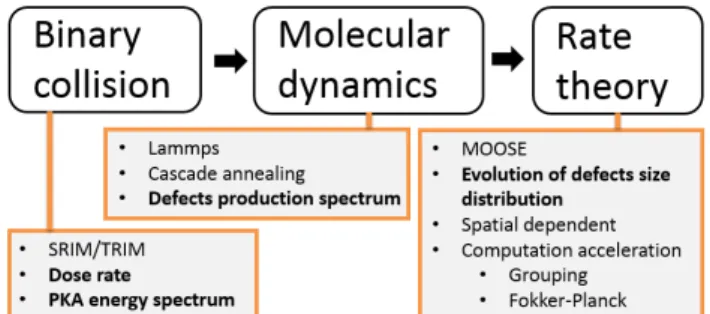
Fig. 1: Multiscale simulation methodology used to study radi-ation defect size evolution. Key results extracted in each stage are marked in bold.
differential equations (PDEs) and ordinary differen- 235
tial equations (ODEs). Meanwhile, to improve the efficiency of the calculations, the grouping method developed by Golubov et al [21] is implemented to group large clusters of the same type. A group width of 5 × 10⁻¹¹ m in r-space as described in [36] has 240
been applied. The solving process utilizes an adap-tive timestepping scheme with timestep ranging from 1 × 10⁻⁹ to 0.01 s. A graphical summary of this full multiscale simulation framework is shown in Fig. 1.
The key elements in studying the evolution of the 245
defect size distribution are the choices of kinetic and thermodynamic parameters. Quantities such as mi-gration energies, attempt frequencies, binding ener-gies, and capture radii are taken to be consistent with previous studies of tungsten [17, 19]. Table 1 and 2 250
summarize the relevant parameters. The capillary approximation of binding energies is used for large clusters over a size of seven defects. Note that va-cancy clusters are assumed to be spherical, while SIA clusters are assumed to be in the form of dislocation 255
loops. In many CD studies, all diffusion is assumed to be isotropic. However, it is generally accepted that 1D movement is preferred for most SIA-type defects with occasional rotation, i.e. a mix of 1D and 3D diffusion. SIA clusters in W may be regarded as a 260
bundle of crowdions, which collectively have a similar migration barrier as a single one [37]. The rotation barrier of the [111] crowdion in tungsten has been calculated at about 0.4 eV by Derlet et al [38]. Con-sidering the low temperature constraint (30K), SIAs 265
and SIA clusters would mostly move in 1D. There-fore, current CD implementation utilizes 3D kinetics for vacancy-type defects and a 1D migration for SIA-type defects based on Kohnert and Wirth’s work [39], which considers the effect of dimensionality in a CD 270
model on Fe.
Ar-Item value comment SIA (cluster) migration energy (eV) 0.013 1D Vacancy migration energy (eV) 1.66 3D
SIA (cluster) attempt frequency (s−1) ν0n−0.5 ν0= 6 × 10¹²s−1, n: defect size
Vacancy attempt frequency (s−1) ν0 ν0= 6 × 10¹²s−1
Vacancy cluster N/A Immobile
SIA (cluster) bias factor 1.15 N/A Vacancy (cluster) bias factor 1.0 N/A Dislocation density (/m2) 1.0 × 10¹² N/A Atomic volume (m3) 1.58 × 10⁻²⁹ N/A Dislocation capture radius (nm) 0.65 Assumption Point defect reaction distance (nm) 0.65 Assumption
Table 1: Parameters used in cluster dynamics (PART I)
SIA binding energies (eV) Vacancy binding energies (eV) Size (n) Eb SIA(n) Size (n) Evb(n) 2 2.12 2 -0.1 3 3.02 3 0.04 4 3.60 4 0.64 5 3.98 5 0.72 6 4.27 6 0.89 7 5.39 7 0.72
>7 Capillary approximationa >7 Capillary approximationa a. Eb(n) = (Eb(2) − Ef or(1))n2/3−(n−1)2/3
22/3−1 + E
f or
(1)
with formation energy Ef or(SIA) = 9.96 eV and Ef or(V ) = 3.23 eV
Table 2: Binding energies used in cluster dynamics (PART II)
rhenius law, i.e. D = D0exp(−kEBmT) where D0 is a
prefactor depending on the attempt frequency and Em is the migration energy, both of which are based
275
on Table 1. The absorption rate between 3D diffusing species is determined by βm,n = 4π(rm+rn)Zm,n(Dm+
Dn) where rm and rn are approximated by the
cap-ture radii, and Zm,nis a bias factor accounting for the
strain field. For 1D diffusing species, we employ the
280
formalism described in detail by Kohnert and Wirth [39]. Specifically, the interaction rates between 1D diffusing defects and other types is primarily deter-mined by the cross-sections, which are readily catego-rized. Here, we assume the reactions between defects
285
take place spontaneously whenever the involved two entities come closer than a reaction distance. Only emission of point defects is considered from clusters, and this rate is written as αm,n = βm−n,nΩ exp(−kEBbT)
where Ω is the atomic volume, and Eb is the
bind-290
ing energy of a point defect to a cluster of size m. As a simplification, the spatial dependence of defect production is not considered.
All related data files used to create the results and figures in this study can be found on our GitHub
295
repository [40].
Fig. 2: PKA spectra calculated from SRIM/TRIM, for tung-sten self-ion irradiation at 150keV (black) and 400keV (yellow)
4. Results
PKA energy spectra for 150 keV and 400 keV tungsten self-ion irradiation, obtained from SRIM sim-ulations, are plotted in Fig. 2. The trend is as ex- 300
pected, with more energetic incoming particles ex-tending the PKA spectrum to a higher energy regime. These PKA energies used for binning are then adopted in the MD simulations as initial PKA energies, to study the detailed behavior of point defect production 305
Fig. 3: Number of defects created at various PKA energies in MD simulations
in tungsten as a function of PKA energy. The final cluster size distribution is calculated as a weighted average with respect to each PKA spectrum. Fig. 3 shows the number of point defects created versus EP KA. Note that energy in the spectrum (EP KA) is
310
different from the MD damage energy (ED) due to
ignoring electronic stopping in the MD simulations. The partition of kinetic energy using this assumption is calculated according to the Lindhard method [8]. Wigner-Seitz cluster analysis on both 150 keV and
315
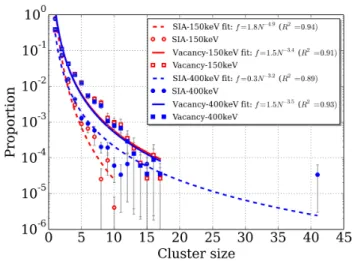
400 keV self-irradiation annealed cases reveals that slightly more vacancies are found in clustered states compared to interstitials with the clustering criteria. The proportion in Fig. 4 is calculated by P nF (n)F (n) where n is defect size and F (n) is the frequency of
320
occurrences.
The MOOSE-based CD framework described in Equations 1-4, with parameters from Tables 1-2, is then used to perform the long time evolution of these created defects, the direct production of which (the
325
source term Gm) in Equation 1 is calculated by
mul-tiplying the total defect creation with the size distri-butions from Fig. 4. By solving this system of cou-pled ODEs, the time-dependent concentrations of all species of interest can be extracted. First, three
sensi-330
tivity studies are presented to ensure that the frame-work produces expected results as functions of SIA cluster mobility, dose rate, and incoming ion energy. It has been found that at low temperatures, the rates of SIA cluster diffusion, and absorption are the main
335
communication mechanisms along the cluster size dis-tribution. One would also expect that an increased
Fig. 4: Defect cluster size distribution at 30 K during the primary stage of tungsten self-irradiation. For each case, A power law fitting is provided along with R2 value.
dose rate leads to less severe microstructural change given the same dose and other parameters [41]. In addition, a larger incoming ion energy is expected to 340
produce denser damage cascades, resulting in fewer point defects, and more clustered vacancies and SIAs when normalized to incoming ion energy [42]. Next, the total dose during 150 keV self-ion irradiation is varied to study the kinetics of evolution of a stable 345
cluster size distribution. Finally, the experimental parameters from the experiment of Yi et al [4] are used in our CD framework to produce a direct com-parison with the results of Sand et al [43] and Yi et
al [4]. 350
4.1. Effect of SIA cluster mobility
Fig. 5 shows the defect size distribution after ir-radiation with 150 keV ions for one second, by vary-ing the largest SIA cluster size (N imax) allowed to
be mobile. As expected, the profile shifts preferen- 355
tially to larger sizes with increasing N imax, with a
peak large size evident when rather large SIA clusters are allowed to be mobile. Since more and more de-fect clusters are mobile, they can interact with each other more efficiently and agglomerate more easily 360
into larger clusters. Comparing the calculated distri-butions in Fig. 5 with in-situ TEM observations [4], a similar trend is observed, which implies that only small SIA clusters are mobile. Even though there are recent MD studies of single large and highly mobile 365
SIA clusters in tungsten [37], experimental results like those of Yi et al consistently show a distribution of
Fig. 5: Defect size distribution with different mobility con-straints on the largest mobile SIA cluster (N imax), after one
second of 150keV tungsten self-ion irradiation
defects corresponding to smaller mobile SIA cluster sizes. The slope of the power law region in the data of Yi et al best matches our simulations when the
370
largest mobile SIA cluster is of size six, so this value is used in future parts of this study.
4.2. Effect of dose rate
The dose rate can be calculated from the exper-imental parameters of Yi et al, including dose and
375
time duration. In the case of 150 keV self-ion irradia-tion, the dose rate was approximately 0.0125 dpa/s in the peak damage area. Two other dose rates of 0.025 and 0.05 dpa/s with the same MD-generated defect production spectrum are also included to explore the
380
underlying trend of defect distribution vs. dose rate. It should be pointed out that the total dose is kept constant at 0.014 dpa. Fig. 6 demonstrates that a higher dose rate leads to a slower shift of the profile to large cluster sizes, which would be expected given
385
less time between overlapping damage cascades. This corresponds to a stronger, but still slow, driving force for the case of radiation defects finding an equilibrium distribution. The results imply that more defects get annihilated in a short time due to the more intense
390
production of defects, and hence imposing more of a time constraint for them to diffuse away from each other. It is important to point out that only the mag-nitude of the defect size distribution is lowered, while the slope at all points remains relatively unchanged.
395
Fig. 6: Final defect size distribution in self-ion irradiated tung-sten, with three different dose rates applied to the same dose (with N imax= 6)
Fig. 7: Defect size distribution in self-ion irradiated tungsten, with incoming ion energies of 150keV and 400keV applied at the same dose rate (N imax= 6)
4.3. Effect of ion energy
A key difference between 150 and 400 keV self-ion irradiation lies in the PKA energy spectrum (see Fig. 2, resulting in a different defect production distribu-tion (Fig. 4). Note that to isolate the influence of the 400
primary damage residual defects, the dose rate and total dose are kept equivalent for both simulations at 0.0125 dpa/s and 0.014 dpa, respectively. Fig. 7 shows that the 400 keV case evolves more slowly than the other. This is due to a larger fraction of point de- 405
fects in the high energy scenario, which less effectively combine to form large clusters.
4.4. Effect of total dose
Various order of magnitude doses are compared using the 150 keV self-ion irradiation condition with
410
a dose rate of 0.0125 dpa/s. The results are plotted in Fig. 8a, indicating an increase in total defect number density and augmented agglomeration of small clus-ters into larger ones at higher doses. A plateau devel-ops in the plot of cluster density with increasing dose
415
(Fig. 8b), which implies a temporary, metastable bal-ance between the direct production of small defect clusters and the decrease in the total concentration of larger ones due to agglomeration with mobile SIA clusters. Notable is that the slope of the defect size
420
distribution does not change for medium sized clus-ters after 10−4 dpa in Fig. 8a, though small clusters continue to decrease resulting in more larger clusters. This is also consistent with our knowledge of defect cluster size evolution. Thus all four sensitivity studies
425
yield relatively expected results, so the experimental case can be more confidently analyzed.
4.5. Experimental comparison
These simulations model the experiments of ultra-high purity tungsten by low-dose, ultra-high-energy
self-430
ion irradiation at 30 K done by Yi et al [4]. It was expected that such a low temperature offers a de-scription of primary damage caused by individual col-lision cascade events, and provides direct evidence of a power law size distribution of nanoscale defects
435
formed in high-energy cascades. However, by further examining the experimental results, the size distri-bution exhibits a clear deviation from the power law at longer times, which suggests that other underlying kinetics become significant even at this low
temper-440
ature. We believe even with a short time duration (∼ 1 s) and a low temperature (30K), SIAs and SIA clusters are still highly mobile due to extremely low migration energy barriers (∼ 0.01eV). In contrast, since vacancy clusters possess high migration barriers
445
and low attempt frequencies, only the monovacancy is considered to be mobile in the model.
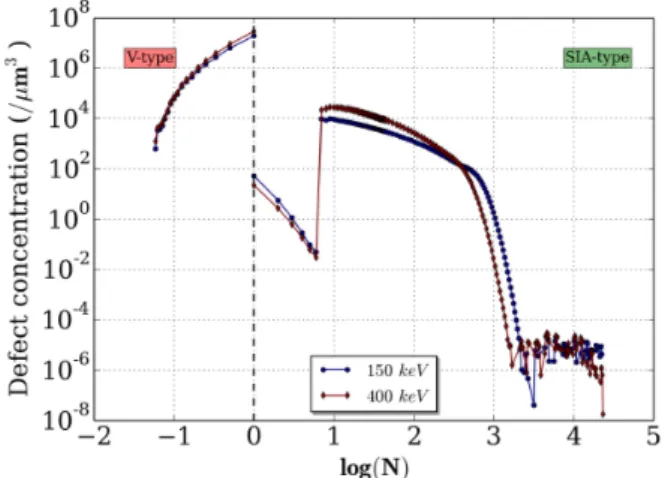
Fig. 9 shows the results of CD simulations of self-ion irradiation in tungsten, overlaid with the ex-perimental results of [4] and the MD simulations by Sand et al [43]. To maintain consistent units, the original figure is re-plotted after a first order approx-imation of defect concentration with an operation shown in (5). The difference between our CD predic-tions and the original MD simulapredic-tions results from
(a) Final defect size distribution with different doses at the same dose rate
(b) SIA cluster density vs. irradiation dose
Fig. 8: Effect of total dose on the defect cluster size distribution in self-ion irradiated tungsten, at a dose rate of 0.0125 dpa/s and a maximum mobile SIA cluster size of N imax= 6)
Fig. 9: Defect cluster concentration as generated by MD sim-ulations [43], rate theory calcsim-ulations (this work), and experi-mental measurements [4]
the longer timescale evolution of the defect size dis-tribution. Sand et al’s results highlight a size-scaling pattern in the initial stage of radiation damage (the defect production term), while longer timescale evolu-tion may be necessary to compare against experimen-tal data and explain the deviation from a power law. The measured defect size distribution matches very well with the CD simulations in this study. This im-plies that additional SIA kinetics play an important role in defect evolution beyond the MD timescale, even at such a low temperature.
(Fluence ∼ 1.25 × 10¹⁶W+/m2) × (Frequency per ion) (Damage depth ∼ 10 nm)
(5) 5. Discussion
Because defect clusters usually become increas-ingly stable with size, and multiple self-interstitial
450
atom (SIA) cluster sizes are mobile, one would not expect a true power law to evolve in this case, but rather a truncated version with dips from the ex-pected power law behavior on both the large and the small ends of the cluster size distribution. Indeed this
455
is precisely what was observed by Yi et al [4]. This study uses a combination of simulation techniques to
reach experimental timescales to reproduce the Yi et al data on the defect size distribution.
Typical parameters in self-ion irradiation have been 460
explored to extract insights regarding defect evolu-tion behavior, including the mobility of SIA clusters (Fig. 5), dose rate (Fig. 6), incoming particle energy (Fig. 7), and total dose (Fig. 8). A number of con-clusions can be drawn from our simulation results: 1) 465
The SIA cluster mobility is very important in deter-mining the final defect size distribution. An upper limit to the mobility of SIA clusters of size six yields results very close to experimental measurements (Fig. 9). 2) A higher dose rate limits the defects’ ability 470
to cluster into larger groups, since more annihilation of SIAs and vacancies is anticipated with less relax-ation time between damage cascades. 3) Different ion energies result in different defect cluster produc-tion terms. We have found that for the higher en- 475
ergy case (400 keV), the amount of small clusters is greater than that of the lower energy case (150 keV). A direct explanation is that the fraction of point de-fects production is higher in 400 keV irradiation. 4) More clusters are expected with increasing dose, and 480
a plateau in the total number of clusters develops across a range of doses.
The only fitting factor remaining in this study is the cutoff size chosen for mobile SIA clusters (N imax).
The very fact that this cutoff delivers good agreement 485
with experimental results indicates that the mobility of large clusters may be constrained in the system. Here we draw inspiration from studies on the mobil-ity of SIA clusters [44] and the drastic effect of carbon atoms (on the scale of ppm) on raising the migration 490
barriers of point defects in Fe [45], and solute-defect interactions in W [46, 47]. These studies lead us to believe that although some SIA clusters composed of crowdions are highly mobile, and undergo 1D motion on their glide prisms in MD simulations, SIA cluster 495
motion in general depend significantly on cluster size and shape, and other extrinsic factors including trap-ping by solute atoms and sources of internal stress, including surrounding defects and sinks. Due to the insufficient atomistic studies on this subject, more 500
careful investigation on the mobility of SIA clusters is needed to confirm the explanations.
Note that MD simulations of primary radiation damage can have quite different results depending on the choice of interatomic potentials, especially for 505
tungsten as shown by Sand et al [48]. Compared with our current work, Sand et al’s MD results based on
Derlet et al’s potential [38] show the production of large clusters [48, 49] with size around 100-200, as also indicated in Fig. 9. It could be due to the
intrin-510
sic emphasis of the potentials, for example, Derlet et al [38] used the family of short-range FS-type poten-tials to find new parametrizations for W, and applied the potential to study the thermally activated mi-gration of self-interstitial atoms in W; Marinica [33]
515
developed the EAM potential for studying radiation defects and dislocations in W. Thus, it is not feasible for us to identify the exact reason that causes the dis-crepancy at this time. Since the probability of captur-ing large clusters is rare, it is worthy to note that in
520
our limited number of independent simulations, it is likely that we have excluded the possibility of produc-tion of large clusters. However, with various source terms, either from aforementioned potentials [32, 33] or off-the-shelf power-law fitting [49], similar
evolu-525
tion results can be achieved with a fitting parameter of N imax(see supplementary materials). This implies
that although the exact value of N imax may change
slightly with different potentials, such a cutoff still exists in order to obtain reasonable agreement with
530
experiments. Therefore, the mobility of large clusters may not be significant enough to matter in this case. Our CD simulations agree generally well with the available experimental observations. The MD stud-ies of Sand et al up to nanosecond timescales also
535
achieve good agreement with the middle of the exper-imental defect cluster size distribution, while longer timescale methods such as CD may be necessary to accommodate observed features for smaller and larger cluster sizes. The deviation in the first experimental
540
data point with our CD results can be explained by the infeasibility of identifying such small defects, as pointed out by Yi et al [4]. For the largest cluster size, the stated concentration represents very few observed clusters of this size, therefore CD results are not
ex-545
pected to provide a perfect match with low statistics. Finally, a more recent study by the originators of the experimental data also demonstrates excellent agreement between simulations and experiments of self-ion irradiated tungsten, by considering the
ad-550
ditional changes to the defect size distribution from sub-cascade splitting [50]. Both studies recreate the experimental deviations from a power law size dis-tribution, calling into question whether one or both explanations is correct. The key difference in the two
555
explanations is long timescale microstructural evolu-tion. In the work of Sand et al, one would expect
a relatively time-invariant shape in the defect size distribution, as sub-cascade splitting occurs on the order of picoseconds to nanoseconds. In our study, 560
the shape of the defect size distribution continues to evolve with time, as evidenced by Fig. 8a. In Fig. 8a, one can see that the magnitude of the defect size dis-tribution increases continuously with increasing dose, after changing shape at very low doses. More ex- 565
periments of self-ion irradiated tungsten, performed under the same conditions at different order of mag-nitude doses, will likely resolve this question.
This comparison with the data of Sand et al. is critical to note, as both their work and ours pro- 570
vide satisfactory modeling results to compare to the one experiment used in both cases. This represents an under-constrained validation problem, where the addition of one experimental variable, in this case time evolution of defect populations, will determine 575
which explanation (primary radiation damage and/or kinetic evolution of smaller clusters) is principally re-sponsible for the observed defect distribution in self-ion irradiatself-ion tungsten. Should irradiatself-ions to longer times show little to no deviation from the one-second 580
irradiation, then the explanation of direct produc-tion in primary radiaproduc-tion damage will be shown to be correct. However, should the defect size distribu-tion significantly change with continued irradiadistribu-tion, then cluster dynamics will have been shown to be 585
the right tool to model this situation. Then, valida-tion with multiple experiments can help inform the most appropriate choice of interatomic potential us-ing shorter irradiations, as well as any hard cutoff in mobile SIA cluster size using longer irradiations. 590
6. Conclusion
The application of multiple simulation methods (binary collision, molecular dynamics, and rate the-ory) has proven to be effective in studying the long time evolution of radiation-induced defects in self-ion 595
irradiated pure tungsten. A very good agreement has been achieved between the defect cluster size distribu-tion found in experiments and CD simuladistribu-tions, while only using the largest mobile interstitial cluster size as a fitting parameter. The deviation from power law 600
scaling found in MD simulations can be understood from the more rapid motion of small SIA clusters. The effectiveness of the code developed in this study demonstrates its potential to be used in similar irradi-ation cases, and the capability to incorporate spatial 605
dependence in future results. This in particular will allow for the explicit study of depth-dependent de-fects resulting from ion irradiation. The next logical extension of this CD framework is to include the ef-fect of gas atoms such as helium, following the work
610
of Xu et al [51], Golubov et al [52], and Marian and Hoang [53], so that more realistic and varied cases may be studied.
7. Acknowledgments
All authors gratefully acknowledge funding by the
615
Idaho National Laboratory (INL) Nuclear University Consortium (NUC), under the Laboratory Directed Research and Development (LDRD) Grant No. 10-112583. The authors also acknowledge many useful conversations with Sidney Yip of MIT, Stanislav
Gol-620
ubov of the Oak Ridge National Laboratory (ORNL), and the entire MOOSE development team at INL, particularly Daniel Schwen, Derek Gaston, and Richard Martineau.
References
625
[1] K. Ikeda, Nucl. Fusion 47 (2007).
[2] V. Barabash, G. Federici, M. R¨odig, L. Snead, and C. Wu, J. Nucl. Mater. 283287, Part 1, 138 (2000).
[3] L. Keys and J. Moteff, J. Nucl. Mater. 34, 260 (1970). [4] X. Yi, A. Sand, D. Mason, M. Kirk, S. Roberts, K.
Nord-630
lund, and S. Dudarev, Euro. Phys. Lett. 110, 36001 (2015).
[5] Y.-W. Kim and J. Galligan, Acta Met. 26, 379 (1978). [6] O. Ogorodnikova, Y. Gasparyan, V. Efimov, L. Ciupiski,
and J. Grzonka, J. Nucl. Mater. 451, 379 (2014).
635
[7] D. E. J. Armstrong, P. D. Edmondson, and S. G. Roberts, Appl. Phys. Lett. 102, 251901 (2013).
[8] G. S. Was, Fundamentals of radiation materials science: metals and alloys (Springer, 2007) pp. 108–109.
[9] H. Heinisch, M. Hamilton, W. Sommer, and P. Ferguson,
640
J. Nucl. Mater. 191-194, Part B, 1177 (1992). [10] G. Was and T. Allen, Mater. Charact. 32, 239 (1994). [11] G. Gupta, Z. Jiao, A. Ham, J. Busby, and G. Was, J.
Nucl. Mater. 351, 162 (2006).
[12] G. Was and T. Allen, J. Nucl. Mater. 205, 332 (1993).
645
[13] M. Short, D. Gaston, C. Stanek, and S. Yip, MRS Bulletin 39, 7177 (2014).
[14] S. Zinkle and G. Was, Acta Mater. 61, 735 (2013). [15] M. Norgett, M. Robinson, and I. Torrens, Nucl. Eng.
Design 33, 50 (1975).
650
[16] W. Setyawan, G. Nandipati, K. J. Roche, H. L. Heinisch, B. D. Wirth, and R. J. Kurtz, J. Nucl. Mater. 462, 329 (2015).
[17] C. S. Becquart, C. Domain, U. Sarkar, A. Debacker, and M. Hou, J. Nucl. Mater. 403, 75 (2010).
655
[18] G. Nandipati, W. Setyawan, H. L. Heinisch, K. J. Roche, R. J. Kurtz, and B. D. Wirth, J. Nucl. Mater. 462, 338 (2015).
[19] G. Nandipati, W. Setyawan, H. L. Heinisch, K. J. Roche, R. J. Kurtz, and B. D. Wirth, J. Nucl. Mater. 462, 345 660
(2015).
[20] C.-C. Fu, J. D. Torre, F. Willaime, J.-L. Bocquet, and A. Barbu, Nat. Mater. 4, 68 (2005).
[21] S. Golubov, A. Ovcharenko, A. Barashev, and B. Singh, Phil. Mag. A 81, 643 (2001). 665
[22] J. Marian and V. V. Bulatov, J. Nucl. Mater. 415, 84 (2011).
[23] F. Christien and A. Barbu, J. Nucl. Mater. 393, 153 (2009).
[24] R. Stoller, S. Golubov, C. Domain, and C. Becquart, J. 670
Nucl. Mater. 382, 77 (2008).
[25] T. Jourdan, G. Bencteux, and G. Adjanor, J. Nucl. Mater. 444, 298 (2014).
[26] D. Xu, B. D. Wirth, M. Li, and M. A. Kirk, Acta Mater.
60, 4286 (2012). 675
[27] E. Meslin, A. Barbu, L. Boulanger, B. Radiguet, P. Pareige, K. Arakawa, and C. C. Fu, J. Nucl. Mater. 382, 190 (2008).
[28] J. F. Ziegler, M. Ziegler, and J. Biersack, Nucl. Instrum. Meth. Phys. Res. B 268, 1818 (2010). 680
[29] R. E. Stoller, M. B. Toloczko, G. S. Was, A. G. Certain, S. Dwaraknath, and F. A. Garner, Nucl. Instrum. Meth. Phys. Res. B 310, 75 (2013).
[30] N. Juslin and B. Wirth, J. Nucl. Mater. 432, 61 (2013). [31] X. Yang and A. Hassanein, Appl. Surf. Sci. 293, 187 685
(2014).
[32] S. Han, L. A. Zepeda-Ruiz, G. J. Ackland, R. Car, and D. J. Srolovitz, J. Appl. Phys. 93, 3328 (2003).
[33] M.-C. Marinica, L. Ventelon, M. Gilbert, L. Proville, S. Dudarev, J. Marian, G. Bencteux, and F. Willaime, 690
J. Phys. Cond. Mat. 25, 395502 (2013).
[34] J. F. Ziegler and J. P. Biersack, in Treatise on Heavy-Ion Science (Springer, 1985) pp. 93–129.
[35] D. R. Gaston, C. J. Permann, J. W. Peterson, A. E. Slaughter, D. Andrˇs, Y. Wang, M. P. Short, D. M. Perez, 695
M. R. Tonks, J. Ortensi, et al., Annals of Nuclear Energy 84, 45 (2015).
[36] A. Ovcharenko, S. Golubov, C. Woo, and H. Huang, Comp. Phys. Comm. 152, 208 (2003).
[37] W. H. Zhou, C. G. Zhang, Y. G. Li, and Z. Zeng, Scientific 700
reports 4 (2014).
[38] P. M. Derlet, D. Nguyen-Manh, and S. Dudarev, Phys. Rev. B 76, 054107 (2007).
[39] A. A. Kohnert and B. D. Wirth, Journal of Applied Physics 117, 154306 (2015). 705
[40] M. Jin, C. Permann, and M. P. Short, “Gemi-nio 2.0 - A MOOSE-based cluster dynamics code,” GitHub Repository, DOI: 10.5281/zenodo.495710 (2017), https://github.com/shortlab/geminio.
[41] N. Budylkin, E. Mironova, V. Chernov, V. Krasnoselov, 710
S. Porollo, and F. Garner, J. Nucl. Mater. 375, 359 (2008).
[42] D. Bacon, F. Gao, and Y. Osetsky, J. Nucl. Mater. 276, 1 (2000).
[43] A. E. Sand, S. L. Dudarev, and K. Nordlund, Euro. Phys. 715
Lett. 103, 46003 (2013).
[44] B. Wirth, G. Odette, D. Maroudas, and G. Lucas, Journal of nuclear materials 276, 33 (2000).
[45] S. Takaki, J. Fuss, H. Kuglers, U. Dedek, and H. Schultz, Radiation effects 79, 87 (1983). 720
[46] X.-S. Kong, Y.-W. You, C. Song, Q. Fang, J.-L. Chen, G.-N. Luo, and C. Liu, Journal of Nuclear Materials 430, 270 (2012).
[47] C. Becquart and C. Domain, Current Opinion in Solid State and Materials Science 16, 115 (2012).
725
[48] A. Sand, S. Dudarev, and K. Nordlund, EPL (Europhysics Letters) 103, 46003 (2013).
[49] A. E. Sand, M. Aliaga, M. J. Caturla, and K. Nordlund, EPL (Europhysics Letters) 115, 36001 (2016).
[50] A. E. Sand, D. R. Mason, A. D. Backer, X. Yi, S. L.
730
Dudarev, and K. Nordlund, Mater. Res. Lett. (2017), doi: 10.1080/21663831.2017.1294117.
[51] D. Xu, X. Hu, and B. D. Wirth, Appl. Phys. Lett. 102, 011904 (2013).
[52] S. Golubov, R. Stoller, S. Zinkle, and A. Ovcharenko, J.
735
Nucl. Mater. 361, 149 (2007).
[53] J. Marian and T. L. Hoang, J. Nucl. Mater. 429, 293 (2012).

![Fig. 9 shows the results of CD simulations of self-ion irradiation in tungsten, overlaid with the ex-perimental results of [4] and the MD simulations by Sand et al [43]](https://thumb-eu.123doks.com/thumbv2/123doknet/14184045.476773/9.892.473.823.294.544/results-simulations-irradiation-tungsten-overlaid-perimental-results-simulations.webp)
![Fig. 9: Defect cluster concentration as generated by MD sim- sim-ulations [43], rate theory calcsim-ulations (this work), and experi-mental measurements [4]](https://thumb-eu.123doks.com/thumbv2/123doknet/14184045.476773/10.892.105.363.122.483/defect-cluster-concentration-generated-ulations-calcsim-ulations-measurements.webp)
