Corporate Restructuring: An Analysis of Spin-offs,
Sell-offs and Equity Carve-outs
by
Eric A. Powers
B.A. Cornell University (1986)
M.B.A. Cornell University (1993)
Submitted to the Sloan School of Management
in partial fulfillment of the requirements for the degree of
Doctor of Philosophy
at the
MASSACHUSETTS INSTITUTE OF TECHNOLOGY
Setember 1998
@
Eric A.
rs (all ights reserved)
The author hereby grants to Massachusetts Institute of Technology
permission to reproduce and
to distribute copies of this thesis document in whole or in part.
Signature of Author ...
Si
Certified by ...
Signature redacted
Slo1n School of Management
gnature redacted
11-11,r
July 16, 1998
David Scharfstein
Dai-Ichi Kangyo Bank Professor of Management
Signature redacted
Accepted by ...
MASSACHUSTS INSTIUT OF TECHNOLOGYJUL
2
8 1998
Thesis Supervisor
Birger Wernerfelt
Chair, Doctoral Program
ARCHIVES
~.77
Corporate Restructuring: An Analysis of Spin-offs, Sell-offs
and Equity Carve-outs
by
Eric A. Powers
Submitted to the Sloan School of Management on July 16, 1998, in partial fulfillment of the
requirements for the degree of Doctor of Philosophy
Abstract
This thesis consists of three essays addressing various issues in corporate restructuring. The first paper analyzes the pre and post-restructuring operating performance and returns of 115 carve-out firms and their parents. I find that operating performance of carve-outs peaks in the year of issuance at which point carve-outs are significantly outperforming comparable firms. Subsequent declines in performance are significant even after controlling for normal regression toward the mean. Over the ensuing 5 years, carve-outs underperform the CRSP equal weighted index and portfolios of firms matched on the basis of size and market to book. Bootstrapping techniques are utilized to deal with mispecification of common significance tests. Aside from high leverage, parents have unremarkable operating characteristics. Parent returns are comparable to the market for the five years prior to, and the five years after, the carve-out. Evidence is consistent with market timing motives typical of seasoned equity offerings playing an important part in equity carve-out decisions and of potential increases in efficiency playing a less important role than previously believed.
The second paper expands on the first and analyzes three alternative methods
(spin-offs, sell-offs or carve-outs) for parent corporations to reduce or eliminate their presence in
a particular industry. Previous research documents that announcements of these restruc-turing transactions result in positive cumulative abnormal returns of similar magnitude. These announcement effects are consistent with the belief that all three transactions gen-erate increases in efficiency, as structural inefficiencies endemic to diversified firms are eliminated. Is it true however, that the three transaction alternatives share similar moti-vations? In this study, I analyze a sample of 161 spin-offs, 81 sell-offs and 167 carve-outs occurring between 1981 and 1996 in an effort quantify the determinants of the restruc-turing choice. Motives are broadly classified as either structural (marked by a desire to eliminate structural inefficiencies) or financial (marked by a desire to raise capital).
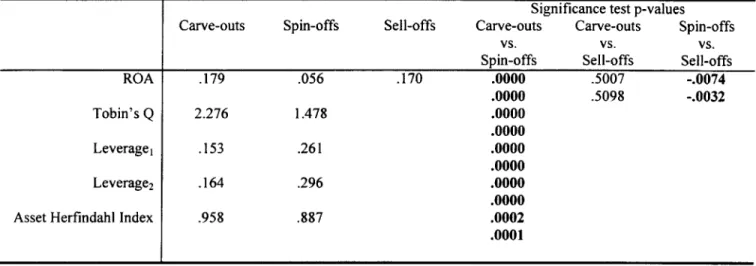
Univariate comparisons and multinomial logistic regressions indicate that spin-offs are driven primarily by structural motivations while carve-outs are driven primarily by finan-cial motivations. Sell-offs occupy a middle ground between the other two transactions.
The third paper is co-authored with David Scharfstein. In this study we investigate the workings of internal capital markets by analyzing a sample of 161 spin-offs. This sample allows us to examine the capital allocation process when a division is part of a multi-divisional firm, and to see how the process changes once it is spun off as an independent entity. We find that conglomerate divisions in bad (good) industries tend to invest more (less) relative to their stand-alone industry peers if the other divisions in the conglomerate are in good (bad) industries. This pattern does not exist once the division is spun off. This evidence is consistent with Scharfstein and Stein's (1998) theory of socialism in capital allocation whereby bad divisions are subsidized by good divisions and vice versa. Consistent with additional predictions of this theory, we find that socialism is more pronounced in conglomerates with unrelated lines of business and small outside shareholdings.
Thesis Supervisor: David Scharfstein
Contents
0.1 Acknowledgments . . . . 0.2 D edication . . . .
1 Introduction
2 Market Timing and Equity Carve-outs 2.1 Introduction ... ...
2.2 Carve-outs in the Context of Other Events . . . .
2.3 The Data ... .... ... ... .. ... ....
2.4 Characteristics of the Deal . . . .
2.5 Operating Performance . . . . 2.5.1 Carve-out Operating Characteristics . . . . 2.5.2 Carve-out Growth and Investment Policy . . . . 2.5.3 Parent Operating Characteristics . . . . 2.5.4 Intra-firm Industry Comparison . . . .
2.6 Long Term Stock Market Performance . . . . 2.6.1 Carve-out Returns . . . .
2.6.2 Parent Returns . . . .
2.6.3 Industry Returns . . . . 2.6.4 Analysis of the Source of Relative Performance.
2.7 Conclusion . . . . 2.8 Tables . . . . 8 8 9 13 . . . . 13 . . . . 15 . . . . 20 . . . . 22 . . . . 24 . . . . 24 . . . . 29 . . . . 30 . . . . 32 . . . . 33 . . . . 33 . . . . 37 . . . . 38 . . . . 39 . . . . 42 . . -46
2.9 Appendix 1: Variable Definitions . . . . 62
2.10 Appendix 2: Accounting Treatment of Carve-outs. . . . . 63
3 Spin-offs, Sell-offs and Equity Carve-outs, Finding the Right Tool for the Job 65 3.1 Introduction . . . ... 65
3.2 Why Restructure/Refocus?. . . . . 68
3.3 Prior Research . . . . 73
3.4 The Data ... .. ... . . ... .. ... ... . . 76
3.5 Univariate Analysis: General Characteristics . . . . 79
3.5.1 Overview . . . . 79
3.5.2 Divestiture Divisions. . . . . 81
3.5.3 Divestiture Parents. . . . . 84
3.5.4 Divestiture Divisions Compared to Parents. . . . . 85
3.5.5 Market and Industry Returns. . . . . 86
3.5.6 Announcement Effects . . . . 87
3.5.7 Equity Ownership. . . . . 88
3.6 Multivariate Analysis: Logistic Regressions on Divestiture Choice. ... 90
3.7 Conclusion. . . . . 95
3.9 A ppendix 1 . . . . 112
3.9.1 Calculation of Cumulative Abnormal Returns. . . . . 112
4 Inefficient Internal Capital Markets: Evidence from Spin-offs (Co-authored with David Scharfstein) 4.1 Introduction ... 4.2 The Data ... ... .... . .... 4.3 Characteristics of the Sample . . . . . 4.4 Regression Results . . . . 4.4.1 Pooled Cross-Sectional Analysis 4.4.2 Panel Data Regression. . . . . . 4.4.3 Symmetry of effects . . . . 4.4.4 Relation to Value: . . . . 4.5 Conclusion: . . . . 4.6 Tables . . . . 114 . . . . 114 . . .. . .. ... .. . .. . .. . 118 . . . . 122 . . . . 123 . . . 123 . . . 128 . . . 131 . . . . 132 . . . . 134 . . . . 137
0.1
Acknowledgments
Completion of this work was made possible with the help of numerous dedicated in-dividuals. First and foremost is my wife Heather. Her continuous love, support and encouragement throughout the years of study and research have been invaluable. It is an understatement to say that it would have been difficult, both emotionally and economi-cally to complete my PhD without her.
My parents have been, and continue to be instrumental in providing an environment
where all of my pursuits are supported and encouraged. If I am able to live up to the standards that they set as parents then I will feel that I have truly accomplished something.
I thank my advisors David Scharfstein, Jeremy Stein and Denis Gromb for their
willingness to listen to my ideas and offer inciteful critiques. All three went out of their way to create time for students hoping to make use of their respective talents. Their continual insistence on tightening loose hypotheses and focusing on well defined problems has been an invaluable learning experience.
My classmates at MIT greatly enriched my learning experience. Special thanks go
to fellow PhD students Jan Mahrt-Smith and Arvind Krishnamurthy. Both provided frequent and valuable feedback. More importantly, both were eager to participate in stress relieving non-academic pursuits that helped make life bearable.
0.2
Dedication
This thesis is dedicated to the memory of my mother-in-law, Carol C. Tatkon, who passed away October 11, 1997. Her quick wit, intelligence, love of life and unequivocal faith in my abilities were an inspiration.
Chapter 1
Introduction
This thesis consists of three related essays addressing various issues in corporate restruc-turing. Restructuring has recently become a hot academic topic. Changes in corporate goverance, regulation, financial markets and financial institutions have generated a surge in activity as various entities seek to unwind the conglomerates formed in earlier years. Naturally, academic research has followed in the footsteps of the marketplace, analyzing the data of a massive natural experiment.
Prior academic studies have proposed a variety of theories on the nature of the firm and have documented numerous facts about how diversified as well as focused firms operate. The papers presented in this thesis add to those empirical facts. Chapter 1 is an analysis of equity carve-outs. In an equity carve-out, a parent firm legally incorporates a subsidiary then sells a portion of the newly created common shares in an initial public offering. Typically, the parent maintains significant ownership in the carved out entity. The net result is a legally independent new firm that still maintains close ties to the parent. Parents typically experience a positive jump in their stock price when they announce a carve-out. This is generally interpreted as evidence that carve-outs create value, whether by improving incentives for the carve-out managers, improving access to
capital markets or by putting enough distance between parent and carve-out to eliminate inefficiencies inherent in conglomerates.
The intent of the study presented in chapter 1 is to track down sources of this increase in value. Recent studies find evidence of improvements in profitability after spin-offs occur; evidence which might explain the positive announcement effect also experienced
by the spin-off parent. Rather than finding increases in profitability following carve-outs,
however, I document distinctly different results. Operating performance for carve-out divisions peaks in the year of the carve-out at levels that are significantly above industry levels. Carve-outs experience significant declines in performance back to industry medians over the ensuing years. In addition, there is no evidence of improvements in parent profitability following the carve-out.
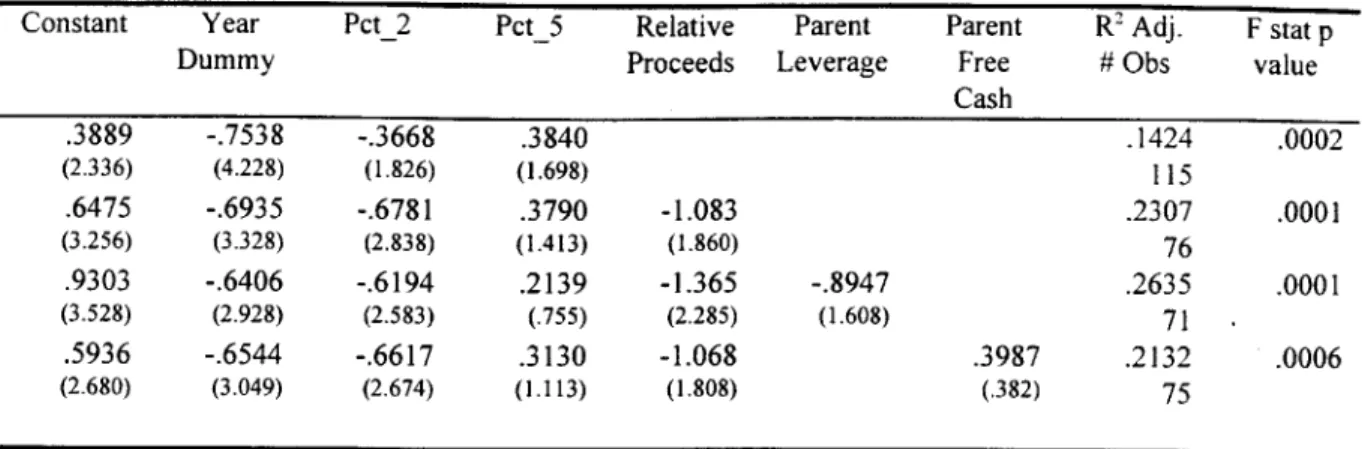
Long term returns for the carve-outs are poor. Carve-out equity underperforms generic stock indices and firms matched on the basis of market to book ratios and size. Regression results indicate that these negative long term excess returns are correlated with the percentage of shares sold, relative dollar value of shares sold and leverage of the parent. Carve-outs also generally occur during bull market periods and in industries with positive excess returns. These results, coupled with a variety of related facts indicate an opportunity to time the market and issue an overvalued security may be an important factor in driving decisions to pursue equity carve-outs. Obviously, this result is at odds with the positive announcement effects.
Chapter 2 builds on the results of chapter 1. This section looks jointly at spin-offs, sell-offs and equity carve-outs in an effort to quantify the factors that induce parent firms to choose one restructuring option over another. Spin-offs are similar to carve-outs except that shares in the newly incorporated division are not sold in an initial public offering, but are given to current parent shareholders in a pro-rata distribution. It is important to note that no cash changes hands. In a sell-off, a division is sold directly to another
-4
corporation. The general evidence that I report supports the conclusion of market timing found in chapter 1.
A variety of univariate and logistic regression results indicate that spin-offs are likely
to occur when a profitable parent has a poorly performing division in an industry without positive excess returns and without evidence of significant growth opportunities. Further-more, spin-off are more likely in parents that have moderately low leverage and when the spin-off is in an industry that is unrelated to the core industries of the parent. Sell-offs are more likely to occur with parents that are less profitable and have greater leverage than the median firm in their industry. Like spin-offs, sell-offs generally occur in industries without positive excess returns. Consistent with evidence from chapter 1, carve-outs are more likely to occur when parents have low overall profitability, are highly levered and have a division in an industry related to the core parent industry. They are also more likely to occur during bull market periods and in industries with positive excess returns. These results reinforce the belief that carve-outs occur when an opportunity to sell an overvalued security presents itself. Spin-offs occur when the division in question has be-come a drag on parent operations. Rather than wait for a good price for the division, parents sever ties via the spin-off and move on.
Chapter 3 takes a different approach from the previous chapters and looks at one of the potential sources of inefficiency in diversified conglomerates. Numerous theories abound as to why many conglomerates seem to be valued at less than the sum of their parts. One theory that has gained recent support is that, due to internal agency conflicts, conglomerates are ineffectual when it comes to allocating capital to its most productive use. In other words, internal capital markets may be less efficient than external market based capital markets. In joint work with David Scharfstein, we assess this theory by analyzing the capital expenditures of a sample of spin-offs, both while they are part of the parent firm and when they are an independent entity. We find evidence that while
part of the parent firm, the spin-off's industry adjusted capital expenditures are sensitive to proxies for the difference in investment opportunities between the spin-off and the rest of the parent. Specifically, spin-offs that operate in industries that have high Tobin's
Q
relative to the other industries of the parent underinvest. Conversely, spin-offs that operate in industries that have low Tobin'sQ
relative to the other industries of the parent overinvest. These relationships disappear once the spin-off becomes independent.These results are interpreted as evidence of corporate socialism in capital allocation. Strong divisions inefficiently subsidize weak divisions. The unique contribution of this chapter stems from the data that we use. Spin-offs are able to act as their own control sample between the pre and post-spin-off periods. This nullifies a common criticism of prior research that divisions inside conglomerates are fundamentally different from the typical stand-alone firm used as a comparison. Instead of merely documenting the existence of a conglomerate discount, this chapter provides solid evidence of a potential
source of the conglomerate discount. Unwinding this inefficiency may, therefore, be a
fundamental reason for pursuing a focus increasing restructuring.
Chapter 2
Market Timing and Equity
Carve-outs
2.1
Introduction
Prior research documents positive cumulative abnormal returns when restructuring trans-actions such as spin-offs or asset sell-offs are announced. These results have led to a com-mon belief that restructuring transactions universally generate increases in efficiency. In contrast, announcements of financing transactions such as seasoned equity offerings are associated with negative announcement period excess returns. In addition, firms conduct-ing seasoned equity offerconduct-ings or initial public offerconduct-ings display negative long term excess returns when compared to a variety of benchmarks. These results support the belief that financing transactions occur when management is pessimistic about future prospects. Eq-uity carve-outs are unique in that they combine characteristics of both restructuring and financing transactions.1 If efficiency motives drive pure restructuring transactions and
'Spin-offs occur when a parent corporation legally incorporates a subsidiary, creates shares in the subsidiary via a registration with the Securities and Exchange Conunision then distributes the shares via a pro-rata distribution to current shareholders of the parent. A sell-off is the direct sale of assets from one corporation to another corporation. A carve-out is similar to a spin-off except that the new shares
market timing motives drive pure financing transactions, then what motives drive equity carve-outs? Finance practitioners generally interpret the positive cumulative abnormal return associated with carve-out announcements as evidence that carve-out decisions are driven by efficiency motives. This paper presents evidence that market timing motives are a significant influence on decisions to undertake equity carve-outs.
I analyze the operating and market performance of a sample of 115 carve-outs which occurred between 1981 and 1993. Carve-out operating performance peaks in the year of the carve-out where levels are significantly higher than levels seen in comparable firms. Over the subsequent five years, operating performance declines back to industry norms. As an example, return on assets (ROA), measured as operating income normalized by to-tal assets, increases from a median of 12.90% two years prior to the carve-out to 17.14% in the year of the carve-out. Over the next two years median ROA declines back to 12.98%. Declines in performance are significant even after controlling for normal regression to the mean by matching carve-out firms to firms with similar operating performance. Sales and earnings growth show similar peaked patterns.
At issue, carve-outs have significantly higher market to book ratios than firms in the same industry indicating that continued strong performance is expected. Over the next five years, however, carve-outs underperform the CRSP equal weighted index by
28.8% and portfolios matched on the basis of size and market to book ratios by 33.1%.
Underperformance is significant at the 1% and 10% levels respectively when compared to boot-strapping distributions.
Aside from high leverage, parents fail to exhibit similarly distinctive characteristics. Their operating performance and growth rates are consistent and do not differ appreciably
are sold via an initial public offering to an entirely new set of shareholders. Parents generally only sell a portion of the new shares. The rest are retained by the parent as a majority shareholder. See appendix 2 for information on details which depend on the percentage sold by the parent. Confusion sometimes occurs because many people refer to carve-outs as "a partial spin-off via an initial public offering".
from industry levels. In contrast to firms conducting seasoned equity offerings, parent long term equity returns do not differ appreciably from returns on the CRSP equal weighted index. Analysis of segment data shows that the median Tobin's
Q,
sales growth and asset growth for the carve-out's industry are greater than corresponding values for industries of the other segments of the parents.The picture that emerges is one of a parent firm potentially in need of funds due to its high leverage. Rather than conduct a seasoned offering, these parents opt for the carve-out of a particularly noteworthy division. Evidence that carve-out excess returns are negatively correlated with the percentage of ownership sold and the relative amount of funds raised indicate that parents know when the offering price is good relative to intrinsic value. Results are consistent with parents exploiting a window of opportunity in which they can issue potentially overvalued carve-out equity.
2.2
Carve-outs in the Context of Other Events
A wealth of event studies in the 1980s analyze announcement effects for a variety of
transactions. Miles and Rosenfeld (1983) are among the first to investigate the informa-tional impact of what I will term restructuring events. They find that parents register significant cumulative abnormal returns (CAR's) of 3.34% during the two days surround-ing a spin-off announcement. Similar results are found by Schipper and Smith (1983) and Hite and Owers (1983). Alexander, Benson and Kampmeyer (1984) find CAR's of 2.1% for parents divesting assets via direct sale to other firms. Later studies by Jain
(1985) and Hite, Owers and Rogers (1987) document comparable results. Schipper and
Smith (1986) find that parents conducting carve-outs have a CAR of 1.8% over the five days surrounding announcement. Similar carve-out announcement effects are found in the course of other studies such as Klein, Rosenfeld and Beranek (1991), Lang, Poulsen
and Stulz (1995) and Michaely and Shaw (1995).
Later studies of carve-outs have discovered additional details about announcement effects. Byers, Lee and Opler (1996) find that parent announcement period returns are greater if: the parent retains a significant stake, there was a change in parent management in the prior year, there has not been a significant run up in the price of the parent in the prior year and the proceeds from the carve-out are to be paid out as opposed to being kept inside the firm. Byers et.al. believe the first three characteristics distinguish parents who have shifted management policies and are trying to light a fire under the executives of the carve-out division. The payout characteristic is believed to identify carve-outs driven by a desire to exploit potential gains in efficiency. Managers of parents that pay out proceeds are less likely to be motivated by the private benefits associated with investable cash. Allen and McConnell find similar announcement period results where the decision to disperse funds and the size of the carve-out relative to the parent are significant positive determinants in the announcement period returns. Rather than look at parent CAR's, Slovin, Shuska and Ferraro (1995) find that firms which are in the same industry as the carve-out show announcement period CAR's of -1.11%.2
In contrast to restructuring events, seasoned equity offerings (SEO's) show roughly opposite results. Asquith and Mullins (1986), Masulis and Korwar (1986) and Mikkelson and Partch (1986) find that SEO announcements generate CARs of approximately -3.0% during the surrounding days. Schipper and Smith (1986) also look at subsequent SEO's
by parent firms which previously conducted carve-outs. Consistent with other studies,
they find SEO CAR's of -3.5%.
The positive CAR associated with spin-off, divestiture and carve-out announcements
2One of the latest additions to the carve-out announcement effect literature questions the very basis
of previous results. Hand and Skantz (1997b) find that announcement date increases in parent company stock price are accompanied by a decrease of similar magnitude at the carve-out issue date.
is often informally presented as evidence of increased efficiency resulting from the restruc-turing. Extensive work documents that conglomerate firms are inefficient. For example, Lang and Stulz (1994) find that Tobin's
Q
for multi-segment firms is .43 less than the sales weighted average of segment median industryQ,
indicating that a conglomerate's value is less than the sum of its parts. Potential sources of inefficiency and reduced value include poorly functioning internal capital markets,3 an inability to optimize stock based incentive plans for all but the most senior executives,4 limited coverage byindus-try specific analysts' and reluctance by empire building managers to cut ties from poorly performing divisions.
Spin-off efficiency stories are supported by two recent empirical studies. Wruck and Wruck (1996) analyze long term operating performance and returns for a sample of spin-offs and their parents. They find that both spin-spin-offs and their parents show improvements
in ROA (measured as operatigi )come) and sales growth over the ensuing four years. Capital
expenditures are also found to increase during the same period. Average three year spin-off and parent returns of 72.5% and 76.1% are larger than corresponding market returns
by 28.2% and 26.7% respectively.6 Daley, Mehrotra and Sivakumar (1997) analyze parent and spin-offs as a combined unit. Their focus is on comparing spin-offs in the same industry as the parent versus spin-offs in unrelated industries. For unrelated spin-offs
3
Shin and Stulz (1995) find that investment of small divisions in conglomerates is dependent on the free cash flow of their larger brethren. When the firm's cash flow is high, these small divisions invest more than their stand alone counterparts. When the firm's cash flow is low, the opposite relationship is observed. Lamont (1996) finds that investment in the non-oil divisions of energy company conglomerates was strongly affected by energy shocks in the 70's and 80's while investment by comparable stand alone firms was relatively unaffected.
4
Thermoelectron, a company that has over a dozen carve-out children or grandchildren reports in-centive motives as one of the prime reasons for doing carve-outs.
5Bhushan (1989) finds evidence that analyst coverage is negatively related to the degree of firm diversification. Gilson, Healy, Noe and Palepu (1997) analyze a sample of spin-offs, carve-outs and targeted stock deals where inadequate analyst coverage is cited as a reason for the restructuring. They document significant turnover and increase in analyst coverage. Moreover, these changes are correlated with subsequent improvements in earnings forecasts.
6
they find increases in ROA of 3.0% between the year before and the year after the
spin-off.7
Spin-offs produce two totally separate companies and should therefore eliminate the conglomerate discount vis-A-vis the spun-off division. In comparison, carve-outs result in a partial separation which may eliminate some of the bad characteristics of conglomerates while retaining potential coordination benefits. Fund transfers into and out of the carve-out division are no longer as easy to implement.8 If these transfers previously reflected
inefficient capital investment decisions then a fiduciary responsibility to minority investors should reduce this inefficiency. Carve-outs also provide an equity security reflecting the performance of a specific division rather than of an entire conglomerate. This new security can now be used in the incentive contracts of carve-out managers in place of less informative accounting measures or parent company equity. Finally, the new publicly traded security is accompanied by audited financial information and market returns that are useful to prospective and current debt holders for evaluating the financial health of the carve-out firm.
An alternative explanation for the positive CAR seen in equity carve-outs is provided
by Nanda (1991). He generalizes the model of Myers and Majluf (1984) to describe a firm
that can fund a positive NPV investment project via an SEO or an equity carve-out. As in Myers and Majluf there is asymmetric information, this time concerning the value of assets in place of both the parent and the potential carve-out division. Firms that resort
7
In contrast to the Wruck and Wruck and Daley et.al. results, Michaely and Shaw (1995) find very poor operating performance and long term returns for a sample of carve-outs and spin-offs of Master Limited Partnerships (MLP's). They find ROA declines of 5.09% for carve-outs and 7.56% for spin-offs in the 2 years after the event. Parents show similar declines in performance. Master Limited Partnerships are a specialized organization form with significant differences from normally incorporated firms with respect to tax treatment, type of firms which can become an MLP and ownership/control structure. Because of these differences, much of Michaely and Shaw's sample comes from the oil and gas industry. The differences in sample population make it difficult to generalize their results to other studies.
8Legally, money can flow from the carve-out to the parent only via dividends or debt repayments. All economic transactions between the two entities are supposed to be accomplished "at arms length".
to carve-out equity will generally be those with high value parent assets and low value carve-out assets. A characteristic of five of the six possible Perfect Bayesian Equilibria in Nanda's model is that a decision to issue carve-out equity results in an increase in price for the parent company, despite the release of negative information about carve-out assets.
The negative CAR associated with SEO's is usually rationalized as evidence of the Myers and Majluf model. Firms with low value assets in place are more willing to raise financing via an SEO than are firms with high value assets in place. Announcement of an SEO therefore results in a release of negative information. Evidence on post-issue operating performance of SEO's is consistent with this story. Loughran and Ritter (1995a) find that median ROA for SEO firms declines from 15.8% in the year of the issue to 12.0% four years later. Teoh, Welch and Wong (1997) document similar declines and trace the source to aggressive accrual accounting prior to the SEO in an apparent attempt to artificially improve earnings. In addition to negative CAR's, researchers have observed that SEO's have poor long term returns. Spiess and Affleck-Graves (1995) find that five year SEO returns are 32% less than returns of firms of similar size from the same industry. An opportunity to sell shares at more than their intrinsic value provides additional incentives for low value firms to pursue an SEO.
Carve-outs share characteristics with both restructuring and financing transactions. Like spin-offs, carve-outs reduce the influence of the parent corporation over the carved-out division. In addition a new security is created. Arguments can be made that carve-outs should share all of the hypothesized spin-off efficiency gains. Like SEO's and IPO's, however, carve-outs entail the sale of ownership for cash. This introduces potential market timing complications into the efficiency story. The remaining sections of the paper provide an in-depth investigation of carve-outs, their parents and their industries in an attempt to assess the relative importance of the competing motivations.
2.3
The Data
Carve-outs are identified via the Securities Data Company (SDC) New Issues database for 1980-1990 and via the annual summary of deals in Mergers and Acquisitions for
1991-1993. The years 1994-1996 are not included since my analysis requires several years of
post-carve-out operating and market data for each firm. The sample is restricted to carve-outs which generate more than $20 million in proceeds, have Standard Industrial Classification (SIC) codes between 1000 and 5999, are not Limited Partnerships (LP's), and are not American Depository Receipts (ADR's). SDC identifies one hundred-five carve-outs while Mergers and Acquisitions identifies twenty-five carve-outs. The SIC code restriction excludes non-industrial firms (0-999 constitutes agricultural firms,
5000-5999: financial firms, 6000-10000: service firms and government agencies). LP's are
excluded since tax regulations and control issues for LP's are significantly different from normal firms. ADR's are excluded since international parent firm operating data is more difficult to obtain and to interpret. The size restriction was chosen due to cost constraints as a way to limit the number of firms provided in SDC's list. Throughout this study, the fiscal year during which the carve-out occurs will be referred to as year 0. Prior and post-event fiscal years are referred to as year -1, year 1 etc.9
Pre-carve-out operating data comes from the prospectus for each issue. A prospec-tus generally provides balance sheet data for two years prior to the carve-out, income statement data for four years prior to the carve-out and cash flow statement data for three years prior to the carve-out. Summary data on the carve-out division such as total assets, revenues and net income are generally given for five years prior to the carve-out. Prospectuses also contain data on the actual deal such as offering price, number
9
Unless otherwise specified, all dollar amounts are quoted in millions except for per-share values which are in units.
of shares sold, total shares sold, over-allotment provisions, and deal expenses. Finally, prospectuses include a brief one paragraph statement on the proposed use of the proceeds. Prospectuses are available for eighty-nine of the one hundred-five carve-outs identified
by SDC and for twenty-four of the twenty-five identified by the Mergers and Acquisitions
articles. Operating data for three additional carve-outs are obtained from prospectuses of debt issues which occurred close to the date of the carve-out. Note that these issues lack data on the actual deal. This provides a sample of one hundred-sixteen carve-outs with pre-carve-out operating data.
COMPUSTAT is used for parent operating data and for carve-out data after the
carve-out becomes a public company. CRSP is used for all security return data. CRSP and COMPUSTAT data are available for eighty-four of the parents and all but one of the carve-outs. The missing parent observations are because the parent is not publicly traded (fourteen firms), or because the parent is traded on a foreign exchange not covered
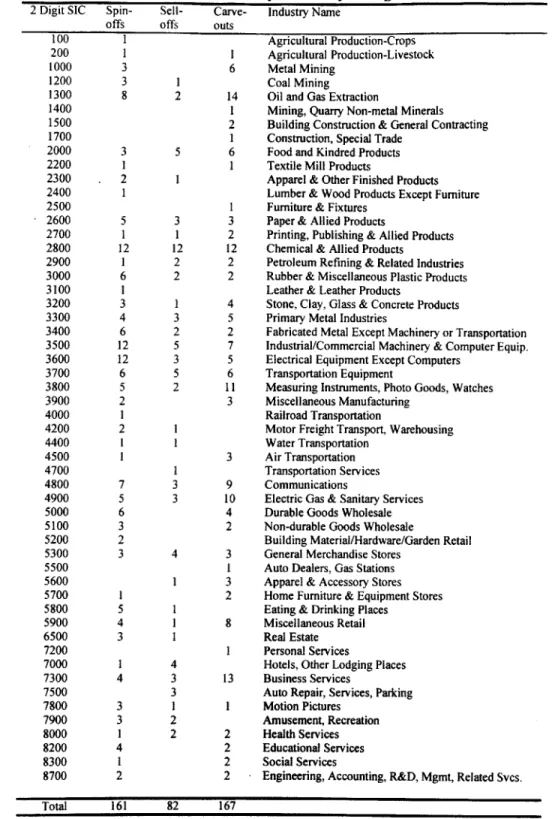
by CRSP or COMPUSTAT (seventeen firms). Table 1 lists the number of carve-outs and
funds raised per year. Table 2 provides summary information on industry affiliations of parents and carve-outs.
Matching firm samples are selected for each carve-out and parent by searching the
COMPUSTAT segment data base for firms that generated at least 75% of their sales in
the appropriate four, three or two digit SIC. Once identified, the full-firm annual data for that particular match is gathered for each year in which the match had the requisite
75% concentration. If there are five or more four digit SIC matches available in all of
the years needed to match carve-out or parent firm data, then the matching sample is composed of four digit SIC matches. Otherwise, matches are made at the three or two digit SIC level. Sixty-eight of the one hundred-fifteen carve-out firms and forty-one of the eighty-four parent firms are paired with four digit SIC matching groups. Three digit SIC matches are used for forty-four carve-outs and forty parents. The remaining three
observations in both groups are paired with three digit SIC matches.
This procedure of identifying matches via segment sales data is used for two reasons. The first reason is to circumvent the fact that the annual COMPUSTAT record for each firm contains only one SIC. This SIC is the most recent primary SIC of a corporation. Thus, a firm like Chris Craft Inc. might be listed as a television broadcasting firm today, while twenty years ago it was a boat manufacturer. It would be inappropriate to compare a broadcasting firm in 1980 to a boat manufacturer just because the current SIC's match. The second reason is to ensure that the matching samples are composed of pure-play companies. A firm like General Electric lists a primary SIC of 3800, however, that SIC accounts for only 20% of GE's revenue. Matching via segment data alleviates both of these problems.
2.4
Characteristics of the Deal
Parents sell an average (median) of 37.5% (27.3%) of their ownership in the carve-out. The minimum percentage ownership sold is 4.8% while the maximum percentage sold is
100%.10 Gross proceeds average $122.3 ($79.9) million. As expected, underwriters take
a significant share of the funds raised. After deducting fees and expenses, the average deal raises $104.2 ($61.8) million. Fees and expenses on average consume 8.8% of gross proceeds with a maximum of 16.7% and a minimum of 3.8%.
In contrast to IPO's, this sample does not show significant underpricing. The closing price on the first day of carve-out trading is on average only 54 cents more than the offering price. This works out to an average price change of 2.9%. The maximum percentage price increase is 70% and the maximum percentage price decrease is 71%.
10Six of the deals in this sample are full divestiture IPO's. While the classic carveout is usually
characterized as a deal where the parent maintains more than 50% ownership, there was no a-priori reason to exclude deals where parents sell more than 50% ownership.
The 9 5th and 5 th percentiles are 25% and -23%."
The average carve-out comprises a noticeable portion of the parent. As of the date of the carve-out, the mean (median) values for carve-out total book assets is $545.1 ($230.1) million. Initial sales are $655.1 ($291.5) million. The largest carve-out in the sample has total assets of $5.589 billion and sales of $7.681 billion. Corresponding values for parents are: total book assets $6.516 ($2.360) billion, sales $3.726 ($2.024) billion. As expected, parents are significantly larger than carve-outs.
Gross proceeds as a percentage of parent market value are 14.4% (4.9%). There are four primary uses of the proceeds: 1) remit to the parent, 2) carve-out expansion either as -CAPX, R&D or acquisitions, 3) general corporate purposes of the carve-out, 4) pay down debt of the carve-out. The breakdown is summarized in table 3. Giving the money back to the parent is by far the most common choice. 76.8% of all proceeds raised in this sample are remitted to the parent. 50% of firms report this as the sole use of proceeds. Paying off carve-out debt is the next largest use of funds, accounting for 8.8% of total proceeds. Carve-out expansion and general corporate purposes account for the remaining known uses with 4.8% and 3.3% respectively. Many prospectuses indicate that proceeds will be used to pay down debt that was recently borrowed for the express purpose of paying a dividend to the parent. In these situations the use of funds is altered to indicate that proceeds are going to the parent.
Five of the one hundred-fifteen deals are for dual class stock. In one deal, the class held by the parent has a subordinated dividend claim. In the other four deals, the class being sold to the public has less voting power than the class retained by the parent. One of the four has a 1:3 vote ratio. Two of the four have 1:5 vote ratios. In the final deal, the public shares have no voting rights at all. In two of the one hundred-fifteen deals, the
"Ibbottson, Sindelar and Ritter (1988) report average first day returns of 16.4% for a sample of 8,668 IPO's between 1960 and 1987.
prospectus indicate that the parent firm intends to spin off its remaining shares within the next year.
2.5
Operating Performance
2.5.1
Carve-out Operating Characteristics
The most striking characteristic of equity carve-outs is the trend in their profitability as shown in table 4 panel A. Mean ROA peaks in the year prior to the issue at 19.45% while median ROA peaks in the year of the issue at 17.14%.12 The average difference in ROA relative to the matching sample in year 0 of 9.29% is strongly significant with a t statistic of 7.784. Skewness is a problem for most ratios in this study, however, a sign test and a Wilcoxon signed rank (WSR) test are both significant at the .0001 level. T statistics for the average difference are significant at the 5% level or better for years -3,
-1, 0,+1,+2 and +3. The two sign statistics are significant at the 5% level or better for
all years between -2 and +4.
Klein, Rosenfeld and Beranek (1991) find that by 1988, forty-four of fifty-two carve-outs implemented between 1966 and 1983 were either reacquired by the parent, or were sold off to another firm. They describe carve-outs as a temporary stopping point enroute to a more permanent capital structure. This sample also show signs of impermanence. It is therefore possible that patterns in operating performance are due to new observations filtering into the sample in the five years prior to the carve-out, and to firms leaving the sample during the five years after the carve-out due to reacquisition or sell off. Analysis
'2
ROA is calculated in three different ways for this study. ROA1 = oPer.ti"ng income ROA2
net income+ interest +taxes+depreciation eiterota es ra . ROROA3 3 =net = income
s "",",.Unless otherwise specified, all references to
ROA from here on will relate to ROA1 unless a subscript is explicitly included. Results for all three
definitions are provided in the tables in order to provide comparability to other studies. A summary of data definitions is provided in appendix 1.
of year to year changes within each carve-out (table 4 panel B), however, shows that this is not the primary source of results. Within firm differences are calculated by subtracting a firm's ROA in year i from the firm's ROA in year 0. The mean and median differences within firms are of roughly the same level as the corresponding differences across the entire sample. Both t-statistics and sign tests are significant at the 5% level or better for
all difference except for the difference between year 0 and year -1.1
As noted by Barber and Lyons (1996), there is normally a regression towards the mean in accounting data that can be misconstrued as a significant change." To account for this effect, further analysis of the change in ROA between year 0 and year +2 makes use of control portfolios. ROA is calculated for all firms listed on COMPUSTAT between
1977 and 1996. Outliers are moderated by winsorizing the data at the 1st and 9 9th
percentiles." Changes in ROA over the prior two years and the ensuing two years are then calculated for each firm-year observation. Change in ROA for carve-out firms is then adjusted by subtracting the average(median) change in ROA for the matching sample from the appropriate year. A variety of comparisons based on the various combinations of size, two digit SIC,' current ROA and prior ROA trend are presented in table 4 panel
13An analysis of CRSP delisting codes shows that, over the five year window of this study, twenty-eight carve-outs are acquired by another firm and four are delisted due to financial difficulties. A cursory analysis (not reported) of change in ROA from year 0 to +2 shows that the decline for acquired firms is roughly 65% of the decline for non-acquired firms. At this time, the identity of the acquiring firms has not been determined.
4They conclude that many previous analyses of operating performance are based on misspecified tests when the sample under consideration has prior performance that is either extremely good or extremely bad. In random draws of securities with good or bad prior performance, they reject the null hypothesis of no subsequent significant changes in performance too often. In essence, what is often construed as subsequent significant changes in performance is really nothing more than a normal regression to the mean. In order to control for this effect, they recommend comparing post-event changes in operating performance to changes seen in portfolios of firms that are matched based on three criteria: size, two digit SIC and current ROA.
15
If an observations has an ROA less than the 1st percentile value or greater than the 99th percentile value then the applicable percentile value is substituted in its place. This is done with all firm years combined into one large group.
16It is difficult to find sufficient matching firms at the three digit SIC level while also requiring similar size or operating performance, thus, two digit SIC matching is used.
C. When size (book value of assets) is included as a matching requirement, control firms
must be within 50% of the carve-out firm size. When ROA or ROA trend is included
as a matching requirement, control firms must be within 20% of the corresponding carve-out value.
Normal regression to the mean is found to explain some of the decline in ROA seen in table 4 panels A and B, but not all of it. As an example, when matches are made on the basis of size and ROA, adjusted change in ROA (AROA) remains significant. Mean (median) AROA is 5.8% (1.89%) for ROA1 , 5.0% (1.75%) for ROA2 and 6.0%
(1.84%) for ROA3. Corresponding t-statistics are 3.122, 2.451 and 3.114: all significant at
better than the 5% level. Both non-parametric statistics are significant at the 1% level for all three ROA formulations. The only comparison group with poor results occurs when matches are based on ROA trend and current ROA. Mean (median) AROA values for the three ROA measures after this comparison are 3.41% (1.48%), 2.97% (2.30%) and 2.33% (.007%). Only the t-statistic for AROA1 is significant and then only at
the 10% level. The non-parametric statistics, however, are generally significant. Weak significance in this comparison can be partly attributed to the difficulty in finding enough matching firms. Over thirty firms are not matched in this comparison. In addition, small numbers of matching firms in each matching sample lead to greater problems with outlying observations. In general, however, the evidence rejects a null hypothesis that carve-out firms do not experience significant declines in operating performance.
Analysis of the source of the superior prior performance shows that carve-out firms have slightly greater asset utilization rates as shown by the salJf,es ratio, and
signif-icantly better sales margins. Table 5 summarizes these relationships. The patterns of both ratios mirror the pattern of ROA with results peaking either in year 0 or -1. The difference in margins at year 0 of 4.1% has a significant t-statistic of 4.35 and sign test significance of .0001. Similar significance is evident in years -2, -1, +1 and +2. Asset
utilization is less significant but consistently points in the same direction of superior carve-out performance around year 0.
Previous studies find similar results for related transactions. Jain and Kini (1994) analyze a subset of IPO's that have COMPUSTAT data available for the year prior to the IPO and report decreases in ROA from fiscal year -1.17 The median decrease is 3.58% in year 0, 7.6% in year +1, 10.53% in year +2 and 9.09% in year +3. With respect to matching firms, they find higher median ROA of 10% in year -1, 5% in year 0, 2% in year +1, and 0% thereafter. Differences in year -1 are statistically significant. Loughran and Ritter (1995a) find that SEO firm ROA decreases from 6.3% to 3.1% over the four years following the SEO. Michaely and Shaw in their analysis of Limited Partnerships find that the carve-outs in their sample experience a decline in ROA from 7.8% to 2.6% between the year prior to the carve-out and the year following the carve-out.18
It is possible that the carve-out ROA pattern is a result of accounting or transfer pricing chicanery engineered by the parent firm in order to improve the appearance of the carve-out. Teoh, Welch and Wong (1997, 1997a) find that prior to IPO's and SEO's, firms become increasingly aggressive in their use of discretionary accruals in an apparent effort to pump up earnings.19 Sample split comparisons and cross sectional regressions show that firms with the most aggressive accounting policies have the worst returns over the ensuing five years. The detail of Teoh et. al.'s analysis is beyond the scope of this study, however, a cursory analysis of Sales General and Administrative expenses (SGA)
1 7
Approximately 40% of the carveouts in this study's sample have COMPUSTAT data available for the fiscal year prior to the actual carveout. None of the firms in this sample have COMPUSTAT data available more than one year prior.
18
Loughran and Ritter and Michaely and Shaw compute ROA in its more typical form of
income before extraordinary items Table 4 panel A shows similar results in this study for this particular
definition of ROA. 19
Teoh, Welch and Wong estimate discretionary accruals as the residual from cross sectional regressions which estimate what the normal level of accruals (as a function of sales growth) would be for comparable firms.
27
ml
(not reported) does not reveal serious manipulation.
If parents are trying to improve the observed profitability of a carve-out division then one simple alternative would be to reduce the overhead expenses charged to the carve-out division. If this were the case then we would expect to see a decline in the ratio of SGA
in the years prior to the carve-out, with a corresponding increase in the years after the carve-out. While ' (not reported) does decline from a median level of .151 in year -3 to .135 in year 0, the difference is not significant. G increases in the years following
the carve-out. Again however, the differences are not significant. It is puzzling why the ratio continues to increase in the later years. If parents undercharged the carve-out division prior to the carve-out then most of the readjustment should occur in year +1. It is possible that the best run firms are the ones that exit the sample early. It is also possible that the carve-out divisions just do not run as efficiently on their own.
Teoh et. al. (1997a) also find that the peaked pattern seen in SEO ROA (measured as net income ) is driven predominantly by changes in the rate of accrual recognition, not
in changes in operational performance. Cash flow from operations normalized by assets actually shows a declining trend prior to the SEO while remaining essentially unchanged after the SEO. Analysis of ROA1 shows that their accrual result is not seen in this
carve-out sample. This difference is surprising since it seems likely that creative accounting across divisions of a firm would be easier to conceal than across an entire firm. A possible explanation is that carve-outs are a spur of the moment decision rather than a long planned for adjustment in capital structure. If this is true then we would not expect to see many prior changes in accounting policies.
2.5.2
Carve-out Growth and Investment Policy
Consistent with higher profitability, carve-outs expend more on capital expenditures (CAPX) as a percentage of total assets than do matching firms. The mean (median) capital expenditures normalized by assets ratio (CAPXA) for carve-outs in year 0 are
9.1% (7.7%) as compared to 6.8% (5.9%) for matching samples. The difference has a
t-statistic of 3.30. Similar significant differences occur in years -2, -1, +1 and +2. By year +3 the two sign statistics are weak enough to begin questioning the value of the marginally significant t-statistics. The same patterns occur when CAPX is normalized
by sales or net property plant and equipment, however, the significance tests are not
quite as strong.
Sales grow significantly in the period prior to the carve-out. Sales growth peaks two years before the carve-out at 190.7% (18.1%) and gradually declines thereafter. In the year after the carve-out, sales growth drops to 14.8% (0.7%). Differences in sales growth rates are significant. In table 6 panel A, the difference in growth rates between years -2..-1 and +1..+2 of 28.2% has a t-statistic of 2.242 and sign test statistics that are significant at the .01 level. Results are comparable across other pre-event and post-event years. The pattern of growth in EBITD mirrors that of sales growth. T-tests for significant differences in EBITD growth across pre-event and post-event years are not significant at conventional levels, however, sign tests are significant at the .01 level or better. In opposition to sales growth, CAPXA remains at its year 0 level of approximately 7.5% for the next two years. It is not until year +3 that CAPXA begins to decline to the level of comparison firms.
There is no clean way to say whether the difference in capital expenditures from year
0 through year +2 is a sign of efficiency or waste. Given the greater initial profitability
it is possible that the greater profitably is a temporary product of chance that has been exploited (identified) by a carve-out. If this is true, then the above average capital expenditures during profitability's inevitable regression to the mean are unwarranted. The possibility of excessive investment would be consistent with the "free cash flow" hypothesis articulated in Jensen and Meckling (1986).
2.5.3
Parent Operating Characteristics
Parents do not show the distinctive operating patterns that carve-outs show. Results are shown in table 7. In year 0, ROA for the parent sample is 11.59% (12.66%). Prior and later years display similar values. In no year is the ROA of the parent significantly different from the median ROA of the matching sample. This result is true no matter which formulation of ROA is analyzed. Within firm comparisons of parent firm operating characteristics (not shown) show insignificant improvements prior to the carve-out and
insignificant declines after the carve-out. Variations in parent ROA are correlated with
movements in match ROA. The maximum difference occurs in year 0 with parent ROA being 1.7% (.34%) greater than the corresponding match. The significance tests show a inconsequential t-statistic of 1.11, sign test p values of .640 and WSR p value of .241.20 Subtracting carve-out data from parent data to give us information on the remaining businesses of the parent does not change the conclusion that parent are unremarkable.
The most distinguishing characteristic of parents is their significantly higher leverage. Debt as a percentage of total market value for parents in year 0 is 35.0% (35.1%) versus 21.0% (20.4%) for matching samples. The difference in leverage is highly significant with
20 Caution should be exercised when looking at parent profitability in year 0. Parents have the option of recording the difference between the book value of shares sold and their actual market value as a "gain on sale" on their income statement. Given that the vast majority of carve-outs have high market to book ratios, this means that parent net income in year 0 will be unnaturally high. Hand and Skantz (1997c) find that 81% of the parent firms in their sample of carve-outs book the gain on their income statement.
a t-statistic of 5.93 and WSR p values of .0001. This pattern is evident and statistically significant in all data years. The peak difference occurs in year -1 when market leverage for parents is 38.7% (34.3%) versus 22.1% (20.9%) for matching samples. The difference in year -1 has a t-statistic of 6.73 and WSR p values of .0001. Debt as a percentage of book value shows an identical pattern. A within firm analysis (not reported) shows that book leverage increases significantly between years -2 and -1; increasing from 53.1% (49.2%) to 58.6% (53.9%). The difference produces a t-statistic of 2.67 with WSR p values of .0104.21 As expected interest coverage ratios for parents are less than the corresponding ratio for matching samples. In year 0, median values are 3.71 for parents versus 4.44 for matching samples. (Means are not reported for interest coverage due to significant skewness).
The high level of leverage is a likely impetus for an equity issue as a means to adjust the parent capital structure. It is difficult, however, to detect that leverage decreases significantly on average after the carve-out. The difference between book leverage in year -1 and 0 is only 2.5% (3.2%) with a t statistic of 1.24 and sign test p values of .1147 and .0743. As noted earlier, the mean (median) gross proceeds as a percentage of parent total assets is 13.3% (6.7%). On average, parents receive about 75% of net proceeds. If all proceeds were applied to debt reduction then we would expect to observe book leverage decreases of at least 10%.22 It is likely that a significant number of parents retain the proceeds rather than dispersing them to outside claimants such as debt-holders.23
Market valuation ratios for the parent are shown in table 8. Parents have low values for Tobin's
Q
when compared to their matching samples. In year 0, median parentQ
2 1
Similar high leverage of carve-out parents is documented by Allen and McConnell. 22
Assuming net proceeds are 92% of gross proceeds, 75% of funds are remitted to parent and applied to debt reduction, 50% of parent book liabilities are debt: 13.3%*92%*75%*(1/50%)=18.4%
23Allen and McConnel find that parents who announce an intention to pay out proceeds experience announcement period increases of 6.63%, while parents who retain the proceeds experience announcement period returns of -. 01%.
is 1.102 versus 1.364 for the median of all matching sample medians. The differences in
Q
are significant for years -3 through +3 with t-statistics as high as 3.706 and WSR p values of .0001. In all years, parents have higher Price/Earnings ratios than their match sample median. Differences in P/E ratios are not as significant as differences inQ
due to greater skewness. LowQ
and high P/E ratios are generally not synonymous. The high leverage of parents is probably what drives this juxtaposition. High leverage generates high interest costs which decrease the earnings per share denominator in the P/E ratio. There is no corresponding change in the numerator or denominator ofQ.
Finally, parents have consistent dividend payout ratios that are much greater than payout ratios for the matching samples. Parent median payout ratios at year -1 and 0 are .314 and .240 while median matches have payout ratios of 0. The difference needs to be interpreted with caution since parents tend to be larger than equivalent matching sample firms who often do not pay dividends.2.5.4
Intra-firm Industry Comparison
COMPUSTAT segment data provides an opportunity to compare the industry of the
carve-out to the industries of the other divisions of the parent. Segment data is available for 64 of the 84 parent firms. Year 0 industry median Tobin's
Q,
ROA, sales growth and asset growth are computed for all of the SIC codes listed in the various firms segment data. As before, matches are made at either the four, three, or two digit level whenever there are five or more firms with more than 75% of their sales at the applicable SIC classification level. Results are shown in table 9. Comparisons show that the industry of the carve-out has higher median Tobin'sQ,
sales growth and total asset growth than the industries of the other segments of the parent. Median industry ROA's do not differ significantly. These results hold when comparisons are made to sales weighted averagesNWN1NWWNWN11NNNFM
I.
(not reported) of the parent's other segments. When compared to the carve-outs that they are generating, parents appear remarkably mundane. It is likely that parents and their investment bankers are able to spin a more appealing story for the future prospects of the carve-out than for the future prospects of the parent.
2.6
Long Term Stock Market Performance
2.6.1
Carve-out Returns
A pervasive feature of IPO's and SEO's seems to be long term underperformance.21
Spin-offs on the other hand generate superior long term returns.2
' Returns for this carve-out
sample are more comparable to those associated with IPO's and SEO's. Pre-event returns are calculated for the five year period ending on the day before the carve-out. Post-event returns are calculated from the first reported trading day on or after the date of the carve-out. A significant portion of both the carve-out and parent samples do not trade during the entire analysis period. In these cases, the return on the appropriate matching sample is substituted for the missing time periods in order to fill them out.
Over the five years following the carve-out, buy and hold returns for carve-outs are 45.7% (23.1%) versus 74.5% (70.4%) for the equal weighted index and 82.7% (78.9%) for the value weighted index. Excess returns versus the CRSP equal weighted index are -28.8% (-51.43%) and -33.1% (-58.7%) versus the value weighted index. Year by year performance is summarized in table 10.26 In order to test the significance of these results, 24Spiess and Affleck-Graves (1995) find median five year post-SEO performance of 10% versus 42.3% for a sample of matching firms. Loughran and Ritter (1995) find long-run performance of IPO's of 15.7% versus 66.4% for matching firms.
2 5
Cusatis, Miles and Woolridge (1993) find mean three year buy and hold returns of 76.0% for a sample of pure spinoffs. This return is 33.6% greater than returns for matching firms and is significant at the 5% level.
2 6Canina, Michaely, Thaler and Womack find that compounding daily returns for an equally weighted index can generate a large positive bias in the calculated long term return of the index. A primary