Publisher’s version / Version de l'éditeur:
Vous avez des questions? Nous pouvons vous aider. Pour communiquer directement avec un auteur, consultez la première page de la revue dans laquelle son article a été publié afin de trouver ses coordonnées. Si vous n’arrivez pas à les repérer, communiquez avec nous à [email protected].
Questions? Contact the NRC Publications Archive team at
[email protected]. If you wish to email the authors directly, please see the first page of the publication for their contact information.
https://publications-cnrc.canada.ca/fra/droits
L’accès à ce site Web et l’utilisation de son contenu sont assujettis aux conditions présentées dans le site LISEZ CES CONDITIONS ATTENTIVEMENT AVANT D’UTILISER CE SITE WEB.
International Symposium on Digital Human Modeling [Proceedings], 2011-06-01
READ THESE TERMS AND CONDITIONS CAREFULLY BEFORE USING THIS WEBSITE. https://nrc-publications.canada.ca/eng/copyright
NRC Publications Archive Record / Notice des Archives des publications du CNRC :
https://nrc-publications.canada.ca/eng/view/object/?id=0b2667d3-84c3-44f0-990e-5ad3995e9617
https://publications-cnrc.canada.ca/fra/voir/objet/?id=0b2667d3-84c3-44f0-990e-5ad3995e9617
This publication could be one of several versions: author’s original, accepted manuscript or the publisher’s version. / La version de cette publication peut être l’une des suivantes : la version prépublication de l’auteur, la version acceptée du manuscrit ou la version de l’éditeur.Access and use of this website and the material on it are subject to the Terms and Conditions set forth at
Geometric and Statistical Methods for Processing 3D Anthropometric
Data
Geometric and Statistical Methods for Processing 3D
Anthropometric Data
Chang Shu*† Stefanie Wuhrer† Pengcheng Xi†
† National Research Council Canada 1200 Montreal Road, Ottawa, Ontario, Canada
Abstract
3D anthropometric data obtained from 3D imaging technology provide unprecedented information about the human shape. At the same time, 3D data present tremendous new challenges. New software tools and analytical methods have to be designed to realize the full potential of the 3D data. One prominent character of the 3D data is that they are a collection of coordinates in 3-space and do not have a natural order. This poses problems for performing statistical analysis. In order to make sense about this new type of data, 3D points have to be registered such that meaningful correspondences across all the models can be established. Other issues include data completion, compression, and visualization. In this paper, we describe a framework and the techniques involved in processing the 3D anthropometric data for the purpose of making them usable for designing products that fit the human shapes.
Keywords: statistical shape analysis, 3D anthropometry, geometry processing, human shape modeling.
1. Introduction
Anthropometry, the study of human body measurement, provides information about the human shape variation to industrial design. Traditionally, simple tools like tape measures and calipers were used to measure linear distances between landmarks or circumferences at specific locations. Although these tools are inexpensive and easy to use, they only provide limited shape information. Meanwhile, during the past twenty years, 3D imaging technology has matured to the point that we can digitize the full surface of the human body with reasonable accuracy and efficiency. Around the world, there have been many 3D anthropometry surveys. For example, the CAESAR project is the earliest and one of the largest (Robinette and Daanen 1997).
3D anthropometry opens up new opportunities to understand the human shape variability. Initially, the most obvious uses of the 3D data include visualizing the 3D shape and performing repeated measurements on the 3D shapes. However, as the 3D data accumulate, it becomes clear that we need to build statistical models in order to realize the full potential of these data. In this paper, we describe a framework of processing the 3D anthropometric data to understand the human shape variability.
One prominent character of the 3D data is that they are a collection of coordinates in 3-space. In contrast to the traditional anthropometric measurement, the geometry of the human body is represented directly in the three-dimensional Euclidean space. A geometric approach toward representing and analyzing shapes, called geometric
morphometrics, was first developed in biological
sciences, where variation of biological forms and their relations to functionality are studied. Bookstein applied multivariate statistics to manually placed landmark coordinates (Bookstein 1997; Zelditch et al. 2004). Meanwhile, Kendall and other statisticians developed a theoretical foundation (Kendall 1984; Kendall 1989; Dryden and Mardia 1998) for statistical shape analysis. This new type of statistics retains the surface geometry and reveals shape variations that are impossible to capture with the traditional measurements. The results can also be visualized in an intuitive way using modern computer graphics techniques.
In principle, we can apply the geometric morphometric approach to 3D scans. However, the difficulty is that each scan has a different number of points and these points do not have a natural order. In order to perform statistical shape analysis, we need to register the 3D points such that meaningful correspondences across all of the models can be established. In other words, we need to
2 parameterize the data models such that they all have
the same number of vertices and the same topological structure.
Techniques from computer graphics, computer vision, and machine learning can be used to solve the correspondence problem. One way of establishing a correspondence across the models is to fit a generic surface model to each scan such that the key anatomical points are in correspondence. The fitting can be guided by the anthropometric landmarks. However, placing the landmarks on the subjects prior to scanning is a tedious and time-consuming task. We show that it is possible to locate the landmarks automatically. The method is based on statistical learning. Local surface properties and distances between landmarks are used to learn the parameters of a probabilistic graphical model. The prediction of the landmark locations is formulated as finding the maximum likelihood configuration of the landmark labeling.
Once we have parameterized the data models, we are ready to perform statistical shape analysis. Multivariate statistics can be applied to the coordinates of the vertices. Since a typical 3D scan consists of 100,000 to 500,000 points, the shape space is high dimensional. Well-known statistical techniques such as Principal Component Analysis (PCA) can be used to reduce the dimensionality. It turns out that there is usually a low-dimensional subspace for human shape data. Thus we can obtain a compact representation of the space of human shapes.
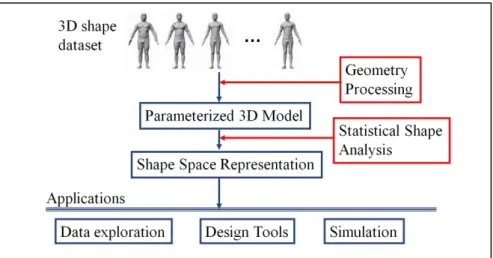
Figure 1 illustrates the framework of processing and analyzing the 3D anthropometric data. The goal is to prepare the data such that we can build a statistical model of the human shape. From this model, we can develop a variety of applications such as data exploration tools for understanding the shape variability, or design and simulation tools for solving specific engineering problems.
2. Geometry Processing 2.1. Data parameterization
The goal of data parameterization is to establish a correspondence among the models. An early attempt to solve this problem adopts a volumetric approach (Ben Azouz et al. 2003, Ben Azouz et al. 2006). Each model is embedded in an m x n x k regular grid. By carefully orienting and normalizing the models, a correspondence in the ambient space and thus a correspondence among the models is established. The advantage of this method is that it is landmark-free. It is also easy to implement. The drawback, however, is that the correspondence it produces is not accurate. Holes have to be filled before a model can be embedded into a grid. This proved to be a difficult task because certain parts of the model, for example, the area under the arms, have large holes. In some parts, like the hands and ears, up to 50% of the information is missing.
A more effective approach is to fit a generic mesh model to each data scan (Allen et al. 2003; Mochimaru et al. 2000; Mochimaru et al. 2005; Amberg et al. 2007; Yeh et al. 2011). This model is complete and has well-shaped and well-distributed triangles. The fitting deforms the generic model to each scan such that the two models are made geometrically equivalent. When deforming the generic model, the correspondence between the anatomical parts has to be maintained. This is achieved by using landmarks, which serves as the initial conditions for the solution of the problem. When deforming the generic model, we have to carefully maitain the smoothness of the surface. Otherwise, the triangles can go into each other, causing invalid meshes and consequently leading to the failure of the deformation algorithm.
Deforming a generic mesh smoothly to a data scan can be formulated as an optimization problem. Figure 1. 3D anthropometric data processing framework
Here, the variables we need to solve are the x, y, and z coordinates of the generic model. The initial solution can be simply the generic model. Given an intermediate solution, the cost function is defined by estimating the difference between the solution and the target data model. This includes three kinds of errors: (1) the landmark error, which accounts for the sum of the distances between the known corresponding landmarks; (2) the smoothness error, which quantifies the local smoothness at every mesh point; and (3) the data error, which measures the sum of the distances between every pair of corresponding points.
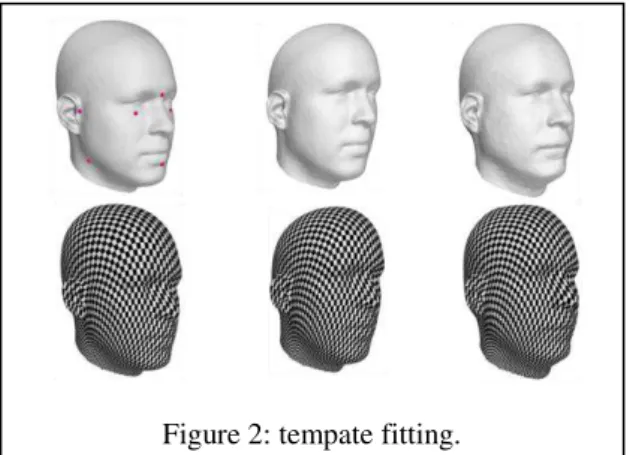
Figure 2 shows examples of fitting a generic model (left column) to two different data scans (middle and right columns). The texture mapped figures show that while the parameterized models have different shapes, they have the same structure.
2.2. Landmark locating
In the CAESAR dataset, each scan contains 73 anthropometric landmarks. Placing these landmarks on the subjects involves palpating the subjects and requires special skills. The accuracy of the position varies between different operators. Furthermore, not all of the datasets have landmarks, and in the future, it is unlikely that a lot of 3-D anthropometry surveys will have landmarks data.
Dekker et al. (2001) attempted to locate the landmarks automatically. They define a set of rules for each landmark based on its local surface properties, such as curvature or distances to certain feature points. Then locating the landmarks becomes a classification problem. The problem of this approach is that the rules are based on intuitive observations. Because of the variations among humans, there are always exceptions and therefore the number of the rules quickly becomes too large to handle. More principled ways of specifying the landmarks are necessary.
Ben Azouz et al. (2006) introduced an approach that is based on statistical learning. They used a subset of the CAESAR dataset as a training set. A graphical probabilistic model is used to model the positions of the landmarks. A node of the graph represents a landmark and an edge of the graph represents the relationship between a pair of neighboring landmarks. Figure 3 shows the graph of the landmarks. The probability of a surface point to be a particular landmark depends on the local surface properties as well as its relationships with other landmarks. These constraints are naturally modeled by Markov Random Field (MRF) or Markov network. In the training stage, the distributions of surface geometric properties such as the SPIN image (Johnson 1997), and the relative positions of landmarks are computed. In the subsequent matching stage, landmarks are located by identifying the surface points that maximizes the joint probability defined by the Markov network. The probability of placing a landmark at a particular position depends on two types of information. One is the local surface property of that landmark. Another is the relationship to its neighboring landmarks. We use Euclidean distance to measure this relationship. Both kinds of the probability distributions can be learned from the training data. We may also use geodesic distance. But since the landmarks are usually placed on the joints, the geodesic distance is usually proportional to the Euclidean distance.
The probability optimization problem has a prohibitively large search space; exact computation is infeasible. An approximate method, called belief
propagation, is used to solve this problem. Belief
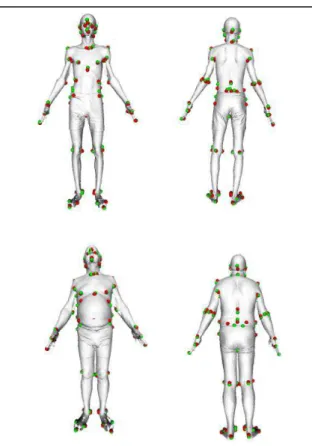
propagation is an efficient technique for solving large probabilistic optimization problem. When the graph has no loops, that is, when it is a tree, the solution is exact. When the graph has loops, we can only have an approximate solution. Our landmark graph contains loops. But in practice it works well. Figure 4 shows the results of the predicted landmarks. On average, the algorithm predicts the landmark locations within 2.0 cm of the experts’ Figure 2: tempate fitting.
4 locations. Note that these landmarks are used for
guiding the template fitting; they are not accurate enough for dimensional measurements.
3. Statistical Shape Analysis
Having established the correspondence among all of the models, we can perform statistical shape analysis. At this point, we have a set of parameterized models, each has the same number of points and the same mesh topology. The variables on which we perform statistics are the coordinates of the vertices on the meshes. In general, the models may live in different coordinate frames. Procrustes alignment can be used to transform them into a single coordinate frame.
Principal Component Analysis (PCA) is the most often used statistical technique for understanding high-dimensional data. To perform PCA, a shape vector is formed for each model by concatenating all of the coordinates of the model and the mean vector and the covariance matrix are computed. The eigenvectors of the covariance matrix form a basis of the shape space. This eigen analysis transforms the data into a new coordinate system in which the modes of variations are ordered from large to small. The absolute values of the eigenvalues determine the significance of the corresponding variations
describing the shape variability by using a small number of parameters.
4. Data Exploration
One of the advantages of statistical shape analysis is that it provides an intuitive visualization of the shape variation. Since we use a dense point set on the surface to perform PCA, each principal component can be visualized by an animation produced by varying the parameter of the component. Figure 5 shows the first 2 components.
As the models are parameterized by a generic model, analysis can be performed on segments of the body such as the head, torso, arms and legs (Xi et al. 2007).
Designers are intrinsically visual people. A statistical model of the shape space allows us to build intuitive visualization tools for understanding the shape variability of a dataset. Using computer animation techniques, we are able to interactively manipulate the coefficients of the PCA components and see shape changes continuously along those components. A demonstration version of a software, called Procrustica, can be downloaded from www.humanshape.net.
It is interesting to note that the human eyes are extremely sensitive to moving elements in the display. Therefore animation is a powerful tool for exploring shape varation.
5. Conclusions
Processing 3D anthropometry data requires Figure 4: Results of automatic landmark
locating. The green dots indicate the predicted locations and the red dots are the landmarks placed by the operators.
special techniques in geometry processing. We have drawn tools from computer vision, computer graphics, and machine learning to solve the problem of correspondence. Statistical shape analysis reveals patterns of changes in the human shape. The detailed and intuitive visualization gives designers a powerful tool for making decisions. At the same time, these new tools also pose challenges. The PCA components do not always correspond to everyday measurements of shape changes. Effective use of them remains a research problem.
A more challenging problem is analyzing human shapes in different postures. This allows the study of the human shape in dynamic environments. Again, the essential problem is establishing a correspondence among the models. Several authors have made some initial progresses in this area (Wuhrer et al. 2007, 2011; Anguelov et al. 2005; Bronstein et al. 2007). However, much research remains to be done to find more robust and efficient algorithms.
References
Amberg B, Romdhani S, Vetter T. Optimal Step Nonrigid ICP Algorithms for Surface Registration, IEEE Conference on Computer Vision and Pattern Recognition (CVPR 2007), 2007.
Allen B, Curless B, Popovic Z., The space of human body shapes: reconstruction and parameterization from range scans, ACM Transactions on Graphics (SIGGRAPH’03), 22(3):587-594, 2003.
Anguelov D, Srinvasan P, Koller D, Thrun S, Rodgers J, Davis J. “SCAPE: shape completion and animation of people.” ACM Trans. Graph., 24(3):408-416, 2005.
Ben Azouz Z, Shu C, Mantel A. Automatic Locating of Anthropometric Landmarks on 3D Human Models, Third International Symposium on 3D Data Processing, Visualization and Transmission (3DPVT 2006). Chapel Hill, North Carolina, USA. June 13-16, 2006
Ben Azouz Z, Rioux M, Shu C, Lepage R, Characterizing Human Shape Variation Using 3-D Anthropometric Data, Visual Computer, vol. 22, pp. 302-314, 2006.
Bronstein A, Bronstein M, Kimmel R. Calculus of non-rigid surface for geometry and texture manipulation. IEEE Transactions on Visualization and Computer Graphics, 13(5):902-913, 2007. Bookstein F, Morphometric tools for landmark data: Geometry and biology, Cambridge University Press, 1991.
Dekker L, Douros I, Buxton B, Treleaven P. Building symbolic information for 3D human body modeling from range data, Proceedings of the third International Conference on 3-D Digital imaging and Modeling (3DIM’99), pp. 292-298. May 2001. Dryden I, Mardia K, Statistical Shape Analysis, Wiley, 1998.
Johnson A. SPIN-Images: A Representation for 3-D Surface matching. PhD thesis, Robotics Institute, Carnegie Mellon University, Pittsburgh, PA, August 1997.
Kendall D. Shape-manifolds, procrustean metrics and complex projective space, Bulletin of the London Mathematical Society, 16:81 – 121, 1984. Kendall D. A survey of the statistical theory of shape, Statistical Science 4:87 – 120, 1989.
Mochimaru M, Kouchi M, Dohi M, Analysis of 3D human foot forms using the FFD method and its application in grading shoe last, Ergonomics, vol. 43, pp. 1301-1313, 2000.
Mochimaru M, Kouchi M. Statistics for 3D human body forms, SAE Digital Human Modeling for Design and Engineering, Dearborn, MI, 2000. Robinette K, Daanen H. The CAESAR Project: A 3-D Surface Anthropometry Survey, International Conference on 3-D Digital Imaging and Modeling (3DIM 1997), 262-265, 1997.
Wuhrer S, Shu C, Ben Azouz Z, Bose P, Posture Invariant Correspondence of Incomplete Triangular Manifolds, International Journal of Shape Modeling, 13(2):139-157, 2007.
Wuhrer S, Ben Azouz Z, Shu C. Posture Invariant Description and Feature Extraction, IEEE Conference on Computer Vision and Pattern Recognition (CVPR 2010), 2010.
Wuhrer S, Shu, C, Xi P. Landmark-free Posture Invariant Human Shape Correspondence, in press, The Visual Computer, 2011.
Xi P, Lee W, Shu C, Analysis of Segmented Human Body Scans, Proceedings of the Graphic Interface 2007 Conference. Montréal, Québec, Canada. May 28-30, 2007.
Yeh I, Lin C, Sorkine O, Lee T. Template-based 3D Model Fitting Using Dual-Domain Relaxation, IEEE Transactions on Visualization and Computer Graphics, in press, 2011.
Zelditch M, Swiderski D, Sheets D, Fink W. Geometric Morphometrics for Biologists: A Primer, Elsevier, 2004.