Publisher’s version / Version de l'éditeur:
Journal of the Association of Asphalt Paving Technologists, 77, pp. 827-850, 2010-03-01
READ THESE TERMS AND CONDITIONS CAREFULLY BEFORE USING THIS WEBSITE.
https://nrc-publications.canada.ca/eng/copyright
Vous avez des questions? Nous pouvons vous aider. Pour communiquer directement avec un auteur, consultez la première page de la revue dans laquelle son article a été publié afin de trouver ses coordonnées. Si vous n’arrivez pas à les repérer, communiquez avec nous à PublicationsArchive-ArchivesPublications@nrc-cnrc.gc.ca.
Questions? Contact the NRC Publications Archive team at
PublicationsArchive-ArchivesPublications@nrc-cnrc.gc.ca. If you wish to email the authors directly, please see the first page of the publication for their contact information.
This publication could be one of several versions: author’s original, accepted manuscript or the publisher’s version. / La version de cette publication peut être l’une des suivantes : la version prépublication de l’auteur, la version acceptée du manuscrit ou la version de l’éditeur.
Access and use of this website and the material on it are subject to the Terms and Conditions set forth at Interfacial fracture energy: an indicator of the adhesion of bituminous materials
Fini, E. H.; Al-Qadi, I. L.; Masson, J-F.
https://publications-cnrc.canada.ca/fra/droits
L’accès à ce site Web et l’utilisation de son contenu sont assujettis aux conditions présentées dans le site LISEZ CES CONDITIONS ATTENTIVEMENT AVANT D’UTILISER CE SITE WEB.
NRC Publications Record / Notice d'Archives des publications de CNRC:
https://nrc-publications.canada.ca/eng/view/object/?id=732a0553-0c7a-4c7c-b1bf-239fcf0e5a27 https://publications-cnrc.canada.ca/fra/voir/objet/?id=732a0553-0c7a-4c7c-b1bf-239fcf0e5a27
I nt e rfa c ia l fra c t ure e ne rgy: a n indic a t or of t he a dhe sion of bit um inous m a t e ria ls
N R C C - 5 0 0 8 5
F i n i , E . H . ; A l - Q a d i , I . L . ; M a s s o n , J - F .
M a r c h 2 0 1 0
A version of this document is published in / Une version de ce document se trouve dans:
Journal of the Association of Asphalt Paving Technologists, 77, pp. 827-850, March
01, 2010
The material in this document is covered by the provisions of the Copyright Act, by Canadian laws, policies, regulations and international agreements. Such provisions serve to identify the information source and, in specific instances, to prohibit reproduction of materials without written permission. For more information visit http://laws.justice.gc.ca/en/showtdm/cs/C-42
Les renseignements dans ce document sont protégés par la Loi sur le droit d'auteur, par les lois, les politiques et les règlements du Canada et des accords internationaux. Ces dispositions permettent d'identifier la source de l'information et, dans certains cas, d'interdire la copie de documents sans permission écrite. Pour obtenir de plus amples renseignements : http://lois.justice.gc.ca/fr/showtdm/cs/C-42
E. H. Fini1, I. L. Al-Qadi2, J-F. Masson3, and K. K. McGhee4
Abstract
This paper demonstrates that the pressurized blister test can be an effective method to predict binder-aggregate bonding. Recently, the blister test has been introduced as a reliable approach to predict the bonding between bituminous sealant and aggregate. Since this test measures a geometry-independent parameter that is an inherent property of the interface, the test can be applied to any bituminous material, from the softest bituminous crack sealant to the most brittle binder. With very brittle material, cohesive failure becomes a concern. Such a failure can be easily prevented by an increase in the thickness of the adhesive specimen. However, an increase in specimen thickness also gives rise to shear forces that cannot be neglected in the analysis. Utilizing theoretical and experimental analyses, this paper presents the effect of shear forces on the interfacial fracture energy (IFE) of adhesive bituminous materials. The effect of shear forces on blister deflection is shown as a function of material thickness. In addition, the dependence of IFE of bituminous materials on temperature and rate of loading was investigated through laboratory testing. An optimum temperature and loading rate can be identified for each material where IFE is
1
Graduate Research Assistant, Advanced Transportation Research and Engineering Laboratory, Department of Civil and Environmental Engineering, University of Illinois at Urbana-Champaign, Urbana, IL 61801.
2
Founder Professor of Engineering, Illinois Center for Transportation, Director, Department of Civil and Environmental Engineering, University of Illinois at Urbana-Champaign, Urbana, IL 61801.
3
Senior Research Officer, Institute for Research in Construction, National Research Council of Canada, Ottawa, ON, K1A 0R6.
4
Senior Research Scientist, Virginia Transportation Research Council, Charlottesville, VA, 22903.
optimized. This may help select appropriate binder/sealant - aggregate pairs for improved performance under defined environmental conditions.
Key Words: Pressurized blister test, interfacial fracture energy (IFE), shear force, sealants
Introduction
Since a substantial amount of taxpayers’ money goes toward construction and maintenance of flexible pavements, ensuring the adequacy and effectiveness of construction and maintenance activities is essential. Bituminous materials are mainly used for their adhesion and durability. They are used to bond aggregates together in hot-mix asphalt for construction, maintenance and repair, and to seal cracks and joints to prevent the ingress of water and debris into the structure. While there are extensive rheological studies on the cohesive properties of bituminous materials, their adhesive properties have not been researched as well. In order to ensure desirable performance, a bituminous material first needs to adhere to a given aggregate and not only provide a strong bond that resists thermal and traffic loading but remain intact in the presence of water and endure its driven forces. Therefore, a compatible bituminous material that adheres strongly to the aggregate and shows rheological properties suitable to a specific climate should be selected (1-4). After selecting the appropriate material, one needs to ensure its proper installation (5-7).
Despite the recognized importance of adhesion of binders or sealants onto aggregates, several field observations reported stripping from aggregate and premature sealant adhesive failure (8-11). Although, the adhesion or bond strength of bituminous material to aggregate has been investigated by several researchers (11-15), most developed evaluation approaches are qualitative. Consequently, bond characteristics are not well defined. While much has been done to help predict the adhesion (10, 11) between bituminous materials and aggregates and foresee the effect of
water exposure on the bitumen–aggregate interface (12-14), the effect of temperature and loading rate on the adhesion properties has been overlooked.
As the rheological properties of binder and bituminous sealant vary widely, a test method that can characterize the bond between any pair of bituminous material and aggregate would be valuable to researchers, contractors, industry, and agencies interested in bituminous materials. Ideally, such a test would evaluate compatibility and endurance to thermal and mechanical stresses between aggregate and bituminous material pairs. It would also allow for evaluating the effect of aggregate
composition, aging, weathering, water exposure, and curing on bond performance.
In an attempt to provide a mechanistic adhesion test that has the aforementioned capabilities, a pressurized blister test was developed and used specifically for hot-poured bituminous sealant (16). The test can be applied to any bituminous material as this test measures a geometry-independent inherent property of the
interface. This study demonstrates that the blister test may be used for bituminous binders and sealants alike, and that interface bonding, as assessed from interfacial fracture energy (IFE), can be measured at various temperatures. In addition, a time-temperature superposition highlights the contributions of bulk viscoelasticity and interfacial adhesion to interface bonding.
Experimental Method
Three binders (PG 64-22, PG 58-28, and PG 70-22) and three sealants (NN, LL and UU), which are widely used in North Eastern States and provinces were tested in the blister test. Binders were tested at 5 and 10 °C, while sealants were tested at their low service temperatures of –10°C to –34 °C.
In this test, a servo-hydraulic pump displaces a piston at a constant rate. The upward movement of the piston injects a liquid medium (alcohol) at a constant rate of 0.1 L/hr through a channel that is connected to the specimen (Figure 1-a). The specimen is composed of an annular (donut-shaped) substrate plate (aggregate
or a standard material) covered with binder or sealant on one side. Alcohol pushes the adhesive (binder or sealant) a way from the substrate creating a blister which continues to grow until the adhesive separates from the substrate. The blister height and the applied pressure are recorded during the test and they are used to calculate the IFE, Figure 2, as detailed elsewhere (16). In a
simplified form, IFE can be calculated as half of the product of the maximum pressure and the corresponding blister height.
In addition to IFE, adhesive modulus can be determined from this test using the test data prior to debonding. It was assumed earlier that debonding did not occur before critical pressure was reached (16); however, this may not always be the case (17, 18). In order to ascertain that no premature debonding occurs while determining adhesive modulus, an annular disk with the same inner diameter as the substrate was clamped on top of the adhesive to confine it (Figure 1-b).
In this study, the substrate was an annular disk of
aluminum, with inner and outer diameters of 25 mm and 125 mm, respectively, and a thickness of 6.25 mm. Fini et al. (16) suggested the use of aluminum as a replacement for aggregate. Because of its compatibility with sealant, low diffusion, comparable pore size with those of aggregate, high resistance to both very high and very low temperatures, and availability, aluminum is an appropriate replacement for aggregate in this test. It also has a coefficient of thermal expansion/contraction similar to that of aggregates and its roughness can be controlled by applying various surface finishes. In this study a 63 nm finish is used for consistency and to improve test repeatability.
During specimen preparation, the inner hole (orifice) of the substrate is sealed with a close-fitted aluminum plug that flushes with the substrate surface (Figure 3). Even though the plug is closely fitted in the orifice, very low viscosity binders or sealants can enter the tiny clearance between the plug and the orifice edge, causing inconsistent test results. To address this problem, and to create a debonding area that represents an initial crack at the interface between adhesive and substrate, a 0.09-mm-thick and 27-mm-diameter disc shape transparent fluoropolymer (FEP) film is cut and placed on top of the plug. To align the film with the center of the plug, a small pin is pointed on the center of the film and the
plug is placed on the pin; each plug has a center hole to let the pin pass through. LVDT Aluminum Disk Adhesive Alcohol Piston movement Piston (a) LVDT Aluminum Disk Adhesive (b)
Figure 1. Blister Test Apparatus (a) without Confining Ring; and (b) with Confining Ring (b)
After placing the film, a silicon-based release agent is sprayed on top of the film so that the film does not stick to the binder or sealant cast on the plug. Because the film has an
Piston movement Alcohol
Piston
adhesive backing, it sticks to the plug. The film and plug are removed from the specimen prior to testing (Figure 3).
0 50 100 150 200 250 0 0.5 1 1.5 2 2.5 3 3 Blister Height (mm) Pr e s su re ( k Pa ) .5 pc
Figure 2. Typical Blister Test Results
(a) (b) (c) (d) (e) (f) (g) (h)
Figure 3. Procedures for Specimen Preparation on an Aluminum Substrate: (a) Attaching the Transparent Film to the Plug; (b) Assembling the Plug in the Substare; (c) Assembling the Molds and Holding Them with a Rubber
Band; (d) Pouring Adhesive onto the Substrate; (e) Trimming Extra Adhesive; (f) Removing the Plug and Adhesive Film; (g) Assembling the LVDT and Running the Test; (h) Specimen after Debonding
The above preparation substantially improves the test repeatability. The thin film not only covers the tiny gap between the plug and the annular disk, it also creates an initial debonded area that creates an interfacial crack. The result is a more stable debonding process.
To liquefy and pour the materials, they were heated, stirred thoroughly, and then poured onto the substrate (Figure 3). No press-cutter was used during the sample preparation because of its excessive shearing (16). Instead, a four-piece mold was assembled directly on top of the substrate and the four pieces are held together with a rubber band (Figure 4-a).
Asphalt binders are more brittle than most sealants at low temperatures. Consequently, thin film binder may fail cohesively in a blister test (13). To adapt this test for binders, or brittle sealants, and ensure adhesive failure, binders are cast at 4.7-mm-thick instead of the 2.35-mm-4.7-mm-thick for soft sealants (16). To cast 4.7-mm-thick adhesives, two molds are stacked; molds are fabricated to allow being stacked to prepare thick specimens (Figure 4-b). In addition to bending stresses, the increase in binder thickness increases the shear stresses during testing. This effect is addressed in the paper.
(a)
(b)
Figure 4. Assembling First Layer (a), Second layer (b) of Stackable Mold to Cast Adhesive with Double Thickness
After pouring the adhesive in the appropriate mold, the specimen is set at room temperature for 1 hr. Excessive material is trimmed away with a heated putty knife, and the sample is placed in a cooling bath. After 15 min, specimens are demolded and returned to the bath for another 20 min prior to testing.
During testing, pressure and blister height increase until a critical pressure (pc) is reached, at which point debonding begins (Figure 2). During the debonding period, the pressure decreases while the blister continues to grow both horizontally and vertically. Pressure and deflection are recorded until pressure drops to 50% of the peak pressure. The peak pressure and the corresponding blister height are used to calculate the IFE that relates to the bond strength (16). Once the test is complete, the surface of the substrate should be examined to evaluate the failure type. In the case of non adhesive failure and/or internal breakage, test results would be discarded.
Fracture Mechanics
Poor bonding can lead to interfacial cracks, or
delamination. Fracture mechanics can be used to characterize the resistance to failure and to predict durability and performance of a bond. Interfacial fractures occur when a pre-existing flaw or crack propagates upon the application of a critical load (17-19). Fracture mechanics relates this critical load to the interfacial fracture energy (IFE), which is an inherent property of the interface (17, 21). Methods to measure the IFE include blister, indentation, scratch, and peel tests (19-21).
The blister test was selected in this study because it allows for the application of a load under variable environmental
conditions. In addition, the pressure and blister height (Figure 2) allow the calculation of the geometry-independent interfacial fracture energy (IFE) (16). In this test, cohesive failure is prevented by increasing the binder thickness.
To study bond susceptibility to water, water could replace the ethanol as the liquid medium; this would allow continuous
water exposure, both before and during testing. As the crack tip evolves during testing, newly developed surfaces would be exposed to water. Hence, this approach can provide a reasonable field simulation of moisture damage when compared to existing methods (12-14). In addition, water exposure time and effects of salt and acid/alkaline environment can be controlled in the test.
Blister test results are independent of specimen thickness (16). However, the extent of shear stress during specimen film deformation depends on the film thickness. As the film thickness increases, the shear stress increases. For thin films, the shear forces may be neglected (16-18). However, in this study, the specimen is relatively thick. Hence, the effect of the shear forces must be taken into account.
Bending and Shear Stresses
To calculate the IFE from the testing results (Figure 2), the mode of deformation must be properly defined. Depending on the adhesive thickness and radius of the orifice, three deformation modes can be recognized in the blister test. Each requires a different analysis:
• The orifice is much larger than the adhesive thickness. In this case bending and membrane forces are dominant (17, 18, 22).
• The orifice is much smaller than the adhesive thickness. In this case, shear stresses and the stresses concentrated around the orifice are dominant. A fully 3-D state of stress is developed in the adhesive (23).
• Between the above two cases, both bending and shear forces in the adhesive film need to be considered (20, 24-26). Membrane forces, on the other hand, may be negligible depending on the magnitude of deformation. When the orifice radius is over ten times the film thickness, the classical plate theory for thin films relates pressure and deflection.
For small deformation and built-in boundary condition this relation is presented in Equation 1 (22, 27). 2 2 2 3 2 4
)
1
(
16
)
1
(
3
)
(
a
r
Eh
v
pa
r
d
=
−
−
(1)where d(r) is the adhesive deformation at a distance r from the center of the circular film, p is the pressure inside the blister, a is the radius of the orifice, v is the Poisson ratio, E is the sealant modulus, and h is the film thickness.
Equation 1 for pure bending is satisfactory for thin films. However, in cases of thick films such as those investigated here, shear forces become important. In this case, equation 1 must be expanded by means of the Mindlin first order shear deformable theory (FSDT), as presented in Equation 2 (27-28).
)
1
(
5
)
1
(
3
)
1
(
16
)
1
(
3
)
(
2 2 2 2 2 2 3 2 4a
r
Eh
v
pa
a
r
Eh
v
pa
r
d
=
−
−
+
+
−
(2)The second term of this equation accounts for the shear deformation of a thick film under axis-symmetric uniform pressure (28). Deformation with and without shear stress was modeled utilizing a finite element (FE) code written in MATLAB. Two degrees of freedom per node and Hermitian shape functions were used to calculate the stiffness matrix and load vector (27). Figure 5 presents the normalized center deformation,d, versus a/h (radius of the orifice divided by thickness of the adhesive).
4 3 0 pa Eh d d = (3) 2 2 2 5 ) 1 ( 3 16 ) 1 ( 3 a h v v d = − + + (4)
where d is the normalized center deformation; andd is the blister 0
In this study, the radius of the orifice is 12.5 mm, and the thickness of the adhesive is 4.7 mm, so a/h is 2.7. In the absence of shear, the classical plate theory (CPT) predicts a deformation independent of a/h. In contrast, the first order shear deformable theory (FSDT) indicates a rapid increase in deformation as a/h decreases. Consequently, the neglect of shear effect leads to an underestimation of adhesive deformation. The error increases significantly as the value of a/h decreases.
0.0 0.1 0.2 0.3 0.4 0.5 0.6 0.7 0.8 0 5 10 15 20 25 a/h No rm a lized Dis p la ce m n e t FE-With shear (FSDT) FE-Without shear (CPT)
Figure 5. Normalized Displacement in the Center, d, versus Radius Divided by Thickness (a/h)
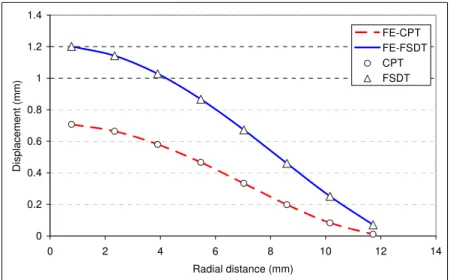
0 0.2 0.4 0.6 0.8 1 1.2 1.4 0 2 4 6 8 10 12 Radial distance (mm) Disp lacem ent (m m) 14 FE-CPT FE-FSDT CPT FSDT
Figure 6. Displacement versus Radial Distance for both Analytical and Numerical Solutions
The numerical FE solutions for both CPT and FSDT are compared with the analytical Equations 1 and 2 (Figure 6). Good agreement is observed between the analytical and numerical approaches. Hence, the model may be used to incorporate the effect of adhesive viscoelastic behavior.
Interfacial Fracture Energy
The extent of specimen deformation is governed by the balance between the strain energy stored in the film and the potential energy provided by the external pressure (29). In his pioneering work, Griffith provided an analytical solution for the critical pressure when debonding occurs (29). He showed that the adhered surfaces have surface tension and that crack propagates to minimize the overall energy of the system. This is done by a conversion of the strain energy in the film to potential energy.
Interfacial crack propagation arises from two superimposed stress fields. One is due to specimen deformation while the other is from the stress concentration around the orifice. When the specimen is infinitely thick (h→∞ ), the first source approaches
zero because the plate is too thick to bend or deform. The IFE is then related to the potential energy around the orifice. For intermediate cases both sources of energy are involved.
Accounting for both energy sources, IFE can be calculated using Equation 5; in which the three terms count for bending, shear and stress concentration around the orifice, respectively:
]
)
1
(
2
10
)
1
(
3
32
)
1
(
3
[
)
(
2 3 2 3 2π
v
h
v
a
h
v
a
t
E
a
p
IFE
=
c−
+
+
+
−
(5)The dependency of the IFE at the critical pressure on specimen geometry (h/a) is shown in Figure 7. The unitless f(h,a) is
IFE/[pc2a/E(t)]. The limiting analytical cases for a thick and a thin specimen serve as the two asymptotes in Figure 7; Equation 5 provide practical solutions between the two limits. Therefore, Equation 5 will be used to calculate IFE for binders and sealants.
0 0.2 0.4 0.6 0.8 1 1.2 1.4 1.6 1.8 2 0 5 10 15 (h/a) f (h ,a ) 20 Very thin adhesive Medium thickness Very thick adhesive Medium thickness Thin Thick
Experimental Results
Figure 8 shows the typical variation of pressure with blister height during confined tests at two temperatures. As pressure increases, the blister height does as well. This height is greater at warmer temperatures and at the same pressure. Bituminous materials are viscoelastic; hence, the pressure-deformation relationship is not linear. Pressure increases rapidly at first due to the elastic response of the material and slower as the slope decreases due to a delayed elastic deformation. Hence, it is not surprising that the evolution of the pressure under the blister can be related to modulus as presented in Equation 6 (21, 31):
]
7
.
1
)
1
(
3
.
5
)
1
(
[
)
(
)
(
)
(
2 3 4 2h
a
v
h
a
v
t
d
t
p
t
E
=
−
+
+
(6) 0 20 40 60 0 0.1 0.2 0.3 0.4 0.5 0.6 0.7 0.8 0.9 Blister Height (mm) Pr essure (kPa) 10 ºC 5 ºC 5ºC 10ºCFigure 8. Variation of Pressure-Blister Height during Confined Bulging Test of a PG 70-22 Binder at Two Temperatures
Figure 9 shows the modulus E(t) calculated using Equation 6. Pressure p(t) and blister height d(t) were recorded as functions of time (Figure 8). The fluid pressure rate is constant at 0.1 L/h; h, is
4.7mm; a, is 12.5mm; and v is 0.35. The moduli at the critical pressure for various binders and sealants at two temperatures are reported in Table 1. As expected, the PG58-28 showed the lowest modulus amongst the binders at any test temperature. With the exception of sealant LL, all bituminous materials showed an increase in their modulus as the materials were cooled.
Table 1. Modulus of Adhesive Film (MPa ) Measured at the Peak Pressure
Sealant Temperature (ºC) 10 5 -4 -10 -16 -22 -28 -34 NN 0.54 0.86 LL 0.45 0.42 UU 0.91 1.21 PG 58-28 0.01 0.02 0.66 PG 64-22 0.56 5.92 PG 70-22 0.56 3.62 0.1 1 10 100 0 5 10 15 20 25 Time (s) E( t), MPa 5 ºC 10 ºC 5ºC 10ºC
Figure 9. Adhesive Modulus Using Confined Blister Test at Two Temperatures (5 ºC and 10 ºC)
From the modulus values in Table 1, the interfacial fracture energy (IFE), which is an indication of bond strength (16), was calculated using Equation 5. The results are presented in Figures 10 and 11. The IFE of the softest materials (sealants LL and NN) is much higher than that of the stiffer materials. This is possibly due to the greater viscoelastic bulk deformation. As temperature decreases, IFE is decreased for soft sealants, which is most likely related to a reduced deformation. In contrast, the stiffest sealant and the binders showed an increase in IFE with temperature reduction.
To better define the relationship between load rate and IFE, the time-temperature dependence of cohesive fracture was adapted for the adhesive failure of interest here (32). For this purpose, sealant UU was tested at –4ºC to –34ºC using three loading rates: 0.1, 0.6 and 1 mm/s. The William-Landel-Ferry WLF shift factor was calculated (17) from equation (7):
) ( 6 . 51 / ) ( 4 . 17 g g T T T T T Loga = − + − (7)
where aT is a shift factor, T is the test temperature; Tg is the glass transition temperature of the bituminous material. The Tg of the adhesive was measured, using Differential Scanning Calorimetry (DSC) (11). 0 200 400 600 800 1000 -10 -16 -22 -28 -34 Temperature (ºC) IF E (J /m 2) NN LL UU
Figure 10. IFE at Peak Pressure for Aluminum Substrate and Bituminous Sealants
Figure 11. IFE at Peak Pressure for Aluminum Substrate and Binders 0 20 40 60 80 100 120 140 10 5 -4 -10 Temperature (ºC) IF E ( J /m 2 ) PG 58-28 PG 64-22 PG 70-22
Using the Tg value for the UU bituminous sealant (Tg =-30ºC), the shift factors were calculated at each temperature (Equation 7). The shift factors were used to develop master curves for the modulus at critical pressure, Epeak. The modulus is plotted versus the logarithm of reduced rates, aT, multiplied by loading rates, R, (Figure 12). It is evident that the adhesive modulus increases with loading rate; regardless of the material’s stage (glassy or rubbery).
y = 2.65e0.21x R2 = 0.95 0 2 4 6 8 10 12 -8 -6 -4 -2 0 2 4 6 8 Log (RaT) E peak , k P a
Figure 12. Modulus at Peak Pressure versus Reduced Rate for Sealant UU Adhered to Aluminum Substrate
In addition, an IFE master curve was developed against the logarithm of reduced rates, aT, multiplied by loading rates, R (Figure 13). Higher rates result in greater IFE up to certain rates; beyond which, as the loading rate increases, the IFE decreases. This change in pattern is attributed to the material transition from the rubbery stage to the glassy status. This finding supports the concept that interface bonding is affected by the coupling effect of bulk material and interface. While at relatively low equivalent loading rates (rubbery stage), the bulk characteristics greatly contribute to the IFE value; at high loading rates (glassy stage), IFE is mainly controlled by the interface property.
Figure 13. IFE versus Reduced Rate for Sealant UU Adhered to Aluminum Substrate R2 = 0.96 R2 = 0.89 0 100 200 300 400 500 600 -10 -5 0 5 10 Log (RaT) IF E,J/m 2 Summary
This paper presents the blister test as an effective test method to predict bituminous-aggregate bonding. Not only does it address the cohesive failure problem observed in previous studies on binder (13); but it also analyzes the blister profile to extract the interfacial fracture energy (IFE) from the test data. In addition, it presents the effect of temperature and loading rate on the adhesive behavior. Finally, it shows that there is an optimum
temperature/loading rate at which the interface bonding is the highest.
Since the binder at low temperature is more brittle than most of the bituminous crack sealants, the specimen was cast at double the proposed thickness (4.7 mm) for crack sealants to prevent cohesive breakage of the adhesive. However, increasing the thickness gives rise to shear forces. Numerical analysis showed that overlooking shear forces can significantly affect the analysis of the blister deformation.
The IFE of three bituminous sealants and three binders were determined at various temperatures/loading rates. It was found that the IFE of the adhesives strongly depends on temperature and loading rate. At the rubbery stage, IFE increases as the loading rate increases. However, at the glassy stage, the IFE decreases with loading rate increase. This study concluded that an optimum IFE can be identified for a range of temperatures and loading rates. Therefore, interfacial bonding of specific bituminous material/aggregate can be predicted under realistic temperatures and loading rates. This approach may also be used for product selection.
Acknowledgments
This research is sponsored by the Federal Highway
Administration’s pooled-fund study TPF5 (045) and the U.S.– Canadian Crack Sealant Consortium. The contribution of the participating states, industry, and provinces is acknowledged. The contents of this paper reflect the view of the authors, who are responsible for the facts and the accuracy of the data presented herein. The contents do not necessarily reflect the official views or policies of the Federal Highway Administration or the consortium members. This paper does not constitute a standard, specification, or regulation.
References
1. I. L. Al-Qadi, A. Loulizi, S. Aref, J.-F. Masson, and K. M. McGhee, “Modification of Bending Beam Rheometer Specimen for Low-Temperature Evaluation of Bituminous Crack Sealants,” Journal of the Transportation Research Record, No. 1933, Transportation Research Board of the National Academies, Washington, DC, 2005, pp. 97–106.
2. I. L. Al-Qadi, E. Fini, M. Elseifi, J.-F. Masson, and K. McGhee, “Development of a Specification for Viscosity Measurements of Hot-Poured Bituminous Sealants,”
Testing and Evaluation Journal, ASTM, 2007, pp. 395-403. 3. J.-F. Masson, P. Collins, J. Margeson, and G. Polomark,
“Analysis of Bituminous Crack Sealant by
Physicochemical Methods,” Transportation Research Record: Journal of the Transportation Research Board, No. 1795, TRB, National Research Council, Washington, D.C., 2002, pp. 33–39.
4. I. L. Al-Qadi, S. Yang, M. Elseifi, J.-F. Masson, and K. McGhee, “Specifications of Bituminous-Based Crack Sealants Using Modified Bending Beam Rheometer,”
Paper No. 061882, 85th Transportation Research Board Annual Meeting, Washington, D.C., 2006.
5. J.-F. Masson, and M. A. Lacasse, “Effect of the Hot-Aired Lance on Crack Sealant Adhesion,” Journal of
Transportation Engineering, Vol. 125, No. 4, 1999, pp. 357–363.
6. L. Zanzotto, “Laboratory Testing of Crack Sealing Materials for Flexible Pavement,” Transportation Association of Canada, Ottawa, ON, 1996.
7. P. Collins, J. F. Masson, and I. L. Al-Qadi, “Cooling Rates in Hot-Poured Bituminous Sealants,” Journal of the
Transportation Research Record, No. 1958, Transportation Research Board of the National Academies, Washington, DC, 2006, pp. 71-73.
8. M. I. Hammons, H, Von Quintus, G. M. Geary, P. Y. Wu, D. M. Jared, “Detection of Stripping in Hot-Mix Asphalt,” Transportation Research Record: Journal of the
Transportation Research Board, No. 1949, 2006, pp. 20–31.
9. Q. Lu, J. T. Harvey, “Long-Term Effectiveness of Antistripping Additives: Laboratory Evaluation,” Transportation Research Record: Journal of the
Transportation Research Board No. 1970, 2006, pp. 14–24. 10. A. Bhasin, E. Masad, D. Little, R. L. Lytton, “Limits on
Adhesive Bond Energy for Improved Resistance of Hot-Mix Asphalt to Moisture Damage,” Transportation Research Record: Journal of the Transportation Research Board No. 1970, 2006, pp. 3–13.
11. J.-F., Masson, and M. A. Lacasse. “A Review of Adhesion Mechanisms at the Crack Sealant Asphalt Concrete
Interface,” In Proceedings of the 3rd International Symposium on Durability of Building and Construction Sealants, A. Wolf, Ed., RILEM, Paris, 2000, pp. 259–274. 12. A., Copeland, N. Kringos, A. Scarpas, and J. Youtcheff,
“Determination of Bond Strength as a Function of Moisture Content at the Aggregate-Mastic Interface,” In Proceedings of 10th Conference of the International Society for Asphalt Pavement (ISAP), August, 2006, Quebec City, Canada.
13. D. A. Anderson, “Binder Characterization and Evaluation,” Vol. 3: Physical Characterization," SHRP-A-369, Strategic Highway Research Program, Washington, D.C., 1994. 14. K. Kanitpong, and H. U. Bahia, “Relating Adhesion and
Cohesion of Asphalts to Effect of Moisture on Asphalt Mixtures' Laboratory Performance,” Transportation Research Record, Journal of the Transportation Research Board, No. 1901, 2005, pp. 33–43.
15. E. Fini, I. L. Al-Qadi, and S. H. Dessouky, “Adhesion of Hot-Poured Crack Sealant to Aggregate,” Paper No. 06-2888, 85th Transportation Research Board Annual Meeting, Washington, D.C. 2006.
16. E. Fini, I. L. Al-Qadi, and J-F. Masson, “A New Blister Test to Measure Bond Strength of Asphaltic Materials,” Association of Asphalt Paving Technology (AAPT) Journal, Vol. 76, 2007, pp. 275–302.
17. L. Lewandowski, “Blister test for adhesion of thin films,” Ph.D. Dissertation, The University of Akron, 1988. 18. Y. Z. Chu, and C. J. Durning, “Application of the Blister
Test to the Study of Polymer-Polymer Adhesion,” Journal of Applied Polymer Science, Vol. 45, 1992, pp. 1151– 1164.
19. K. S. Kim, and J. Kim, “Elasto-Plastic Analysis of the Peel Test for Thin Film Adhesion,” Journal of Engineering Materials and Technology, Transactions of the ASME, Vol. 110, No. 3, 1988, pp. 266–273.
20. K. R. Jiang, and L. S. Penn, “Use of the Blister Test to Study the Adhesion of Brittle Materials: Test Modification and Validation,” Journal of Adhesion, Vol. 32, 1990, pp. 203–216.
21. S. J. Bennett, K. L. Devries, and M. L. Williams,
“Adhesion Fracture Mechanics,” International Journal of Fracture, Vol. 10, No. 1, 1974, pp. 33–43.
22. A. Shirani, and K. L. Liechti, “A Calibrated Fracture Process Zone Model for Thin Film Blistering,”
International Journal of Fracture, Vol. 93, 1998, pp. 281– 314.
23. I. N. Sneddon, “The Distribution of Stress in the
Neighborhood of a Crack in an Elastic Solid,” Proceedings of the Royal Society of London, A 187, 1946, pp. 229. 24. M. Sheplak, and J. Dugundji, “Large Deflections of
Clamped Circular Plates under Initial Tension and Transitions to Membrane Behavior,” ASME Journal of Applied Mechanics, Vol. 65, 1998, pp. 107–115. 25. L. S. Penn, and E. Defex, “Relation between Work of
Adhesion and Work of Fracture for Simple Interfaces,” Journal of Materials Science, Vol. 37, 2002, pp. 505–513. 26. K. T. Wan and S.Ch. Lim. “The bending to stretching
Transition of a Pressurized Blister Test,” International Journal of Fracture, Vol. 92, 1998, pp. 143–147. 27. J. N. Reddy, “Theory and Analysis of Elastic Plates,”
Taylor and Francis, Philadelphia, PA., 1998. 28. C. M. Wang, J. N. Reddy, and K. H. Lee, “Shear
Deformable Beams and Plates,” Amsterdam: Elsevier, 2000.
29. A. A. Griffith, “The Phenomena of Rupture and Flow in Solids,” Philosophical Transactions of the Royal Society of London, Vol. 221, 1921, pp. 163–198.
30. M. L. Williams, “The Continuum Interpretation for Fracture and Adhesion,” Journal of Applied Polymer Science, Vol. 13, 1969, pp. 20–40.
31. N. W. Tschoegl, “The phenomenological theory of linear viscoelastic behavior,” Springer-Verlag, New York, 1989. 32. S. J. Bennett, G. P. Anderson, and M. L. Williams, “The
Time Dependence of Surface Energy in Cohesive Fracture,” Journal of Applied Polymer Science, Vol. 14, 1970, pp. 735–745.