Publisher’s version / Version de l'éditeur:
Vous avez des questions? Nous pouvons vous aider. Pour communiquer directement avec un auteur, consultez
la première page de la revue dans laquelle son article a été publié afin de trouver ses coordonnées. Si vous
Questions? Contact the NRC Publications Archive team at
[email protected]. If you wish to email the authors directly, please see the first page of the publication for their contact information.
https://publications-cnrc.canada.ca/fra/droits
L’accès à ce site Web et l’utilisation de son contenu sont assujettis aux conditions présentées dans le site LISEZ CES CONDITIONS ATTENTIVEMENT AVANT D’UTILISER CE SITE WEB.
7th International Conference and Exhibition on Performance of Ships and
Structures in Ice [Proceedings], 2006
READ THESE TERMS AND CONDITIONS CAREFULLY BEFORE USING THIS WEBSITE.
https://nrc-publications.canada.ca/eng/copyright
NRC Publications Archive Record / Notice des Archives des publications du CNRC :
https://nrc-publications.canada.ca/eng/view/object/?id=30f9ffd8-a839-429f-8221-6db5c596863b
https://publications-cnrc.canada.ca/fra/voir/objet/?id=30f9ffd8-a839-429f-8221-6db5c596863b
NRC Publications Archive
Archives des publications du CNRC
This publication could be one of several versions: author’s original, accepted manuscript or the publisher’s version. / La version de cette publication peut être l’une des suivantes : la version prépublication de l’auteur, la version acceptée du manuscrit ou la version de l’éditeur.
Access and use of this website and the material on it are subject to the Terms and Conditions set forth at
Ship collision with iceberg database
Ship Collision with Iceberg Database
Brian T. Hill
Institute for Ocean Technology – National Research Council Canada
St. John’s, Newfoundland and Labrador, Canada
ABSTRACT
The Iceberg ship collision database, previously available as a text document, has been augmented and enlarged and is now available in Microsoft Access. It now lists some 670 collisions in the northern hemisphere most of which occurred on the Grand Banks. The format and design of the database is briefly described and some results from analyses of the database are presented showing various trends of collisions, scope of damage and environmental factors involved. A probability of collision was derived from the number of cargo ship collisions over the past several years based on an estimate of the number of voyages over the Grand Banks.
KEY WORDS:
Icebergs; ships; collisions; Northern hemisphere, North Atlantic; Grand Banks, AlaskaINTRODUCTION
The Ship Iceberg Collision Database is a Microsoft Access 2000 database that catalogues 200 years of ship iceberg collisions mainly in the North Atlantic. Many of these collisions occurred on or near the Grand Banks of Newfoundland but others occurred further afield; in the Arctic, off Greenland, and in the fjords of Alaska. Collision details have been obtained from a huge variety of sources including shipping gazettes and newspapers and when possible records from official enquiries and reports from the Transportation Board. The collision database was initially conceived during a study of sea ice extents off Newfoundland and has been available as a tabular text document on the Institute for Ocean Technology’s web site for some time and was more recently published by the International Ice Patrol, (IIP), (Hill, 2000), then describing approximately 500 events. The development of the database and some of the trends that it illustrated at that time were described in Hill (2001).
A Microsoft Access template was provided by the Canadian Hydraulic Centre (CHC) which had been developed by them for their Ice Regime Database to describe mostly sea ice – ship interactions (Timco and Morin, 1998). This template was adapted and modified for iceberg collisions and the original data transferred. This information was augmented by further research and where possible, the database includes information about the nature of the damage, the weather and sea state, the ice conditions, iceberg size, the vessel route and location at the time, and vessel characteristics. In addition, photographs of the vessel, vessel damage, and images of charts showing ice conditions are
included. The database now describes over 670 collisions, and the Access version together with an Operations Manual (Hill, 2004), and the original text version of the database, are available on-line at
www.icedata.ca .
The purpose of the database is to catalogue all known events of ships colliding with icebergs with the intent that it will provide operators and regulators with an assessment of the frequency of collisions and environmental factors that played a role at the time of the collision. It will also provide a basis to undertake risk analysis for vessels entering a given area and provide better understanding of conditions under which collisions are likely to occur. This paper will give a brief overview of the database structure and present some examples of results of sample interrogations that are discussed more fully with other examples in Hill (2005).
DATABASE OVERVIEW
Opening and Query Screens
Fig. 1. Ship Iceberg Collision Database opening screen
Export Details; saves the current information into an Excel sheet, useful for further data sorting or analysis, along with the vessel characteristics and source information.
View Reports; allows one to view the information of each incident from the search in a three page formatted form suitable for printing. View images, allows one to view any stored images associated with the events of the current search which may include those of the vessel, damage and ice charts.
View Details, allows one to view all the known details about each event and since this comprises the main part of the database is described separately below.
View Details
Fig. 2. Query Screen
functions and fields are fully described in Hill (2004). The opening screen is shown in Fig. 1 which directs one to the query screen shown in Fig.2. For most part, there are many similarities with the Ice Regime Database and the search capability includes 16 categories including vessel name and type, geographical area, latitude and longitude, damage severity and location, accident scenarios, fatalities, and iceberg shape, size and tonnage. Up to four search categories can be defined and search results can be bookmarked for quick reference. Many of the search categories have several fields associated with them as follows: Vessel Name; 672 vessels to choose from in Version 1.12
Vessel Type; 125 types are listed but typically only a few general types are used such as Fishing Trawler, Bulk Carrier, Tanker, Passenger, etc. Geographical Area; 11 common areas to choose from including Grand Banks, Strait of Belle Isle, Gulf of St. Lawrence, Baffin Bay, Hudson Strait, Alaska and waters off Greenland.
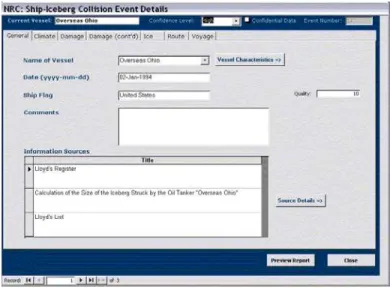
Fig. 3. General Event Screen
Selecting View Details from the Search screen opens the General Event Screen (Fig.3) which displays the basic information of the event as to the vessel name, nationality and date of the collision. Small windows also display a Confidence Level (high or low) and a Quality value between 1 and 10 which are subjective values based on the sources of the data and the amount of information they contain. The titles of the first few sources are given in the window and the full reference can be viewed by first selecting the title then clicking the Source Details button. The vessel particulars as to type, ice class, length, beam, depth, year and place of construction, owner, tonnage, propulsion, power and propellers can be viewed via the Vessel Characteristics button. Information surrounding the collision event itself is accessed by clicking on the various menu labels across the top of the screen and are described briefly in turn below
.
Scenario Description; includes Direct impact, Glancing blow, Grounding on iceberg, Iceberg drifts upon vessel, Striking concealed growler/bergy bit in sea ice, Striking concealed growler/bergy bit in waves, Striking projection, Vessel drifts upon iceberg, Collision with other object (attempting to avoid iceberg).
Damage Location; Bottom, Bow, Bow and tanks, Hull and tanks, Hulls, Machinery, Midship, Propeller, Shoulder, Steering gear, Stern, Unknown dent.
Damage Severity; Abandoned, Cracks, Crushed, Denting, High Measured Stress, Hole, Large hole, Minor deck damage, No damage, Puncture, Sinking, Small puncture.
Damage Name (Code); Appendage, Frame, Hole, Plate, Propulsor, Rudder.
Fatalities; Yes or No.
Iceberg Shape; Blocky, Dome, Dry-docked, Non-Tabular Tabular,
Pinnacle, Wedge, Other Climate
.
The Climate Screen describes visibility in general terms suchas good, reduced or poor, and in nautical miles if known. The obstruction to visibility whether due to fog, precipitation or night is described. Also available are air and water temperatures, wind speed and wave height, and sea state as to whether calm, slight, moderate, rough or ice covered.
Iceberg Size, Bergy bit, Growler, Large, Medium, Small, Very large, Ice island, Multi-year.
Searches are performed by use of the above list or by Boolean arguments where numerical input is required as in searches requiring Dates, Latitude, Longitude and Iceberg tonnage. When the search has been done the number of collisions fitting the search criteria are displayed in the small yellow window and the results are displayed in the window below. A number of options are available from the buttons at the bottom of the image which taken from right to left are described as follows:
Damage. The Damage Screen as seen in Fig. 4 gives an indication if damage occurred, the Scenario Description, Damage Locality, Damage Severity and Code, size of damaged area and distance from waterline, type of steel failure as to brittle, ductile or unknown, the costs of repair and length of downtime, along with brief text summaries of the Cause of Damage, and Description of Damage. Images of the vessel, damage Reset Form; nullifies all the arguments and resets the form ready for
Fig. 5. Interannual variation of iceberg collisions and sea ice extent with a 7 year period moving average.
Fig. 4. Damage Screen peaks and troughs are evident in the plot with a noticeable period of
high rate of collisions, 31 in one year, in the closing decades of the 19th century and the beginning of the next. An obvious correlation would be to compare this with the annual number of icebergs present, but in fact, we only have these numbers available at the moment from 1900 (south of 48°N) though records do exist which may allow future estimations to be made of preceding years. However, we do have a time series of sea ice extent over the Grand Banks for the months January – April from 1810 to 1958 (Hill, 1998) that can be extended to present with Canadian Ice Service data. Marko et al (1994) have shown that there is a degree of correlation between sea ice and icebergs and that indeed the presence of sea ice enhances the survivability of icebergs by protecting them from wave erosion. The smoothed seven year average of this data is also plotted in Fig. 5 and this shows several similarities with that of the collisions, in particular the indication of severe ice years around the turn of the centuries just mentioned and also with a period of heavy ice conditions in the 1850s and a period of some worsening of conditions in recent decades. The steady decline in collisions since about 1913 despite fluctuations of iceberg severity is no doubt due to better iceberg observation programs and detection techniques initiated by the IIP though it is worth noting that though the rate of collisions has decreased, the trend still follows that of ice severity.
and ice charts at the time of collision are viewed in the window at the left and can be stepped through using the side arrows.
Damage (cont’d). The Damage Continued Screen gives additional details regarding the number of persons injured or killed with an indication of the main cause of casualties as to whether by drowning, falling from masts, struck by falling ice, crushed at impact, hypothermia/frostbite (as in exposure in open lifeboats, for example), or illness. There is also an indication if cargo was lost and if there was any resultant pollution or risk of pollution.
Ice . The Ice Screen gives any known information about the iceberg and ice conditions at the time. Details include iceberg size, dimensions, shape, tonnage and IIP number (where applicable) if it had been previously observed. Other pertinent information may be included such as location from nearest known iceberg and observation date, how far the vessel was operating inside the limits of all known ice, how many icebergs had been reported in the immediate area (Grand Banks area only), and what concentration of sea ice was present, if any. Also included is a field to describe the ice information that the captain of the vessel was briefed on; Good Forewarning, Ice Reports Received, Little, or None.
Route. The Route Screen gives the latitude and longitude of the collision and the geographical area in which it occurred and if it was in territorial water. The port of origin and destination is given along with a short description of the cargo and the Captain’s Experience as to High, Medium or Low (rarely known).
Voyage. The final screen, the Voyage Screen, displays the vessel displacement, draft, and speed at collision as well as the service speed. There is also a Voyage Constraint text box for noting any factors which may have had an impact on the voyage or collision.
DATABASE ANALYSIS EXAMPLES
Trends of Collisions with Time in Different Geographic Areas
Fig. 6. Iceberg collisions in Alaska, and the Baffin, Bay, Hudson Strait, Labrador Sea areas.
Probably one of the most interesting and obvious relationships to study in a collision database of this sort is how the number of accidents has changed over time. The bar graph in Fig. 5 shows the annual variation of iceberg collisions on the Grand Banks and Strait of Belle Isle areas for almost 200 years from 1810 to 2004 with a seven year average trend line drawn through to smooth the larger fluctuations. A number of
The amount of ship traffic is much less in other remote areas of the northern hemisphere where icebergs occur and Fig. 6 shows the incidence of iceberg collisions in Alaskan waters and the combined areas of the Labrador Sea, Hudson Strait and Baffin Bay from 1900.
For these areas there are no representative numbers on iceberg populations and if it is assumed that these numbers have been more or less the same over the last 100 years or so then the variation in the number of collisions, though perhaps not statistically significant, is probably due to the fluctuation of ship traffic. Thus the small but steady rate of collisions in Alaskan waters in the early decades of the 20
The sinking of the Titanic with the loss of some 1500 people is the one obvious prominent fatal tragedy but, in fact, represents less than half of the 3422 who have died in iceberg collisions since 1800. This number is probably conservative as scores of others must have perished amongst the icebergs from vessels for which there is no record. On the other hand the numbers include those from ships whose true fates are unknown but are traditionally attributed to loss by icebergs and involved large numbers of fatalities. Such examples are the City of
Glasgow with the loss of 480 in 1854, the Pacific with the loss of approximately 200 persons in 1856, the City of Boston with the loss of 177 in 1870, and the Naronic with the loss of 74 in 1893. Even excepting these, the number of fatalities is large and if one were to include all accidents caused by impact with ice floes, or crushed in the pack, the numbers would probably more than double.
th
century were likely a reflection on the traffic spurred on by the Alaskan and Yukon gold rushes. There is then an apparent absence of collisions for almost 60 years, though this may also be a reflection on accident reporting, until the more modern era of frontier oil development with its resultant increase of tanker traffic, and of more adventurous tourists resulting in an increase in sight-seeing vessels over and above the occasional fishing vessel.
The trend of collisions for the combined areas of Labrador Sea, Hudson Strait and Baffin Bay is slightly different from that in Alaska primarily in that there were few accidents on record prior to the 1930s. From then collisions were fairly rare with only the occasional fishing boat or freighter heading in or out of the new port of Churchill in Hudson Bay (opened 1932), until the more recent decades which have seen a further increase in traffic due to the re-supply of northern settlements and mining communities, and traffic involved in frontier oil and gas research and development, and northern fisheries.
Trend of Collisions with Different Type Vessels
Fig. 8. Collisions with icebergs by decade and known fatalies.
The trend of fatalities by decade along with the number of collisions is shown in the Fig. 8. While the trend of collisions matches ice severity fairly well, it is not obviously so with the number of fatalities and the magnitude of the Titanic disaster is exceptionally large compared with anything before or after. There were eight other known fatalities that decade, six died on fishing schooners and two were crushed in the bow of an ocean liner. Since the Titanic the next collision with a large number of fatalities was the Svend Foyn in 1943 with the loss of 43 souls. The collision was due in part to war conditions when the convoy in which she was a part was routed north close to Greenland to avoid detection by the U-boat packs that had concurrently devastated two convoys further to the south. The next fatality was the Hans Hedtoft, a passenger/cargo ship operating between Denmark and Greenland, and was on the return portion of her maiden voyage when she struck an iceberg in a blinding snow storm off Cape Farewell in January 1959 and went down with all hands for the loss of 95 lives. Just as the sinking of the Titanic was the motivation for the much needed International Ice Patrol for the Grand Banks, so too was the Hans
Hedtoft in the formation of ice reconnaissance off Greenland. The
Hans Hedtoft had seven watertight compartments and a double hull. The Islander, which sank in Alaska in 1901 with the loss of 42 lives, and the Titanic both had watertight compartments and were ships that were proclaimed as being unsinkable. The Hans Hedtoft was the last passenger ship to sink with fatalities after an iceberg collision. The last known ship of any sort to suffer fatalities was the refitted Canadian cargo ship Aigle d’Ocean that sank off Port Burwell, Quebec in 1975 with the loss of 4 crew and 2 helicopter airman trying to effect a rescue. Ice was not seen as a contributing factor in the Canadian Coast Guard report but bergy bits had been seen earlier and in popular opinion remains the cause of the sinking. Curiously, while the Titanic and
Hans Hedtoft were on portions of their maiden voyages, the Aigle
d’Ocean was on its last scheduled trip before being scrapped. Fig. 8 illustrates the large drop in fatalities since the loss of the Titanic.
Fig. 7. Trends of collisions by decade with different types of vessels in the Grand Banks area.
For the Grand Banks plus the adjacent areas of the Gulf of St. Lawrence and the Strait of Belle Isle, Fig. 7 shows the trend of collisions by decade since 1850 for steam and motor vessel types of passenger ships, freighters, tankers, bulk freighters and fishing vessels. The overall trend reflects that of ice conditions as seen in Fig. 5 and it was an unfortunate coincidence that passenger emigration to North America should peak at the time when the ice conditions were at the severest in the historic record, with a resultant high rate of iceberg collisions. The figure illustrates a general decline in passenger ship collisions from then until the 1920s when freighters began to outweigh the passenger ships in casualties. The slight increase in ice severity in recent decades appears to have had its biggest impact on bulk carriers and fishing vessels, the former increasingly commonplace since the Second World War and the latter, which includes shrimp trawlers, that often operate in the lucrative ice strewn waters. Recent events involving passenger ships are typically types of ferries, such as the
William Carson, or tourist ships navigating the ice prone waterways.
Damage Severity and Scenarios
From the database, 26% of all vessels in collision with icebergs have sunk or been abandoned, which includes 35% of all sailing vessels and nearly 20% of all steamships and motor vessels. Table 1 summarizes the damage severity in different types of scenarios for the 371 iceberg collisions involving steam and motor vessels. Unfortunately, about a third of all scenarios are unknown and about a fifth of the damage severities are unknown. The remaining numbers show that the most likely outcome of collision with an iceberg is some kind of holing and the most likely cause of that is some kind of direct impact. However, inthe 18 cases of sinking where the scenario is known, some kind of indirect impact was the main cause. This would include a glancing blow, as in the cases of the Titanic and Hans Hedtoft; striking a growler or bergy bits concealed in waves or pack ice, such as in the case of the
BCM Atlantic which struck a bergy bit on the fore part of the hull; grounding or running up on an underwater ledge of an iceberg thus holing the bottom of the hull; being caught at anchor or in pack ice and having a berg or bergs crush along the beam.
Fig. 9. Damage scenarios for passenger and fishing vessels sunk by icebergs.
Fig. 9 shows the relative percentages of passenger vessels and fishing vessels sunk in the various scenarios. The sample size turns out to be disappointingly small with only nine scenarios in the 29 events being known. One vessel of each type was sunk by direct impact; the passenger ship Islander in Alaska and the fishing vessel Vanguard also in Alaska. In each case the vessel struck at high speed; the wooden hull
Vanguard was split open, the port bow was torn off the Islander The
only other steamship, likely a freighter, to have been sunk by direct impact was the Pera whose hull was cut through to the foremast. Materials and methods of construction obviously change with time so any kind of analysis would have to take this into account.
Table 1. Damage severity in different scenarios.
Dir-ect
Visibility
Visibility is obviously an important factor in any collision. If an iceberg was spotted under clear conditions then, of course, it would be avoided. In the Grand Banks area of the North Atlantic where the cold waters of the Labrador Current meet warmer waters fog is a persistent problem. In many accounts icebergs have not been so much hidden in the fog as to have actually been mistaken, in the misty conditions at the time, for a fog bank or thickening mist, until too late. Of the approximate 370 steam and motor vessel collisions
Fig. 10. Distribution of collisions in known visibility conditions.
descriptions of visibility is known in only 42% of them, and in terms of actual distance only 5%. Figure 10 shows the relative percentages of the various degrees of visibility in which collisions occurred. The events that happened in conditions of good visibility were largely impacts with growlers or bergy bits concealed in fields of ice through which the vessel was navigating. In some of these cases involving large icebergs the damage scenario is unknown while the one that involved the icebreaker Des Groseilliers happened while trying to nudge a berg with her bow away from the vessel she was escorting. There were also a few instances when the visibility was good, in the order of 10 or 25 miles, but in low light which helped obscure low lying bergs, as was the case of the Manchester Commerce which hit at full speed. Almost all of the collisions that occurred in good visibility happened within the last 20 years perhaps indicating better detailing and documentation of accidents, or perhaps indicating higher speeds with less chance to detect and react. There are six records with visibilities in the one to seven nautical mile range, corresponding to the Limited category range, and of these, four became casualties upon striking concealed bergy bits or growlers in waves or pack ice. Of the remaining two, the Canadian Bulker struck a sizeable berg on a clear night and the Knight Bachelor struck a low lying berg in variable misty conditions.
Only 89 of the 370 vessel collisions, less than 25%, have information regarding time of day as to day or night or twilight. The proportions of these are displayed in Figure 11, showing that the majority of the collisions having occurred during the night time hours, a logical circumstance. Mist or fog was present in 87% of the time when visibility was known to be impaired, snow 10% of the time and rain 3%. Almost all the collisions that occurred in daylight happened in foggy or snowy conditions except for one instance of striking a concealed bergy bit, and another one unknown. Night in itself is an
Striking Glanc Concealed in Iceberg drifts Collision with -ing SCENERIO DESCRIP'N To-tal Ground-ing on Unkn-own Im-pact Projecti on DAMAGE SEVERITY Blow waves or pack ice onto vessel other object Sinking 65 3 0 3 5 3 4 0 47 Large Hole 18 8 0 1 1 0 1 0 7 Crushed 60 47 0 6 1 1 0 0 5 Hole 53 27 3 3 6 2 1 1 10 Puncture 26 8 1 5 3 2 0 0 7 Small Puncture 3 0 0 0 0 2 0 0 1 Cracks 16 6 0 3 2 0 1 0 4 Minor Deck Damage 4 1 1 1 0 0 0 0 1 Denting 49 16 3 16 3 4 0 1 6 Abandoned 4 0 0 1 0 0 0 0 3 No Damage 6 1 0 3 0 1 0 0 1 Unknown 67 5 2 14 2 2 1 0 41 TOTAL 371 129 10 56 23 17 8 2 133
Fig. 11. Distribution of collisions in known light conditions.
obstacle to clear vision and almost half of the known night time accidents were unknown as regards further obstructions, but for the majority mist and fog were present. The exceptions include the well known case of the Titanic which struck on a clear starlit but moonless night; the Hurworth in 1880 which collided similarly assuming the looming iceberg was an overhanging cloud in an otherwise clear and starlit night; and the OOCL Challenge which struck a concealed bergy bit in rough seas. Icebergs in night and fog are a serious hazard and are hard to detect visually, increasing the reliance on Radar. Bergy bits and growlers half hidden in breaking seas, or field ice in bad weather, are hard to detect both visually and by Radar. A further complication, as befell the Solborg in 2004, at night in fog on fishing grounds not far from St. John’s was the inability to distinguish the Radar return signal of a small iceberg from those reflected by nearby fishing buoys mounted with Radar reflectors. The CCGS Louis S. St-Laurent also had a peculiar encounter in 2001 when it just scraped by an iceberg at slow speed in Nares Channel. The low iceberg was covered, and thereby weighted down, by a heavy and almost total cover of dark rocks that made the iceberg almost totally invisible in the foggy conditions at the time, nor was it picked up by radar.
Ship Speed and Damage Severity
Fig. 12. Damage severity and speed of collision.
A numeral was assigned to each of the 12 different types of Damage Severity (high measured stress, Numeral 3, was never ascribed) in a perceived order of increasing severity and then plotted as a function of vessel speed in Fig. 12. Of the 370 steam and motor vessels collisions there are only about 70 in which the speed at the time of collision was known and the damage severity is known in only 58 of these. The
trend in the graph is, not surprisingly, one of increasing damage with increasing speed though there is a large amount of scatter and it can be seen that even at relatively low speeds sufficient damage can be sustained to sink the ship. The William Carson went down in 1977 while travelling at about 5 knots in a heavy ice field and presumably hit a piece of multiyear ice or a bergy bit. In 1932, the Bright Fan sank in Hudson Strait after grounding on an underwater ledge of an iceberg at a speed of only 6½ knots. However, the Kronprinz Wilhelm struck a small iceberg a glancing blow at 16 knots scattering 20 tons of ice across the decks and knocking both passengers and berg over, suffering little more than a badly dented bow and some scraped paint. Fishing vessels were excluded from this plot because of their smaller displacement and typical lack of subdivision and for many of these the speeds were unknown. Even in the recent case of the Solborg, which suffered a dented bow and collected a piece of iceberg on deck the exact speed at time of collision is unknown. Cruising or service speeds are known for another 70 or so collisions and approximations of vessel speeds at collision could be made for several of these based on the descriptions at the time of the accident.
Probability of Collision
Since 1980, in a period of 25 years, there have been 57 incidents involving icebergs in all areas of the northern hemisphere giving a rate of 2.3 events per year, or a little over 1.1 for the Grand Banks – Strait of Belle Isle area.
To determine the probability of collision for a ship crossing the Grand Banks the amount of traffic has to be known as well as the number of collisions. As far as is known, there is no accurate assessment of the amount of traffic on the Grand Banks so an estimate had to be derived. Recent annual reports on transportation in Canada by Transport Canada and available on their web site(Transport Canada 2004) have statistics on the amount of cargo loaded and unloaded from different sectors of the world at eastern and western ports, so the annual tonnage exported from eastern Canada to Europe and the tonnage imported from there is known from 1996. Also, known from 1986 is the total tonnage loaded and unloaded in Canadian ports. By comparing these numbers from 1996 the tonnage Europe – Eastern Canada was consistently about 30% so this average was used in determining the Europe – Eastern Canada tonnage from 1986 to 1995 to give a total time series of 18 years data from 1986 to 2003. Assuming half the tonnage was to or from northern Europe through the Strait of Belle Isle or over the Grand Banks, and the other half was from or to southern Europe avoiding iceberg infested waters, the tonnage for each year was halved. Since the iceberg season is basically half a year from February until August this number was halved again. The IIP, using a similar method of estimating the number of cargo vessels over the Grand Banks to the U.S. used an average cargo capacity of 32,500 tons (Pritchett, -). This gives an average equivalent of 391 voyages to and from Canadian ports which is in agreement with the IIP estimate of an average of 382 voyages for 1991 and 1992 over the Grand Banks to and from U.S ports. The figures for eastern Canada, therefore, were doubled to give a total estimate number of voyages for North America over the Grand Banks. The total number of transits over the 18 year period, 1986 – 2003, is then 14085 and the total number of collisions for cargo ships is 7. This gives a probability of collision of 0.05%, or, we can expect a collision once in every 2000 cargo vessel voyages.
CONCLUSIONS
The Microsoft Access database of Ship Collisions with Icebergs comprising over 670 events in approximately 200 years has been described in terms of its operation, search categories and data fields. A
number of examples demonstrating results and analysis from interrogation of the database have been shown and briefly discussed. These show a dependence of the number of collisions on iceberg severity and while the trend has improved over the years with better observation and detection techniques, collisions still occur. With the reduction in passenger traffic, collisions are now more likely to occur with cargo ships and fishing vessels, though there has been a number of passenger sight-seeing vessel incidents such as in Alaska recently, and more remote areas such as Baffin Bay and Hudson Strait are seeing more events.
The author would like to acknowledge PERD for financial support for the process of enlarging the original database and converting it to Microsoft Access. Thanks also to CHC for providing a template to help with the development of tbe database, and to Ian Jordaan for his interest and support of this project.
REFERENCES
Hill, B.T. Historical Record of Sea Ice and Iceberg Distribution around Newfoundland and Labrador, 1810 - 1958 Conference and Workshop of Arctic Climate Systems Study: Sea Ice Charts of the Arctic, Seattle, 1998. WMO/TD No. 949; IAPO Informal Report N0.
3. IOT- LM-1998-02. http://www.icedata.ca/icedb/ice/ Almost 20% of collisions with icebergs involving steam ships and
motor vessels since 1850 have resulted in sinkings, and from the data available it would appear that most have these have sunk due to some kind of indirect impact rather than a head on collision. Not surprisingly, reduced visibility by fog, precipitation or low light conditions was a factor in almost all the collisions for which there is data, and in those of good visibility the cause was likely a bergy bit or growler concealed in a heavy sea or a field of pack ice. Typically, but by no means certainly, the higher the speed at impact then the more likely the damage. Analysis of cargo in and out of Canadian and American ports over the last 18 years gave a probability of an iceberg collision of 0.05%, or once every 2000 voyages.
Hill, Brian T. Database of Ship Collisions with Icebergs. Report of the
International Ice Patrol Bulletin in the North Atlantic. 2000 Season, Bulletin No.86, CG-188-55
Hill, Brian T. Ship Collisions with Icebergs: an Historical Record of Collisions in the Seas around North America and Greenland.
Proceedings of the 16th International Conference on Port and Ocean Engineering under Arctic Conditions ’01, Ottawa, Canada Vol.2 pp 997-1002
Hill, B. Ship Iceberg Collision Database Operations Manual. Institute for Ocean Technology, LM-2004-3. http://www.icedata.ca/LM-2004-33.pdf
There are approximately 100 data fields in the database, and even with over 670 events described, analysis of the data frequently showed how rare it was to have all fields populated with data. It emphasizes the difficulty of obtaining data when, for example, in the recent collision of the Solborg permission to get on board was denied, and basic data such as vessel speed remain undocumented. Only a few examples of analyses of data from the database have been given here, but it illustrates how the database can be used and how easily it lends itself to more detailed analysis.
Hill, Brian T. Ship Collisions with Iceberg Database. Report to PERD: Trends and analysis. IOT-TR-2005-17
Marko, J.R., D.B. Fissel, P.Wadhams, P.M.Kelly, R.D.Brown, 1994: Iceberg Severity off Eastern North America: Its Relationship to Sea Ice Variability and Climate Change. Journal of Climate, V7. pp 1335-1351
Pritchett, Clarke W. Economic Value of the Ice Patrol. http://www.uscg.mil/lantarea/iip/FAQ/Org_6.shtml
Transport Canada.
http://www.tc.gc.ca/pol/en/report/anre2004/add/taba815.htm