ASSESSMENT OF THE ABILITY OF EXISTING AIRPORT GATE
INFRASTRUCTURE TO ACCOMMODATE TRANSPORT
CATEGORY AIRCRAFT WITH INCREASED WINGSPAN FOR
IMPROVED FUEL EFFICIENCY
Kristina C. Bishop and R. John Hansman
This report is based on the Masters Thesis of Kristina C. Bishop submitted to the Department of Aeronautics and Astronautics in partial fulfillment of the requirements for the degree of Master of
Science at the Massachusetts Institute of Technology.
Report No. ICAT-2012-4 May 2012
MIT International Center for Air Transportation (ICAT) Department of Aeronautics & Astronautics
Massachusetts Institute of Technology Cambridge, MA 02139 USA
[This Page Intentionally Left Blank]
ASSESSMENT OF THE ABILITY OF EXISTING AIRPORT GATE INFRASTRUCTURE TO ACCOMMODATE TRANSPORT CATEGORY
AIRCRAFT WITH INCREASED WINGSPAN FOR IMPROVED FUEL EFFICIENCY
By Kristina Bishop
Submitted to the Department of Aeronautics and Astronautics On May 24th, 2012 in Partial Fulfillment of the Requirements for the
Degree of Master of Science in Aeronautics and Astronautics.
Abstract
The continuous trend of rising fuel prices increases interest in improving the fuel efficiency of aircraft operations. Additionally, since fuel burn is directly linked to aircraft CO2 emissions, reducing fuel consumption has environmental benefits. One approach to
reducing airline cost and mitigating environmental impacts of aviation is to achieve higher fuel efficiency by increasing aircraft wingspan. One concern is that airports may not be able to accommodate increased-wingspan aircraft since existing gate infrastructure may have been sized for the past and current aircraft. This results in a potential tradeoff for airlines; increasing wingspan increases fuel efficiency, but it also limits the number of gates available to maintain current aircraft operations. The objective of this thesis is to evaluate this tradeoff.
In this thesis, a study on the existing gate infrastructure and gate utilization was performed using recorded aircraft operations from 2010 at seven U.S. airports. Initial analysis of existing gate infrastructures was conducted at these airports for the number of gates available at an airport for a given wingspan. As wingspan increases, the number of gates at an airport that can accommodate the aircraft decreases. In current operations, it is common for aircraft to be scheduled at gates capable of accommodating larger aircraft. By analyzing this gate usage, the potential to increase wingspan without modifying gate infrastructure was quantified. It is also possible to utilize an open adjacent gate in order to accommodate an aircraft with increased wingspan. By analyzing scheduled aircraft operations, it was possible to determine the ability of existing gate infrastructure at each analyzed airport to accommodate aircraft by use of available adjacent gate.
There appears to be opportunity to accommodate a significant number of Group III aircraft with wingspan increased to 124 ft with minimal gate infrastructure change required at most of the airports analyzed. The airports that limit additional increase past 124 ft are the perimeter-restricted airports, LGA and DCA. When LGA and DCA were removed as limiting airports, there was opportunity for a number of aircraft to increase wingspan to as high as 200 ft when taking full advantage of the entire width of utilized gates, and as high as 225 ft with the use of available adjacent gates.
Thesis Supervisor: Dr. R. John Hansman
Acknowledgements
The research efforts for this study by Massachusetts Institute of Technology were supported by the U.S. Federal Aviation Administration, Office of Environment and Energy, under the Partnership for AiR Transportation Noise and Emissions Research (PARTNER) Center of Excellence, FAA Cooperative Agreement No. 09-C-NE-MIT, Amendment No. 005, and FAA Contract No. DTFAWA-05-D-00012, Task Order Nos. 0010 and 0012, and by the U.S. Department of Transportation, Research and Innovative Technology Administration (RITA) under the Volpe National Transportation Systems Center, Contract No. DTRT57-07-D-30006, Task Order No. DTRTV-T01005. These efforts were managed by Pat Moran and László Windhoffer. Any opinions, findings, and conclusions or recommendations expressed in this material are those of the authors and do not necessarily reflect the views of the FAA or the DOT RITA Volpe Center.
The authors would like to thank Flavio Leo and Shailesh Gongal at Massport, for the detailed gate data they provided for Boston Logan International Airport and the useful background, advice, and feedback on this research.
Table of Contents
Chapter 1: Introduction ... 13 1.1 Motivation... 13 1.2 Objective ... 14 1.3 Approach... 14 1.4 Thesis Overview ... 16 Chapter 2: Background... 172.1 Airport Terminal Configuration ... 17
2.2 Gate Apron Layout ... 18
2.3 Wingtip Clearances... 20
2.4 Definition of Aircraft Group Size and Gate Group Size ... 21
Chapter 3: Boston Logan International Airport – Estimation of Existing Gate Infrastructure... 22
3.1 Scope... 22
3.2 Data Collection of Reported Aircraft Operations in 2010 at BOS from Flightstats.com ... 23
3.3 Analysis of BOS Available Gate Infrastructure... 24
3.4 Identifying Limitations of Gate Infrastructure Analysis ... 26
3.4.1 Comparison of BOS Gate Infrastructure Analysis... 26
3.4.2 Comparison of BOS Gate Infrastructure by Terminal ... 29
Chapter 4: Boston Logan International Airport - Strategy 1: Accommodation of Aircraft with Increased Wingspan by Taking Advantage of the Entire Width of Utilized Gates. ... 33
4.1 Strategy 1A: Potential Increase to Wingspan of Group III Aircraft by Taking Advantage of the Entire Width of Gates. ... 33
4.1.1 Strategy 1B: Potential Increase to Wingspan of Group III Aircraft that Utilize a Larger Available Gate within the Existing Infrastructure. ... 33
4.2 BOS Reported Aircraft Operations in 2010 ... 34
4.3 BOS Group III Aircraft Demand in 2010 ... 38
4.4 Analysis on the Ability of BOS to Accommodate Group III Aircraft with Increased Wingspan in Existing Gate Infrastructure using Strategy 1 ... 39
4.4.1 Strategy 1A: Potential Increase to Wingspan of Group III Aircraft by Taking Advantage of Entire Width of Utilized Gates... 39
4.4.2 Comparison of Strategy 1A Results ... 40
4.4.3 Strategy 1B: Potential Increase to Wingspan of Group III Aircraft that Utilize a Larger Available Gate within the Existing Infrastructure. ... 41
Chapter 5: Boston Logan International Airport – Strategy 2: Accommodation of Aircraft with Increased Wingspan when Utilizing Available Adjacent Gates ... 43
5.1 Approach of Strategy 2: Potential Increase to Wingspan of Group III Aircraft when Utilizing Available Adjacent Gates. ... 43
5.1.1 Limitations of Strategy 2 Analysis... 45
5.2 Gate Utilization Results ... 46
5.3 Analysis on the Ability of BOS to Accommodate Group III Aircraft with Increased Wingspan in Existing Gate Infrastructure using Strategy 2 ... 49
5.3.1 Comparison of Strategy 2 Analysis... 51
5.4 Conclusion... 52
Chapter 6: Comparison of Available Gate Infrastructure for Analyzed Airports.. 53
6.1 Scope... 53
6.2 Available Gate Infrastructure at Analyzed Airports... 54
6.3.1 LGA Estimated Gate Infrastructure Comparison to Google Map Images ... 55
6.3.2 DCA Estimated Gate Infrastructure Comparison to Google Map Images... 56
Chapter 7: Summary of Gate Utilization for Analyzed Airports... 58
7.1.1 Gate Utilization for All Aircraft Operations Recorded in 2010... 58
7.1.2 Gate Utilization for Group III Aircraft Operations Recorded in 2010... 61
Chapter 8: Summary Analysis of Study Airports for the Accommodation of Group III Aircraft using Strategy 1 - Taking Advantage of the Entire Gate Width, and Strategy 2 - Utilizing Available Adjacent Gates... 64
8.1 Analysis of Ability to Accommodate Group III Aircraft with Increased Wingspan at JFK. 65 8.2 Analysis of Ability to Accommodate Group III Aircraft with Increased Wingspan at LAX 66 8.3 Analysis of Ability to Accommodate Group III Aircraft with Increased Wingspan at ATL 67 8.4 Analysis of Ability to Accommodate Group III Aircraft with Increased Wingspan at DFW 68 8.5 Analysis of Ability to Accommodate Group III Aircraft with Increased Wingspan at LGA 69 8.6 Analysis of Ability to Accommodate Group III Aircraft with Increased Wingspan at DCA 70 Chapter 9: Conclusion... 71
List of Figures
Figure 1: The effect of increasing wingspan on fuel burn for the B737-800 aircraft [Alonso 2012] ... 14
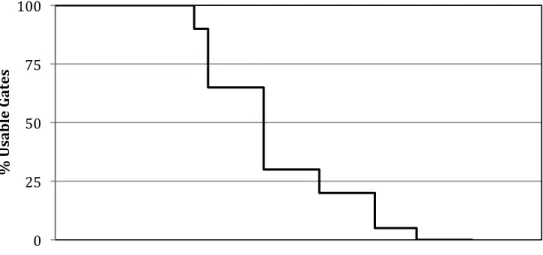
Figure 2: Percent of usable gates as a function of wingspan for a notional airport’s existing gate infrastructure. ... 15
Figure 3: Summary of strategies used to accommodate aircraft with increased wingspan in existing airport infrastructure. ... 16
Figure 4: Passenger Terminal Design Layout [en.wikepedia.com]... 17
Figure 5: Diagram explaining gate apron layout and ground equipment necessary [ACRP 2010] ... 18
Figure 6: Illustration of stop lines and lead-in lines for a gate apron [Data Source: googlemap.com]... 19
Figure 7: FAA Recommended Aircraft Clearances... 20
Figure 8: BOS terminal configuration and gate distribution for airlines (2008) [Data Source: Massport]... 22
Figure 9: BOS gate utilization by aircraft type for a typical gate in 2010 [Data Source: Flightstats.com]... 24
Figure 10: BOS percentage of usable gates for a given wingspan [Data Source: Flightstats.com] ... 25
Figure 11: AutoCAD model of BOS gates to analyze existing gate infrastructure [Data Source: Massport] ... 27
Figure 12: BOS percentage of usable gates for a given wingspan – Comparison of gate infrastructure inferred from reported aircraft operations to the existing infrastructure determined from the AutoCAD model [Data Source: Flightstats.com] ... 27
Figure 13: BOS Terminal A [ifly.com] ... 29
Figure 14: BOS Percentage of usable Gate as a function of Wingspan for Terminal A: Comparison of inferred gate width to the physical gate width [Data Source: Flightstats.com] ... 30
Figure 15: BOS Terminal B and Terminal C [ifly.com] ... 30
Figure 16: BOS Percentage of usable Gate as a function of Wingspan for Terminal B: Comparison of inferred gate width to the physical gate width [Data Source: Flightstats.com] ... 31
Figure 17: BOS Percentage of usable Gate as a function of Wingspan for Terminal C: Comparison of inferred gate width to the physical gate width [Data Source: Flightstats.com] ... 31
Figure 18: BOS Terminal E [ifly.com]... 32
Figure 19: BOS Percentage of usable Gate as a function of Wingspan for Terminal E: Comparison of inferred gate width to the physical gate width [Data Source: Flightstats.com] ... 32
Figure 20: Strategy 1A - Increase wingspan by taking advantage of the entire gate width ... 33
Figure 21: Strategy 1B - Increase wingspan by taking advantage of the entire gate width a larger available gate at the airport... 34
Figure 22: BOS percentage of aircraft arrivals by aircraft group size in 2010 [Data Source: Flightstats.com] ... 35
Figure 23: Worldwide Fuel Burn, Payload, and Departures (Operations) by Aircraft Type [Data Source: Yutko 2010] ... 36
Figure 24: BOS gate use by aircraft group size in 2010 (Left) and BOS gate use by Group III aircraft in 2010 [Data Source: Flightstats.com]... 37
Figure 25: BOS gate use by aircraft type for a typical gate in 2010 [Data Source: Flightstats.com] ... 37
Figure 26: Realized BOS demand for gates by Group III aircraft as a function of wingspan (2010) [Flightstats.com] ... 38
Figure 27: BOS Possible accommodation of Group III aircraft with increased wingspan for Strategy 1A – Aircraft use the entire width of utilized gate [Data Source: Flightstats.com]... 40
Figure 28: BOS Comparison of the possible accommodation for Group III aircraft with increased wingspan between inferred (Flightstats) and existing (AutoCAD) gate infrastructure for Strategy 1A - Aircraft use the entire width of utilized gate [Data Source: Flightstats.com] ... 41
Figure 29: BOS Possible accommodation of Group III aircraft with increased wingspan for Strategy 1 – Aircraft use the entire width of utilized gate and Strategy 1B- Use of a larger available gate at the airport [Data Source: Flightstats.com] ... 42
Figure 30: Strategy 2A - Two aircraft using a single available adjacent gate... 44
Figure 31: Strategy 2B - Aircraft use of entire width of available adjacent gate ... 44
Figure 32: Strategy 2C - Aircraft use of entire width of two available adjacent gates... 45
Figure 33: MARS accommodation of either 4 narrow body aircraft or 3 wide body aircraft [ACRP 2010] 46 Figure 34: BOS gate utilization at a given time by aircraft size in 15-minute intervals for 7/15/2010 [Data Source: Flightstats.com]... 47
Figure 35: BOS gate utilization by aircraft size and gate size in 15-minute intervals for 7/15/2010 [Data
Source: Flightstats.com]... 48
Figure 36: BOS gate utilization for Terminal A by aircraft group size and aircraft type on 7/15/2010 [Data Source: Flightstats.com]... 48
Figure 37: BOS Terminal C gates 25-36 [ifly.com] - Determination of gate order ... 49
Figure 38: BOS Possible accommodation of Group III aircraft with increased wingspan for Strategy 1 – Aircraft use the entire width of utilized gate and Strategy 2-Use of available adjacent gates [Data Source: Flightstats.com]... 50
Figure 39: BOS Comparison of the possible accommodation for Group III aircraft with increased wingspan between inferred and existing gate infrastructure for Strategy 2 - Use of available adjacent gates. [Data Source: Flightstats.com]... 51
Figure 40: Percentage of usable gates as a function of wingspan for all airports normalized by the maximum number of usable gates at each airport, based on reported aircraft operations [Data Source: Flightstats.com]... 54
Figure 41: LGA - Google Map Images of Central Terminal B evaluating potential gate width expansion – Evidence of current utilization of adjacent gates [googlemap.com]... 56
Figure 42: DCA Google Map Images of Terminal A (Left) and Terminal B (right) ... 57
Figure 43: Gate utilization by aircraft group size for analyzed airports in 2010 [Data Source: Flightstats.com]... 58
Figure 44: Gate utilization by aircraft group size for analyzed airports in 2010 [Data Source: Flightstats.com]... 60
Figure 45: Gate utilization of Group III aircraft for analyzed airports in 2010 [Data Source: Flightstats.com] ... 61
Figure 46: Gate utilization by aircraft group size for all airports in 2010 for busiest day recorded by ASPM at each airport [Data Source: Flightstats.com]... 63
Figure 47: JFK Possible accommodation for Group III aircraft with increased wingspan for Strategy 1 – Aircraft use the entire width of utilized gate and Strategy 2-Use of available adjacent gates [Data Source: Flightstats.com]... 65
Figure 48: LAX Possible accommodation for Group III aircraft with increased wingspan for Strategy 1 – Aircraft use the entire width of utilized gate and Strategy 2-Use of available adjacent gates [Data Source: Flightstats.com]... 66
Figure 49: ATL Possible accommodation for Group III aircraft with increased wingspan for Strategy 1 – Aircraft use the entire width of utilized gate and Strategy 2-Use of available adjacent gates [Data Source: Flightstats.com]... 67
Figure 50: DFW Possible accommodation for Group III aircraft with increased wingspan for Strategy 1 – Aircraft use the entire width of utilized gate and Strategy 2-Use of available adjacent gates [Data Source: Flightstats.com]... 68
Figure 51: LGA Possible accommodation for Group III aircraft with increased wingspan for Strategy 1 – Aircraft use the entire width of utilized gate and Strategy 2-Use of available adjacent gates [Data Source: Flightstats.com]... 69
Figure 52: DCA Possible accommodation for Group III aircraft with increased wingspan for Strategy 1 – Aircraft use the entire width of utilized gate and Strategy 2-Use of available adjacent gates [Data Source: Flightstats.com]... 70
Figure 53: BOS Terminal E Gate Plans for a Summer Thursday in 2010 [Massport] ... 81
Figure 54: BOS Terminal E Gate Plans for a Winter Thursday in 2010 [Massport] ... 81
Figure 55: BOS Gate Utilization for Terminal A on 7/15/2010... 82
Figure 56: BOS Gate Utilization for Terminal B on 7/15/2010 ... 82
Figure 57: BOS Gate Utilization for Terminal C on 7/15/2010 ... 83
Figure 58: BOS Gate Utilization for Terminal E on 7/15/2010 ... 83
Figure 59: JFK Airport Gate Map [Data Source: Visitingdc.com ] ... 84
Figure 60: LAX Airport Gate Map [Data Source: ifly.com] ... 85
Figure 61: ATL Airport Gate Map [Data Source: uscaau.wordpress.comLGA] ... 85
List of Tables
Table 1: FAA Aircraft Design Group (ADG) Definitions [ACRP 2010] ... 21 Table 2: Gate Data Collection Chart [Data Source: Flightstats.com] ... 23 Table 3: BOS Gates for which the wingspan of the largest scheduled aircraft exceeded the gate width
determined by the AutoCAD model. ... 28 Table 4: Specific Details for Analyzed Airports [Data Source: ASPM] ... 53 Table 5: DCA gate infrastructure comparison between wingspan of largest scheduled aircraft and physical
gate width determined by Google Maps ... 57 Table 6: Additional airport specifics and calculated average number of aircraft turns per gate per day for
analyzed airports [Data Source: FAA/ASPM]... 59 Table 7: Average gate occupancy time throughout the day in minutes by aircraft group size for analyzed
Acronyms and Abbreviations
AC Advisory Circular ADG Aircraft Design Group ARFF Rescue and Firefighting
ASPM Aviation System Performance Metrics
ATL Hartsfield-Jackson Atlanta International Airport, Georgia BJ Business Jet
BOS Gen. Edward Lawrence Logan International Airport, Massachusetts CAEP Committee on Aviations Environmental Protection
CO2 Carbon Dioxide
DCA Ronald Reagan Washington National Airport, District of Columbia DFW Dallas/Fort Worth International Airport, Texas
EMB Embraer
FAA Federal Aviation Administration GHG Green House Gas
IATA International Air Transport Association ICAO International Civil Aviation Organization
JFK John F. Kennedy New York International Airport, New York LAX Los Angeles International Airport, California
LGA La Guardia New York Airport (and Marine Air Terminal), New York MARS Multi-Aircraft Ramp System
MD McDonnell Douglas
MIT Massachusetts Institute of Technology NAS National Airspace System
NextGen Next Generation Air Transportation System NM Nautical Mile
PARTNER Partnership for AiR Transportation Noise and Emissions Reduction RJ Regional Jet
Chapter 1: Introduction
1.1 Motivation
There is interest in improving the fuel efficiency of aircraft operations due to the continuous trend of rising fuel prices. According to the International Air Transport Association (IATA), fuel is the “largest single cost item for the global airline industry.” Therefore there is a strong economic incentive to reduce aircraft fuel burn. Additionally, since fuel burn is directly linked to aircraft CO2 emissions, reducing fuel consumption
has environmental benefits.
Rising fuel prices indicate that it may be worthwhile to add technologies or incorporate design changes to aircraft to increase fuel efficiency. Such actions may not have been justified in past aircraft designs, as fuel costs were not as significant. Thus, reducing airline cost and mitigating environmental impacts of aviation are motivations for considering higher fuel efficiency when designing future generation aircraft.
One approach to achieving higher fuel efficiency is to increase aircraft wingspan [AFSB 2007]. A recent study at Stanford University evaluated the effects of increasing
wingspan on fuel burn. The resulting impacts on a representative aircraft are shown in Figure 1. As wingspan increases, there is a decrease in induced drag, which in turn reduces fuel burn. However, as wingspan continues to increase, the additional weight from the added wingspan counters the benefit of reduced drag. This results in an optimal wingspan for a given aircraft design. For the B737-800 example provided, the optimal wingspan requires a 15% increase to the baseline wingspan. Additional studies indicated that many aircraft in current operation have wingspans not optimized to minimize fuel burn. [Alonso 2012]. The potential for a significant increase in wingspan on future generation aircraft motivates this analysis on the impact of aircraft with increased wingspan to the existing gate infrastructure.
Although there are expected benefits from optimizing wingspan, one concern is that airports may not be able to accommodate increased-wingspan aircraft since gates may have been sized for current or historical aircraft. This results in a potential tradeoff for airlines; increasing wingspan increases fuel efficiency, but it also may limit the number of gates available to maintain current aircraft operations.
B737-‐800
Figure 1: The effect of increasing wingspan on fuel burn for the B737-800 aircraft [Alonso 2012]
1.2 Objective
The objective of this thesis was to identify tradeoffs between increasing aircraft wingspan (which increases fuel efficiency) against the ability to accommodate aircraft operations by aircraft with larger wingspan given existing gate infrastructure. The scope of this thesis was limited to two minimal cost options: using existing gate infrastructure or combining adjacent gates.
Use of these minimal cost options was motivated by the high uncertainty in the costs associated with major infrastructure changes, such as complete reconstruction of
terminals to allow larger gate separation or the addition of new gates. While it is possible that the benefits of fuel burn reduction are great enough to motivate further investigation of more aggressive gate infrastructure changes, they were not investigated in this thesis.
1.3 Approach
Initial analysis of existing gate infrastructures was conducted at various US airports for the purpose of understanding the percentage of gates available at an airport for a given wingspan. Due to the inability of some gates to accommodate larger aircraft, an increase in wingspan can reduce the percent of usable gates at an airport. This effect can be seen in Figure 2, which plots the percent of usable gates as a function of wingspan. Initially, for an aircraft with a small wingspan, 100 percent of the gates are able to accommodate
Figure 2: Percent of usable gates as a function of wingspan for a notional airport’s existing gate infrastructure.
Several strategies were investigated at selected airports using the recorded aircraft operations for 2010 and used to determine the ability of existing gate infrastructure to accommodate aircraft with increased wingspan. In current operations, it is common for aircraft to be scheduled at gates capable of accommodating larger aircraft. By analyzing this gate usage in Strategy 1A, the potential to increase wingspan without modifying gate infrastructure was quantified. Strategy 1B removes the restriction that an aircraft must remain in the utilized gate, and allow allows an aircraft to utilize any larger available gate regardless of airline, gate agreements or terminal locations. Figure 3 illustrates both of these sub strategies.
It is also possible to utilize open adjacent gates in order to accommodate an aircraft with increased wingspan, as was analyzed by each of the sub strategies shown in Figure 3 for Strategy 2. The initial analysis was to determine whether or not an aircraft had an
available adjacent gate. If an adjacent gate is available, Strategy 2A determines if it is possible to simultaneously split the available adjacent gate with another scheduled
aircraft allowing both aircraft to increase their wingspan. If scheduling does not allow for Strategy 2A to be possible, then Strategy 2B allows for an aircraft to utilize the full width of an available adjacent gate. If an additional adjacent gate is still available after Strategy 2B has been examined, then Strategy 2C allows for the wingspan to be further extended spanning the width of all three gates. From analyzing these three sub strategies, the potential of an airport to accommodate an aircraft with increased wingspan with the use of available adjacent gates could be determined.
0 25 50 75 100 % U sa b le G at es Wingspan
Figure 3: Summary of strategies used to accommodate aircraft with increased wingspan in existing airport infrastructure.
1.4 Thesis Overview
This thesis evaluates seven significant US airports in the OEP 351 list of airports: BOS, JFK, LAX, ATL, DFW, LGA, and DCA. Three airports were chosen as examples of international airports, BOS, JFK and LAX. Two airports were chosen as examples of hub airports, ATL and DFW. Furthermore, two airports were chosen as critical airports that operate under the Wright Amendment2, LGA and DCA.
Chapter 2 provides background for this thesis, explaining gate infrastructure and wingtip clearances in addition to offering definitions for aircraft and gate sizes. Chapter 3
includes an initial analysis on the existing gate infrastructure in terms of available gate size at BOS. Chapters 4 and 5 an analysis of the BOS gate infrastructure and its ability to accommodate aircraft with increased wingspan by implementing the two minimal cost strategies shown in Figure 3. Chapter 6 expands the analysis of existing gate
infrastructure in terms of available gate size to six other airports. In chapters 7 and 8, the two strategies are then implemented at each of the analyzed airports to examine the ability of existing gate infrastructures to accommodate aircraft with increased wingspan. Chapter 9 discusses the results and presents a conclusion to this thesis.
1 “The OEP 35 (Operational Evolution Partnership) airports are commercial U.S. airports with significant
activity. These airports serve major metropolitan areas and also serve as hubs for airline operations. More than 70 percent of passengers move through these airports.” [FAA ASPM]
Chapter 2: Background
2.1 Airport Terminal Configuration
The size of gates, proximity of aircraft, and the ability for gate expansion can be related to airport terminal configurations. The most typical terminal design configurations are illustrated in Figure 4. Combinations of these configurations are possible as well.
Figure 4: Passenger Terminal Design Layout [en.wikepedia.com]
The initial terminal concept selection is influenced by the physical characteristics of the terminal site such as the available area for expansion, existing facilities, airport layout, as well as the predominant type of aircraft and passenger activity [Advisory Circular 88]. The increase of aircraft traffic and changes to the aircraft size and types serving the airport often necessitate modifications or expansions to the terminals.
The linear and curvilinear terminal configurations are simplistic designs that align aircraft
along one side of the terminal building.For airports with high annual enplanement traffic
and a fleet mix including wide-body aircraft, the required overall apron area for these configurations becomes very large due to large required gate widths. Configurations, such as the pier, concourse, and satellite become more appropriate for efficient utilization of available airport terminal space.
A pier-finger design has aircraft parked on both sides of the building and offers the higher aircraft capacity often seen at large international airports. A satellite terminal is a stand-alone building so that aircraft can park around its entire circumference.
2.2 Gate Apron Layout
A gate is associated with an individual aircraft parking position situated at a terminal building with the purpose of loading and unloading passengers and cargo. The gate apron is the paved area of the gate adjacent to the terminal building where the aircraft is parked for fueling and maintenance. The design of the gate apron depends on the configuration of the terminal (linear, pier, satellite, etc.), clearances required for the aircraft, physical characteristics of the aircraft, and the types and sizes of the ground service equipment required to service the aircraft [Ashford 2011].
Aircraft servicing is typically provided by a combination of movable vehicles and equipment as well as fixed servicing installations mainly for fueling and power systems
as shown in Figure 5. Fixed servicing installations are commonly located on or under the apron, or in the terminal building adjacent to the aircraft gate. Aircraft gates that contain fixed utility installations benefit from less congestion on the apron and shorter aircraft servicing times [ACRP 2010].
Figure 5: Diagram explaining gate apron layout and ground equipment necessary [ACRP 2010]
Most airports with high levels of activity and servicing of larger aircraft, use a form of underground aircraft fueling called a fuel pit instead of a mobile fuel truck. The fuel pit limits congestion on the apron by reducing ground equipment and shortening aircraft turnaround times [Advisory Circular 1988]. However, a typical planning convention is to design the aircraft parking positions so that each aircraft’s fueling service point falls within a 50-foot radius of the apron hydrant valve [Advisory Circular 1988]. This reduces the flexibility of aircraft-parking configurations. Since hydrant systems are permanently constructed under the apron, any future reconfiguration of the airport terminal building or gate apron arrangement could be affected by the location of the hydrant valves. A
consequence to fixed installations, such as fuel pits, is a reduction in flexibility to handle different types of aircraft parking configurations.
Aircraft lead-in lines guide pilots into a specific aircraft parking position from the taxilane. The lead-in lines can vary within a gate due to necessary clearances and the flexibility of loading bridges. Therefore, many gates have multiple lead-in lines that depend on the aircraft type utilizing the gate. Stop lines are positioned on the lead-in line to signify where each aircraft type should position the front landing gear to ensure the recommended clearance between the nose of the aircraft and the terminal building. This clearance ranges between 15-30 feet depending on aircraft size and push back operations [Advisory Circular 1989]. The purpose of lead-in lines and stop lines are to correctly position each aircraft. This allows sufficient room for ground equipment, proper placement in relation to fixed installations, and required clearances from adjacent gates and structures to be met.
Figure 6: Illustration of stop lines and lead-in lines for a gate apron [Data Source: googlemap.com]
2.3 Wingtip Clearances
Required aircraft clearances while parked at the gate vary considerably, where variations are dependent on airline policy, service equipment used, aircraft type, and terminal configuration. The minimum wingtip clearance recommended by FAA is between 20 and 25 feet, depending on the size of the aircraft [Advisory Circular 1989]. Many airlines have their own wingtip separation requirements based on their aircraft fleet mix, gate apron area, and various safety factors. The FAA also recommends a 20-45 foot clearance between aircraft and building extremities depending on the terminal type [Advisory Circular 1989]. The recommended nose-to-building, wingtip, and wingtip-to-building clearances are shown in Figure 7.
Figure 7: FAA Recommended Aircraft Clearances
These clearance requirements are enforced for the safety of passengers and
crewmembers, as well as the protection of buildings, aircraft, and equipment. As aircraft maneuverability and guidance techniques become more precise, the necessary clearances will decrease. However, the wingtip clearance is also limited by the size of the safety vehicles necessary for emergency situations. Rescue and firefighting (ARFF) trucks are specialized for hazard mitigation, evacuation, and the rescue of passengers for an aircraft involved in an airport ground emergency [Aviation Fire Journal]. These fire trucks must be able to gain access to all parts of an aircraft while parked in its gate. Therefore, wingtip clearances must allow for sufficient room for these emergency vehicles, which can be as wide as 12 ft., to maneuver around the aircraft.
A 20-ft wingtip-to-wingtip clearance is observed at most airports; however one option to accommodate aircraft with increased wingspan is to decrease the recommended wingtip-to-wingtip clearance to 15 feet. This would allow a wingspan increase of at least 5 feet to each aircraft without any impact on the existing gate infrastructure. A 15-ft wingtip clearance is currently used at some airports under specific airline agreements for special circumstances. Such situations usually require the use of visual docking aids and/or wing walkers for precise positioning. Other methods to accommodate increased wingspan with minimal infrastructure changes will be analyzed throughout this thesis.
2.4 Definition of Aircraft Group Size and Gate Group Size
The aircraft group size used throughout this thesis was determined using the FAA
Aircraft Design Group (ADG) definitions. These define aircraft wingspan limits for each aircraft group size. These wingspan limits are listed in Table 1.
Table 1: FAA Aircraft Design Group (ADG) Definitions [ACRP 2010] FAA Aircraft
Design Group Aircraft Type
Minimum Wingspan(ft)
Maximum
Wingspan(ft) Typical Aircraft
I Small Regional 0 49 Metro
II Medium Regional 50 79 CRJ III
Narrow body/
Large Regional 80 118 A320/B737
IV Wide body 119 171 B767
V Jumbo 172 214 B747/B777/A330/A340 VI Super Jumbo 215 262 B747-800/A380
For the purpose of this thesis, gate width is defined as the usable width of a gate that can be used to accommodate aircraft wingspan. Therefore, the gate width does not include the clearances required between aircraft. The gate width is used to determine the gate group size. Gate group sizes are also based off the wingspan ranges for ADG definitions. For example, any gate width between 80 ft to 118 ft, such as a gate that fits an A320 at 112 feet, would be defined as a Group III sized gate.
Chapter 3: Boston Logan International Airport – Estimation
of Existing Gate Infrastructure
A detailed study of the available gate infrastructure was performed at Boston Logan International Airport (BOS) in order to understand the airport’s ability to accommodate aircraft with increased wingspan.
3.1 Scope
Boston Logan International Airport (BOS) is Boston’s primary airport and is the 19th busiest US airport with an annual traffic of 355,873 aircraft movements and 12,820,000 passengers for the year 2010 [ASPM]. It consists of four terminal buildings, three for domestic flights (Terminals A, B, C) and one for international flights (Terminal E). Terminal configuration and gate distribution for airlines operating at BOS in 2008 are shown in Figure 8. Although most of the gates are leased or owned by individual airlines, some are used by more than one airline under special agreements.
Figure 8: BOS terminal configuration and gate distribution for airlines (2008) [Data Source: Massport]
3.2 Data Collection of Reported Aircraft Operations in 2010 at BOS
from Flightstats.com
In order to analyze current gate infrastructure and utilization at BOS, available operation records and gate usage data for all aircraft movements in 2010 were collected from Flightstats.com3. Flightstats.com is an easily accessible resource that provides both aircraft arrival/departure times as well as specific gate usage location.
Aircraft operation data were collected for each day of 2010, consisting of all flights arriving at or departing from BOS. Every recorded aircraft movement provides the gate arrival/departure times, airline, aircraft type, and in most cases, the gate used. Gate numbers and locations were gathered from various resources including ifly.com, Google Maps, as well as the BOS airport website massport.com. This allowed the terminal and gate numbering to be matched with the information provided by Flightstats.
All code-sharing instances were removed to prevent aircraft movements from being counted multiple times. One problem that arose was a lack of gate information for Group I sized aircraft. However, since the majority of these aircraft use remote stands
specifically sized for Group I aircraft, these aircraft do not utilize larger sized gates and therefore were removed from this analysis. Finally, cancelled flights were removed due to the lack of reported arrival and departure times.
By matching arriving and departing flights of identical aircraft type, airline, and gate, a list of aircraft gate occupancy times (actual gate-in and gate-out times) was compiled for 2010 (Table 2). In addition, the aircraft wingspan and aircraft group size were derived from the aircraft type. Aircraft wingspans were determined from Jane’s Aircraft
Recognition Guide 2010, Piano-X aircraft database, and the Boeing website (Appendix A).
Table 2: Gate Data Collection Chart [Data Source: Flightstats.com]
3 According to Flightstats.com, the data presented online provides definitive information for
approximately 99.5% of US flights by querying multiple sources to create a broad range of information for each flight.
The average gate occupancy times by ADG were determined using data for aircraft operations with recorded arrival and departure times at the same gate, not including overnight utilization. The results for BOS in 2010, rounded to the nearest 5 minutes, were as follows: Group II: 60 minutes, Group III: 70 minutes, Group IV: 110 minutes, Group V: 125 minutes.
For instances where the gate-in time or gate-out time was not reported (an arrival
followed by another arrival, or departure followed by another departure at a gate), it was assumed that the aircraft occupied the gate for the average gate occupancy time based on the aircraft group size. These instances could either be caused by gaps in the recorded data or aircraft gate change. An example of this occurrence is shown in Table 2. The fourth and fifth entries in the table are reported departures. The second aircraft departure did not have a reported matching arrival time and was therefore assigned an arrival time 110 minutes before departure because it was a Group IV sized aircraft.
3.3 Analysis of BOS Available Gate Infrastructure
In order to estimate the existing gate infrastructure at BOS, an evaluation was performed on the reported aircraft operations in 2010. It was assumed that the width of the gate was the wingspan of the largest aircraft to have used that gate over the duration of the year. This assumption resulted in conservative gate width estimates. Gate analysis for a typical gate is shown in Figure 9. The largest aircraft accommodated in that gate in 2010 was an A319, therefore the gate was assumed to have a width of 112 ft.
Figure 9: BOS gate utilization by aircraft type for a typical gate in 2010 [Data Source: Flightstats.com] 80 85 90 95 100 105 110 115 0 100 200 300 400 500 600 700 800 900 1000 E70 E90 319 Wingspan (ft)
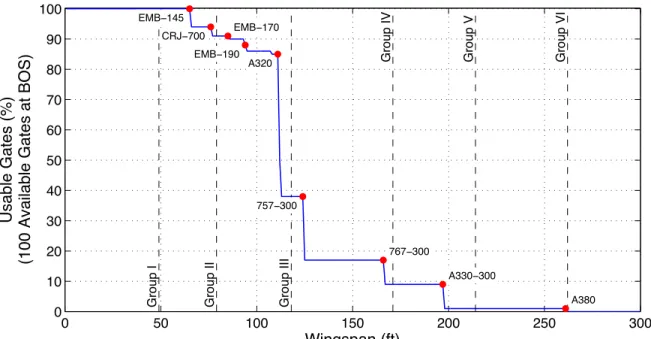
The resulting estimated gate infrastructure consists of a total of 100 gates for commercial use available at BOS when combining data from all four terminals. The percentage of usable gates as a function of aircraft wingspan is shown in Figure 9. The maximum wingspan of each ADG is illustrated by a dotted line. Usable gates are gates that can be used by an aircraft of a specific wingspan. It was assumed a gate could accommodate both the type of aircraft it was designed for as well as any smaller aircraft. This may be an overestimation due to the possibility that not all loading bridges have the flexibility to accommodate aircraft of various sizes.
As an aircraft’s wingspan increases, the number of gates that it can use decreases. Assuming the largest aircraft in each ADG had the maximum wingspan allowable, the largest Group I aircraft can be accommodated at 100 gates at BOS, the largest Group II aircraft can be accommodated at 91 gates, the largest Group III aircraft can be
accommodated at 38 gates, the largest Group IV aircraft can be accommodated at 9 gates, the largest Group V and Group VI aircraft can be accommodated at 1 gate.
Figure 10: BOS percentage of usable gates for a given wingspan [Data Source: Flightstats.com]
The majority of the aircraft that define the gate widths at BOS are shown in Figure 10. This chart provides an initial estimate of the possible impact that increasing wingspan could have on the existing gate infrastructure at BOS. An Airbus 320 aircraft, with a wingspan of 111 ft. 10 in., currently has the ability to use 86 out of 100 gates available. If this aircraft increased its wingspan by 5.5% to 118ft, it would only have 38 gates
available to use. The significance of this drop in gate availability and various strategies to reduce this decline in usable gates are further examined in Chapters 4 and 5.
0 50 100 150 200 250 300 0 10 20 30 40 50 60 70 80 90 100 Wingspan (ft) Usable Gates (%)
(100 Available Gates at BOS)
Group I Group II Group III
Group IV Group V Group VI
EMB−145 CRJ−700 EMB−190 A320 757−300 EMB−170 767−300 A330−300 A380
3.4 Identifying Limitations of Gate Infrastructure Analysis
It is possible that the schedule based gate analysis approach may lead to an
underestimation of gate infrastructure since gate width is estimated based on aircraft wingspan of reported aircraft operations and not the physical gate width available. Further analysis was conducted to determine potential expansion within the estimated gate infrastructure.
It is also possible that this schedule based gate analysis approach can lead to
overestimation in the gate width. Within current operations, there are instances where an adjacent gate is used to accommodate a larger aircraft. In such a situation, the aircraft is reported as using only one gate. This leads to an overestimation of those gate widths. A detailed analysis was done at BOS in order to determine if this overestimation was an issue.
3.4.1 Comparison of BOS Gate Infrastructure Analysis
Two sources of detailed gate information were obtained from the Boston Logan
International Airport operator, Massport, in order to compare the estimated gate widths based on reported operations to the actual gate geometry. The first data set included the airline, largest authorized aircraft, and gate constraints for each gate at the airport. The second gate data set was an AutoCAD model of the airport. This model provided more detailed gate information including the geometry of current BOS gates. Geometries obtained from the AutoCAD model were then compared to the previously estimated gate infrastructure.
In order to determine the maximum physical gate width for each gate at BOS, the AutoCAD model of the airport was examined. The AutoCAD model provided a detailed image of terminal locations as well as the positions of the lead-in lines such that the physical dimensions of the gate widths could be determined. After placing the largest authorized aircraft by BOS (Appendix B) into each gate, the maximum gate widths were determined such that each aircraft had the FAA suggested wingtip clearance of 20 feet with adjacent aircraft. Additionally, taxiway, fire lanes, and building interferences were avoided. It was assumed there were no airport operations or other restrictions that would affect this adjustment.
An example of the existing gate infrastructure analysis is shown in Figure 11. By
adjusting the gate widths so that these aircraft have a minimum 20 ft wingtip clearance on either side, it was possible to symmetrically increase the gate width while the aircraft remained on the same lead-in lines. These adjustments were performed across the entire airport, maximizing the possible gate widths within the existing gate infrastructure.
Figure 11: AutoCAD model of BOS gates to analyze existing gate infrastructure [Data Source: Massport]
The comparison of the estimated gate infrastructure based off reported aircraft operations (blue) to the actual existing gate infrastructure found using the AutoCAD model (red) is shown in Figure 12.
Figure 12: BOS percentage of usable gates for a given wingspan – Comparison of gate infrastructure inferred from reported aircraft operations to the existing infrastructure
determined from the AutoCAD model [Data Source: Flightstats.com]
In most cases the AutoCAD data demonstrated that gates could accommodate larger aircraft than what was found by reported flight operations. Not all gates sized for Group IV or V aircraft actually accommodated aircraft of that size. This was possibly due to an airline’s fleet mix, scheduling, or simple inefficiency in gate use. However in some cases,
0 50 100 150 200 250 300 0 10 20 30 40 50 60 70 80 90 100 Wingspan (ft) Usable Gates (%)
(100 Available Gates at BOS)
Group I Group II Group III
Group IV
Group V Group VI
Gate Width Determined by Flightstats Gate Width Determined by AutoCAD
there were Group III aircraft that have been recorded using gates that, according to the AutoCAD model, could not accommodate that wingspan, presumably by aircraft using unoccupied adjacent gates. Out of the 100 gates available at BOS, 14 gate widths were overestimated and 54 gates widths were underestimated when aircraft operations were considered, only. A list of the 14 instances where the wingspan of the largest scheduled aircraft was larger than the determined maximum gate width from the AutoCAD model is provided in Table 3. The full list is provided by terminal in Appendix C.
Table 3: BOS Gates for which the wingspan of the largest scheduled aircraft exceeded the gate width determined by the AutoCAD model.
Gate
Largest Scheduled
Aircraft FAA A/C Group Wingspan (ft)
AutoCAD Gate Width (ft) Delta (ft) A9A DH4 III 93.24 69.58 -23.66 A10A B737-800 III 112.57 76.25 -36.32 A11 CRJ - 700 II 76.25 65.75 -10.5 A12A MD -80 III 107.84 65.75 -42.09 A14 A330 - 300 V 197.83 124.84 -72.99 A15 A330 - 300 V 197.83 124.84 -72.99 A19 A330 - 300 V 197.83 124.84 -72.99 B1 A320 III 111.88 94.23 -17.65 B28 B767-300 IV 166.93 124.84 -42.09 B29 B757 IV 124.84 107.84 -17 B35 B767-300 IV 166.93 124.84 -42.09 C11 B757 IV 124.84 94.75 -30.09 C12 A320 III 111.88 94.75 -17.13 C14 A320 III 111.88 94.75 -17.13 E5 A330 - 300 V 197.83 156.07 -41.76
When examining the 14 instances where gate width was overestimated (Table 3), the additional gate data provided by BOS proved insight as to why this overestimation occurred. A list of all gates at BOS with associated information concerning the largest authorized aircraft, aircraft wingspan, and possible gate constraints can be found in Appendix B. In the gate data, there are many instances where a larger aircraft can be accommodated in the existing infrastructure using adjacent gates. These are not accounted for in the AutoCAD gate infrastructure analysis for BOS since they require gate closures. However, inferred gate widths based on recorded flight data made the assumption that the utilized gate was actually sized for the larger aircraft.
Overall, using reported aircraft operations to infer gate widths provided an accurate estimate of the existing gate infrastructure at BOS. In the BOS analysis it was found that 14% of the gates were mistakenly oversized and care should be taken when analyzing the results. However, it was also found that 54% of the gates were undersized, which may
reported aircraft operations compared to the use of existing gate infrastructure will be further analyzed in the following chapters.
As can be seen, one way to achieve more gate width than the physical gate allows is to use adjacent gates. This is a common practice both at BOS as well as other airports and it is possible to implement this at additional gates. The ability to accommodate aircraft with increased wingspan when using available adjacent gates is further analyzed in the next chapter.
3.4.2 Comparison of BOS Gate Infrastructure by Terminal
The initial gate infrastructure analysis does not take into account airline ownership of gates or terminal assignment. Figure 14 - Figure 19 demonstrate the differences by terminal between the estimated gate infrastructures based on reported aircraft operations to the existing gate infrastructure based on the AutoCAD model. These demonstrate how increasing wingspan may affect individual airlines differently.
Terminal A was completely restructured in 2005 to most efficiently accommodate the specific fleet mix of Delta and the former Continental Airlines most with the gate apron area available. The gate layout configuration is linear as shown in Figure 13 and thus further physical expansion of gate widths may be limited due to area constraints. When comparing gate widths, shown in Figure 14, Terminal A had many instances where the scheduled aircraft was larger then the determined physical gate width. This was due to the flexibility of many of the gates to use adjacent gates in order to accommodate larger aircraft.
Figure 13: BOS Terminal A [ifly.com]
Figure 14: BOS Percentage of usable Gate as a function of Wingspan for Terminal A: Comparison of inferred gate width to the physical gate width [Data Source: Flightstats.com]
Terminal B and C are much older terminals and each have over 6 different airlines which utilize these gates. Due to changes in airline gate assignments and aircraft fleet mix over the past few decades, the majority of the gates were probably not designed for the current aircraft which use these gates. From data provided by BOS in Appendix C, out of the 61 gates at these two terminals, shown in Figure 15, only 8 gates have the current ability to use adjacent gates in order to accommodate a larger aircraft. When comparing the
estimated gate infrastructure based on reported aircraft operations from Flightstats.com to the existing gate infrastructure based on the AutoCAD model, shown in Figure 16, it is shown for both terminals that many of the gates accommodate scheduled aircraft much smaller than what they are capable of accommodating.
Figure 15: BOS Terminal B and Terminal C [ifly.com]
0 50 100 150 200 250 300 0 10 20 30 40 50 60 70 80 90 100 Wingspan (ft) Usable Gates (%)
(24 Available Gates at Terminal A)
Group I Group II Group III
Group IV
Group V Group VI
Gate Width Determined by Flightstats Gate Width Determined by AutoCAD
Figure 16: BOS Percentage of usable Gate as a function of Wingspan for Terminal B: Comparison of inferred gate width to the physical gate width [Data Source: Flightstats.com]
Figure 17: BOS Percentage of usable Gate as a function of Wingspan for Terminal C: Comparison of inferred gate width to the physical gate width [Data Source: Flightstats.com]
Terminal E is the international terminal and therefore most of the aircraft movements at this terminal are by larger Group IV and V aircraft for long-range flights. All gates (excluding gates leased to Southwest) are common use gates and therefore are shared among the international carriers [massport.com]. The gates are mostly assigned based on operational needs and can be better matched for the aircraft size utilizing each gate. Since the introduction of the B747-800 and the A380, Terminal E has been completely
redesigned to accommodate these larger aircraft. Therefore, these gates have been sized to fit these aircraft with the minimum amount of wingtip seperation possible according to the AutoCAD model.
0 50 100 150 200 250 300 0 10 20 30 40 50 60 70 80 90 100 Wingspan (ft) Usable Gates (%)
(37 Available Gates at Terminal B)
Group I Group II Group III
Group IV
Group V Group VI
Gate Width Determined by Flightstats Gate Width Determined by AutoCAD
0 50 100 150 200 250 300 0 10 20 30 40 50 60 70 80 90 100 Wingspan (ft) Usable Gates (%)
(24 Available Gates at Terminal C)
Group I Group II Group III
Group IV
Group V Group VI
Gate Width Determined by Flightstats Gate Width Determined by AutoCAD
Many of the scheduled flight information collected from Flightstats.com for Terminal E did not contain the gate location. Therefore the gate widths inferred by reported aircraft operations at these gates underrepresent the actual physical gate infrastructure possible. In order to get a better understanding of the typical size and type of aircraft movements at Terminal E, the gate utilization charts for the summer and winter of 2010 were obtained from BOS (Appendix E). Since the majority of the gates at Terminal E are actually designed for Group IV and V aircraft (excluding Southwest gates), Group III aircraft could increase their wingspan and still utilize these gates.
Figure 18: BOS Terminal E [ifly.com]
Figure 19: BOS Percentage of usable Gate as a function of Wingspan for Terminal E: Comparison of inferred gate width to the physical gate width [Data Source: Flightstats.com]
0 50 100 150 200 250 300 0 10 20 30 40 50 60 70 80 90 100 Wingspan (ft) Usable Gates (%)
(15 Available Gates at Terminal E)
Group I Group II Group III
Group IV
Group V Group VI
Gate Width Determined by Flightstats Gate Width Determined by AutoCAD
Chapter 4: Boston Logan International Airport - Strategy 1:
Accommodation of Aircraft with Increased Wingspan by
Taking Advantage of the Entire Width of Utilized Gates.
The first step in determining the impact of increased wingspan on gate infrastructure was to examine the reported aircraft demand and gate utilization at BOS in 2010 to identify opportunities for wingspan expansion within utilized gates.4.1 Strategy 1A: Potential Increase to Wingspan of Group III Aircraft
by Taking Advantage of the Entire Width of Gates.
In current operations it is common for aircraft to be scheduled at gates capable of accommodating larger aircraft. By analyzing this, the potential to increase wingspan without modifying gate infrastructure was quantified.
The first strategy used to accommodate aircraft with increased wingspan was to use the entire physical width of the gate an aircraft utilized. Therefore, if a Group III sized aircraft was parked in a Group IV, V, or VI sized gate, this strategy allowed that aircraft to increase its wingspan to the maximum utilized gate width. Strategy 1A, illustrated in Figure 20, was implemented within the recorded aircraft operations of 2010 at BOS to determine the ability of existing gate infrastructure to accommodate aircraft with increased wingspan.
Figure 20: Strategy 1A - Increase wingspan by taking advantage of the entire gate width
4.1.1 Strategy 1B: Potential Increase to Wingspan of Group III Aircraft that Utilize a Larger Available Gate within the Existing Infrastructure.
To determine the maximum ability to accommodate larger aircraft at BOS airport, the previous restriction that an aircraft must remain at the utilized gate was removed. This
Strategy allows an aircraft to utilize any available gate regardless of airline, gate
agreements or terminal locations. Therefore, if a Group III aircraft was currently using a Group III sized gate and there was a Group IV sized gate available somewhere in the airport, the aircraft could shift gates to allow for an increase in wingspan.
For each aircraft operation at BOS in 2010, a list of gates was compiled that were available for the entire scheduled length of gate stay. The gate width of each of the available gates was analyzed, and the aircraft was then shifted such that it accommodated the available gate with the largest width, as shown in Figure 21. After the aircraft was shifted, the wingspan of the aircraft was compared to the width of the new utilized gate to determine the potential increase in wingspan.
Figure 21: Strategy 1B - Increase wingspan by taking advantage of the entire gate width a larger available gate at the airport
4.2 BOS Reported Aircraft Operations in 2010
In order to determine the ability to accommodate aircraft with increased wingspan within the existing gate infrastructure, aircraft operations at BOS in 2010 were analyzed. With aircraft operations data, the gate utilization was examined.
Analysis of all aircraft operations in the year 2010 is presented in Figure 14 categorized by aircraft group size. Out of a total of 168,775 reported operations at BOS in 2010, 111,603 (66%) of the operations were of Group III size. The remainder of the aircraft operations were comprised of 20% Group II sized aircraft, 10% Group IV sized aircraft, and 4% Group V sized aircraft.
Figure 22: BOS percentage of aircraft arrivals by aircraft group size in 2010 [Data Source: Flightstats.com]
For the remainder of this thesis, analysis on the possible impacts to gate infrastructure was focused on increasing wingspan for Group III aircraft (aircraft with a wingspan between 79 ft and 118 ft). According to analysis by Yutko, 50% of worldwide flights were by categorized single aisle (SA) aircraft, not including the smaller business jets (BJ) or regional jets (RJ). The fuel burn, payload, and operation statistics for 2006 worldwide aircraft operations are shown in Figure 9. The Group III ADG category is comparable to the defined SA category, excluding the single aisle B757 and DC-8 aircraft that are not included in the Group III ADG.
35% of the fleet-wide fuel burn comes from the SA aircraft category, which was the largest percentage by category. Increasing wingspan on these aircraft will have a significant impact on reducing fuel use due to the high number of flights that will be affected. Although wide bodied aircraft account for higher fuel burn per flight, due to limited airport infrastructure area available, other design changes such as reduced flight Mach number and reduced payload/range may be better methods to reduce fuel burn.
Figure 23: Worldwide Fuel Burn, Payload, and Departures (Operations) by Aircraft Type [Data Source: Yutko 2010]
From the recorded aircraft operations of 2010, gate utilization analysis on utilization of gate group size was conducted. The gate utilization by aircraft group size and gate size is shown in Figure 24 (Left). This reveals the number of instances where aircraft utilize oversized gates. At BOS, over half of the Group II aircraft movements utilize group III sized gates and the majority of aircraft operations in Group IV sized gates were by Group III sized aircraft. This indicates a possibility to increase aircraft wingspan within the existing gates. There were also a few instances where a Group III sized aircraft utilizes a Group V sized gate. These aircraft have the potential to increase their wingspan to a Group V sized wingspan with very minimal impact to the gate infrastructure.
The gate utilization by Group III aircraft at BOS is also shown in Figure 24 (Right). 65% of Group III sized aircraft actually used Group III sized gates in 2010, over 30% used Group IV sized gates and 5% used a Group V sized gate. This means that over 35% of aircraft used oversized gates and could increase their wingspan to the maximum width of those gates with minor infrastructure changes.
Figure 24: BOS gate use by aircraft group size in 2010 (Left) and BOS gate use by Group III aircraft in 2010 [Data Source: Flightstats.com]
A typical example of the underuse of gate width is shown in Figure 25. This gate has an estimated width of 167 feet to accommodate a Group IV sized Boeing 767-300 aircraft. Although this gate occasionally accommodates the B767 aircraft, the majority of aircraft that used this gate in 2010 were Group III sized aircraft, such as the A320 and B737-800. These Group III aircraft have the ability to increase their wingspan to 167 ft without requiring changes to operations or infrastructure. Further strategies in accommodating aircraft of increased wingspan are analyzed in the following chapter.
Figure 25: BOS gate use by aircraft type for a typical gate in 2010 [Data Source: Flightstats.com] II III IV V VI 0 10 20 30 40 50 60 70 80 90 100
Gate Group Size
% Gates Used by Aircraft
Group II Group III Group IV Group V Group VI II III IV V VI 0 10 20 30 40 50 60 70 80 90 100
Gate Group Size
% Gates Used by Group III Aircraft
80 90 100 110 120 130 140 150 160 170 0 50 100 150 200 250 300 350 400 450 500 CR9E75 D95 D94 D9S M88 M90 320 319 73H 738 757 753 763 767 Wingspan (ft)
Number of Aircraft which used the Gate in 2010
4.3 BOS Group III Aircraft Demand in 2010
To get a better understanding of the demand of Group III aircraft at BOS, the collected data split up by aircraft type was analyzed. Of the 111,603 flights by Group III aircraft at BOS in 2010, 35% were by the A319/320, which has a wingspan of 111 ft. 10 in., and 21% by the Embraer 190, which has a wingspan of 94 ft. 4 in. Combined, these two aircraft types comprise 56% of the total Group III aircraft operations. The demand of B737 aircraft at BOS in 2010 was 20% of the total Group III aircraft operations, however, this was split between various wingspans for the B737 family. The B737-300/400/500 (2.5% demand), known as the B737 Classics series, has a wingspan of 94 ft 9 in. The B737 -600/700/800/900, known as the B737 Next Generation series, has a wingspan of 112 ft 7 inches without winglets (9.5% demand), and a wingspan of 117 ft 5in with winglets (8.2% demand). The remainder of the Group III aircraft demand in 2010 is shown in Figure 26. This figure better illustrates the percent of 2010 gate arrivals by Group III aircraft as a function of wingspan
Figure 26: Realized BOS demand for gates by Group III aircraft as a function of wingspan (2010) [Flightstats.com]
Aircraft are scheduled into gates based on gate availability, airline gate ownership, aircraft scheduling, and many other reasons; therefore, as was previously demonstrated in Figure 24, many Group III aircraft utilize oversized gates. Determining the amount by which an aircraft can increase wingspan and remain in its current gate is discussed in the
4.4 Analysis on the Ability of BOS to Accommodate Group III Aircraft
with Increased Wingspan in Existing Gate Infrastructure using
Strategy 1
Using the existing gate infrastructure, the possible increase to Group III aircraft wingspan due to utilization of oversized gates was determined. For each aircraft operation at BOS in 2010, the wingspan of the aircraft was compared to the width of the utilized gate. It was then assumed the aircraft could increase its wingspan by that difference.
4.4.1 Strategy 1A: Potential Increase to Wingspan of Group III Aircraft by Taking Advantage of Entire Width of Utilized Gates
For a given wingspan, the percent of 2010 reported arrivals by Group III aircraft that can be accommodated within existing infrastructure when using Strategy 1A is shown in Figure 27. These results are based of the estimated gate infrastructure based from reported aircraft operations by Flightstats.com. As previously mentioned, since the aircraft continue utilizing the same gate as scheduled, this strategy does not require significant gate infrastructure changes.
Within the Group III sized wingspan, 98% of Group III aircraft utilize gates that can accommodate a 112-ft wingspan. According to the Group III aircraft demand for 2010, in Figure 26, this allows 45% of Group III aircraft arrivals (of the total 111,603 reported arrivals by Group III aircraft in 2010) to increase wingspan by 4-12 ft. This would impact all aircraft operations by aircraft such as the EMB 190 and MD-80.
In addition, 35% of the scheduled Group III aircraft arrivals reported in 2010 can increase wingspan to 124 ft (the wingspan of a B757-300 aircraft). This means that 39,253
recorded aircraft arrivals by Group III aircraft in 2010, out of the total 111,603 reported (therefore 35%), could increase their wingspan to 124 ft without necessitating changes to the existing gate infrastructure.
Once the wingspan increases past 124 ft, the percent of recorded aircraft arrivals of Group III aircraft in 2010 that can continue being accommodated in their utilized gates drops to 10%. At 167 ft, it drops once again to only 3% accommodation until the
maximum increase of wingspan of 197 ft is reached. A Group III aircraft with a wingspan increased above 197 ft at BOS would require some type of gate infrastructure or schedule change.
Figure 27: BOS Possible accommodation of Group III aircraft with increased wingspan for Strategy 1A – Aircraft use the entire width of utilized gate [Data Source: Flightstats.com]
4.4.2 Comparison of Strategy 1A Results
Comparing the results for Strategy 1A using the estimated gate infrastructure inferred by reported aircraft operations by Flightstats.com to the existing gate infrastructure
determined by the BOS AutoCAD model are shown in Figure 28. The estimated gate infrastructure based on reported operations provides conservative results once above a wingspan of 112 ft. The reason for the differences prior to 112 feet are due to the instances where a gate width was overestimated due to undocumented use of adjacent gates. This overestimation of gate infrastructure does not impact the results once past 112 ft. Since the focus of this thesis was to find the impact of increasing wingspan above the current Group III maximum wingspan of 118 ft, this overestimation due to the limitations of inferring gate infrastructure from reported aircraft operations does not have a negative impact on the results. However, care should be taken when analyzing the results for the remaining airports. 0 50 100 150 200 250 300 0 10 20 30 40 50 60 70 80 90 100 Wingspan (ft)
Percent of 2010 Reported Arrivals by Group III Aircraft that Could be Accommodated with the Indicated Wingspan
(111,603 Group III Aircraft Utilized BOS in 2010)
Demand of Group III Aircraft
Figure 28: BOS Comparison of the possible accommodation for Group III aircraft with increased wingspan between inferred (Flightstats) and existing (AutoCAD) gate infrastructure for Strategy 1A - Aircraft use the entire width of utilized gate [Data Source:
Flightstats.com]
4.4.3 Strategy 1B: Potential Increase to Wingspan of Group III Aircraft that Utilize a Larger Available Gate within the Existing Infrastructure.
To determine the maximum ability to accommodate larger aircraft at BOS airport, the previous restriction that an aircraft must remain at the utilized gate was removed. Strategy 2B allows an aircraft to utilize any available gate regardless of airline, gate agreements or terminal locations in order to increase the aircraft wingspan.
There were substantial gains in the number of aircraft that can be accommodated from this strategy as compared to using the scheduled gates as shown in Figure 29. A total of 85% of Group III aircraft could be accommodated with an increased wingspan of 124 ft and 42% at 167 ft. There was a maximum wingspan at 197 ft with 14% accommodation. 0 50 100 150 200 250 300 0 10 20 30 40 50 60 70 80 90 100 Wingspan (ft)
Percent of 2010 Reported Arrivals by Group III Aircraft that Could be Accommodated with the Indicated Wingspan
(111,603 Group III Aircraft Utilized BOS in 2010)
Demand of Group III Aircraft
Strategy 1A: Flightstats Gate Infrastructure Strategy 1A: AutoCAD Gate Infrustructure
Figure 29: BOS Possible accommodation of Group III aircraft with increased wingspan for Strategy 1 – Aircraft use the entire width of utilized gate and Strategy 1B- Use of a larger
available gate at the airport [Data Source: Flightstats.com]
0 50 100 150 200 250 300 0 10 20 30 40 50 60 70 80 90 100 Wingspan (ft)
Percent of 2010 Reported Arrivals by Group III Aircraft that Could be Accommodated with the Indicated Wingspan
(111,603 Group III Aircraft Utilized BOS in 2010)
Demand of Group III Aircraft
Strategy 1A: Entire Width of Utilized Gate Strategy 1B: Utilize Larger Available Gate
![Figure 1: The effect of increasing wingspan on fuel burn for the B737-800 aircraft [Alonso 2012]](https://thumb-eu.123doks.com/thumbv2/123doknet/14108886.466348/14.918.230.650.111.451/figure-effect-increasing-wingspan-fuel-burn-aircraft-alonso.webp)

![Figure 5: Diagram explaining gate apron layout and ground equipment necessary [ACRP 2010]](https://thumb-eu.123doks.com/thumbv2/123doknet/14108886.466348/18.918.201.727.480.964/figure-diagram-explaining-apron-layout-ground-equipment-necessary.webp)


![Figure 11: AutoCAD model of BOS gates to analyze existing gate infrastructure [Data Source: Massport]](https://thumb-eu.123doks.com/thumbv2/123doknet/14108886.466348/27.918.239.682.104.434/figure-autocad-model-analyze-existing-infrastructure-source-massport.webp)


