HAL Id: hal-00297462
https://hal.archives-ouvertes.fr/hal-00297462
Submitted on 26 May 2008
HAL is a multi-disciplinary open access
archive for the deposit and dissemination of
sci-entific research documents, whether they are
pub-lished or not. The documents may come from
teaching and research institutions in France or
abroad, or from public or private research centers.
L’archive ouverte pluridisciplinaire HAL, est
destinée au dépôt et à la diffusion de documents
scientifiques de niveau recherche, publiés ou non,
émanant des établissements d’enseignement et de
recherche français ou étrangers, des laboratoires
publics ou privés.
Fire Weather Index application in north-western Italy
D. Cane, N. Ciccarelli, F. Gottero, A. Francesetti, F. Pelfini, R. Pelosini
To cite this version:
D. Cane, N. Ciccarelli, F. Gottero, A. Francesetti, F. Pelfini, et al.. Fire Weather Index application in
north-western Italy. Advances in Science and Research, Copernicus Publications, 2008, 2, pp.77-80.
�hal-00297462�
www.adv-sci-res.net/2/77/2008/
©Author(s) 2008. This work is distributed under the Creative Commons Attribution 3.0 License.
Advances in
Science and
Research
EMS
Annual
Meeting
and
8th
Eur
opean
Confer
ence
on
Applications
of
Meteor
olo
gy
2007
Fire Weather Index application in north-western Italy
D. Cane1, N. Ciccarelli2, F. Gottero2, A. Francesetti2, F. Pelfini3, and R. Pelosini1 1Regional Agency for Environmental Protection, Arpa Piemonte, Torino, Italy
2Forestry Environment Institute, IPLA S.p.A., Torino, Italy 3Settore Antincendi boschivi – Regione Piemonte, Torino, Italy
Received: 24 January 2008 – Revised: 23 April 2008 – Accepted: 8 May 2008 – Published: 26 May 2008
Abstract. Piedmont region is located in North-Western Italy and is surrounded by the alpine chain and by the Appennines. The region is covered by a wide extension of forests, mainly in its mountain areas (the forests cover 36% of the regional territory). Forested areas are interested by wildfire events. In the period 1997–2005 Piedmont was interested by an average 387 forest fires per year, covering an average 1926 ha of forest per year. Meteorological conditions like long periods without precipitation contribute to create favourable conditions to forest fire development, while the fire propagation is made easier by the foehn winds, frequently interesting the region in winter and spring particularly. The meteorological danger index FWI (Fire Weather Index) was developed by Van Wagner (1987) for the Canadian Forestry Service, providing a complete description of the behaviour of the different forest components in response to the changing weather conditions. We applied the FWI to the Piedmont region on warning areas previously defined for fire management purposes. The meteorological data-set is based on the data of the very-dense non-GTS network of weather stations managed by Arpa Piemonte. The thresholds for the definition of a danger scenarios system were defined comparing historical FWI data with fires occurred on a 5 years period. The implementation of a prognostic FWI prediction system is planned for the early 2008, involving the use of good forecasts of weather parameters at the station locations obtained by the Multimodel SuperEnsemble post-processing technique.
1 Introduction
In the period 1997–2005 Piedmont was interested by 3486 forest fires, with an average interested surface of 3710 ha per annum and 9.6 ha per forest fire (Regione Piemonte, 2007).
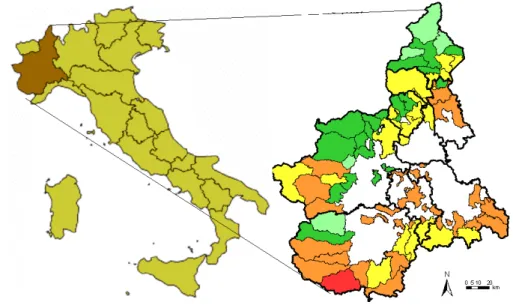
In order to help the planning strategy for the forest fire prevention and extinction a version of the Fire Weather Index FWI (Van Wagner, 1987) was implemented based on the data of the very dense non-GTS weather station network managed by Arpa Piemonte. Sixty warning areas, usually correspond-ing to the mountain valleys or of part of them, were individu-ated, based on the forest fire statistics and on the organisation of the operational forest fire prevention teams (Fig. 1). An accurate statistical analysis was carried on the climatologi-cal data of the station network and a set of primary and sec-ondary weather stations was assigned to each warning area in order to minimise the number of lacking data. For each of these selected weather stations the forest fire indices are cal-culated daily from the data of the previous day and warning
Correspondence to: D. Cane
(daniele.cane@arpa.piemonte.it)
alert maps are produced and distributed to the fire preven-tion network. Warning alert levels are automatically assigned with the help of a system of thresholds.
2 Fire Weather Index
The Fire Weather Index FWI, as described by Van Wagner (1987) is calculated from the weather parameters measured by our weather station network. From these data three sub-indices are calculated describing the current moisture con-tent of three different fuel layers of the forest system (Fine Fuel Moisture Code, Duff Moisture Code, Drought Code, see Fig. 2). From the sub-indices other two indices (Ini-tial Spread Index and Build-up Index) describing the fire be-haviour are calculated, and then from the latter a synthetic index (Fire Weather Index) is finally calculated. Notice that the FWI was introduced for the Canadian plain forests, which differ from the alpine forests for the latitude and height, and are populated by different trees. As a first attempt we adopted the original FWI calculation but we are performing sensitiv-ity studies in order to obtain an evaluation of the indices well suited for our region.
78 D. Cane et al.: Fire Weather Index application in north-western Italy
Figure 1.A map of the Piedmont region with an example of the output of the FWI index (24 July 2007). Light green: no fire danger, green: low danger, yellow: moderate danger, orange: elevate danger, red: very high danger.
Figure 2.FWI scheme.
FWI historical values for Piedmont were calculated for the period 2002–2006 and used to obtain a threshold sys-tem. Within this sequence the fraction of days that we can consider as extreme danger condition (“Very high” danger) was used to detect a discriminating FWI value. This value corresponds to the lower threshold of the extreme danger class. Remaining thresholds, characterized by a decreasing danger level, were defined through a proper scale conver-sion and a geometric progresconver-sion. Monthly thresholds were thus defined for each of the 60 warning areas in which Pied-mont is divided. A calibration of the defined thresholds was implemented for each warning area according to fire risk level, considering especially fire frequency and the localiza-tion of the ignilocaliza-tion points. A first validalocaliza-tion of the thresholds was implemented taking into account the following
statis-tical elements: the recorded fire data, corresponding to the same historical period in which FWI values were calculated (2002–2006), the distribution of days in each danger class per month, the distribution of days with at least one forest fire in each danger class and the distribution of fire frequency in each danger class. The first operational tests on the threshold system gave very good results, with a good match between the calculated alert levels and the actual localization of the forest fires (Fig. 3).
3 Lacking data analysis and handling techniques
The FWI calculation requires a continuous input dataset, be-cause the sub-indices maintain “memory” of the previous days. Our non-GTS network of automatic weather stations has very high levels of liability, but in an operational use the observed data can be missing, due to transmission delays or to sensor failure. The use of primary and secondary stations is then very important in order to fill the lacking data (in the period 2002–2006, they correspond to a mean 3.6% of the wind speed measurements and to 1.8% of temperature mea-surements).
The use of different weather stations for a given warn-ing area can lead to some criticalities in the FWI calcula-tion: in case of switching from a measurement from the pri-mary station to the secondary station, the alert level could change abruptly because of the difference in localization and height of the given stations and then show abrupt changes from one day to another, or significant differences between a given warning area and the surrounding ones.
We then tested and applied the following corrections to the observed data:
Figure 3.An example of operational fire bulletin issued on 29 July 2007. The fire icons show the places where significant forest fires actually occurred. Light green: no fire danger, green: low danger, yellow: moderate danger, orange: elevate danger, red: very high danger.
– the daily temperature profile of all available Piedmont
stations is interpolated with cubic interpolation and the polynomial so obtained is used to shift the tempera-ture values from the secondary station height to the pri-mary station height. This technique minimizes the mean square errors towards the observed data in a more effi-cient way than fixed lapse rate or linear/quadratic inter-polations;
– in order to smooth the fields of precipitation and relative
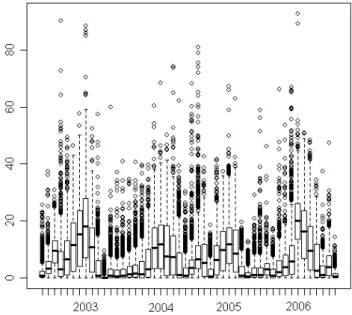
humidity of each warning area, we calculate the mean of the values of all available stations in the given area. Figure 4 shows a comparison between the corrected and un-corrected data, using the boxplot technique as defined by Tukey (1977). The graph shows the first and third quartiles, the median and the number of events exceeding the upper in-ner outlier, corresponding to more or less the 95th percentile. These should be the extreme events, in which a fire could oc-cur. A visual analysis shows that the uncorrected data have a greater variability than the corrected data. The quantiles so calculated could be used as thresholds for the FWI alert
Figure 4. Comparison of annual boxplots of the uncorrected and corrected FWI series in the period 2003–2006.
Figure 5.The box plots of the FWI index calculated for each month in the period 2003–2006.
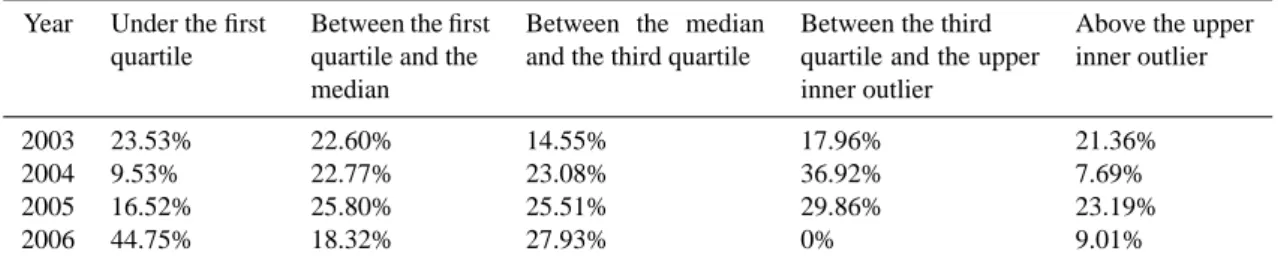
system, thus giving a more statistically-reliable way to cal-culate the thresholds. In Table 1 however we compare the cases of fires occurred in the region with FWI exceeding each monthly quantile (shown in Fig. 5) and the results are not satisfactory: a large number of fires can occur also with very low quantiles. At the present the empirically evaluated thresholds give us more confidence in evaluating the danger level.
4 Conclusions and future developments
The application of the Fire Weather Index to the observed data from our network provides a good diagnostic evaluation of the fire danger situation, compared with the observed fire events. We are planning to improve the quality of this prog-nostic evaluation using analysed data with assimilation tech-niques to get more homogeneous data on the given warning area.
80 D. Cane et al.: Fire Weather Index application in north-western Italy
Table 1.The percentage of observed fires exceeding the box plot quantiles. Year Under the first
quartile
Between the first quartile and the median
Between the median and the third quartile
Between the third quartile and the upper inner outlier
Above the upper inner outlier
2003 23.53% 22.60% 14.55% 17.96% 21.36%
2004 9.53% 22.77% 23.08% 36.92% 7.69%
2005 16.52% 25.80% 25.51% 29.86% 23.19%
2006 44.75% 18.32% 27.93% 0% 9.01%
A threshold system was established empirically by com-parison with the observed fires and is operational at the present. The final validation and the possible further cali-bration of thresholds will be preceded by at least 1–3 years of FWI implementation in the Region.
We are developing a prognostic evaluation based on the weather parameter forecasts.
The direct model outputs, even from high-resolution lim-ited area models, show many strong systematic and random errors in Piedmont, compared to the values observed by our high-density non-GTS network. In previous studies (Cane and Milelli, 2006) we applied the Multimodel SuperEnsem-ble technique (Krishnamurti et al., 1999) on both global cir-culation models and on non-hydrostatic limited-area models to evaluate weather parameters at the station location. We are planning to perform FWI calculation starting from our Mul-timodel SuperEnsemble post-processed forecasts, in order to obtain a 3-days-in-advance forecast of the FWI to be used for the fire prevention system planning purposes.
Edited by: B. Lalic
Reviewed by: one anonymous referee
References
Cane, D. and Milelli, M.: Weather forecasts obtained with a Mul-timodel SuperEnsemble Technique in a complex orography re-gion, Meteorologische Zeitschrift, 15, 2, 207–214, 2006. Krishnamurti, T. N., Kishtawal, C. M., LaRow, T. E., et al.:
Im-proved weather and seasonal climate forecasts from Multimodel SuperEnsemble, Science, 285, 1548–1550, 1999.
Regione Piemonte – Settore Antincendi Boschivi: Piano Regionale per la Programmazione delle attivit`a di Previsione, Prevenzione e Lotta attiva contro gli Incendi Boschivi, 2007
Tukey, J. W.: Box-and-Whisker Plots. in Exploratory Data Analy-sis, Reading, MA, Addison-Wesley, 39–43, 1977.
Van Wagner, C. E.: Development and structure of the Canadian forest fire weather index, Can. For. Serv., Ottawa, Onto For. Tech. Rep. 35, 1987.