Development of Next-Generation Optical Neural Silencers by
Amy Chuong
B.S. in Biology -Cell, Developmental and Molecular Biology Track Massachusetts Institute of Technology, 2009
B.S. in Humanities and Science Massachusetts Institute of Technology, 2009
Submitted to the Program in Media Arts and Sciences, School of Architecture and Planning, in partial fulfillment of the requirements for the degree of
Master of Science in Media Arts and Sciences
MASSACHUSETTS INSTITUTE
at the , OF TECHNeOLOGY
Massachusetts Institute of Technology
DEC
08
2011
September 2011
LIBRARIES
0
Massachusetts Institute of Technology 2011. All rights reserved.ARCHIVES
Author:
Certified by:
Accepted by:
Program in Media Arts and Sciences School of Architecture and Planning
August
5, 2011
Edward S. Boyden, III, Ph.D. Benesse Career Development Professor Program in Media Arts and Sciences, MIT Thesis Supervisor
Mitchel Resnick, Ph.D. LEGO Papert Professor of Learning Research Academic Head Program in Media Arts and Sciences
Development of Next-Generation Optical Neural Silencers
byAmy Chuong
Submitted to the Program in Media Arts and Sciences, School of Architecture and Planning,
on August 5, 2011
in partial fulfillment of the requirements for the degree of Master of Science in Media Arts and Sciences
Abstract
The ability to rapidly and safely silence the electrical activity of individual neurons or neuron populations is invaluable in the study of brain circuit mapping. The expression of light-driven ion channels and pumps allows these pathways to be observed, mapped and controlled with millisecond timescale resolution. We here show that it is possible to mediate the powerful multiple-color silencing of neural activity through the heterologous expression of light-driven
outward proton pumps and inward chloride pumps. We characterized a number of novel opsins through an exploration of ecological and genomic diversity, and further boosted opsin function
and trafficking through the appendage of signal sequences. The green-light drivable archaerhodopsin-3 (Arch) from Halorubrum sodomense and the yellow-light drivable
archaerhodopsin from Halorubrum strain TP009 (ArchT) are able to mediate complete neuron silencing in the in vivo awake mouse brain, and the blue-light drivable proton pump from
Leptosphaeria maculans (Mac) opens up the potential for the multiple-color control of
independent neuron populations. Finally, the principles outlined here can be extrapolated to the larger context of synthetic physiology.
Thesis Supervisor: Edward S. Boyden, III
Benesse Career Development Professor Program in Media Arts and Sciences
Reader:
Hugh Herr, Ph.D. Associate Professor of Media Arts and Sciences MIT Program in Media Arts and Sciences
Reader: z
Chris A. Kaiser, Ph.D. MacVicar Professor of Biology Head of Department MIT Department of Biology
Table of Contents
1. Introduction ... ... 6
1.1 Overview...6
1.2 Neuron electrophysiology ... 8
1.3 M icrobial opsins ... 11
2. Mining Opsin Phylogenetic Diversity... ...13
2.1 Engineering Halo...13
2.2 Phylogenetic opsin screening... ... 18
2.3 Arch implementation in the in vivo rodent brain ... 24
2.4 Multiple-color control of independent neuron populations ... 28
2.5 Discussion ... 30
3. ArchT: a novel, high-light sensitivity neural silencer... . ... 31
3.1 Engineering Arch ... 31
3.2 ArchT implementation in the in vivo rodent and primate brain ... . 35
3.3 Discussion...39
4. Synthetic Physiology: Strategies for Adapting Tools From Nature... 40
4.1 M olecular design and construction... 40
4.2 Transduction of microbial opsins into cells for heterologous expression... 44
4.3 Physiological assays... 48
4.4 Conclusion... 52
5. Summary and Further Work... ... 53
6. Experimental M ethods ... ... ... .... 54
6.1 Plasmid construction and site directed mutagenesis... ... 54
6.2 Neuron culture, transfection, infection, and imaging ... 56
6.3 HEK 293FT cell culture and transfection ... 57
6.4 Lentivirus preparation... 57
6.5 Virus injection in the adult mouse... 58
6.6 In vitro whole cell patch clamp recording & optical stimulation ... 58
6.7 In vivo rodent electrophysiology, optical stimulation, and data analysis...60
6.8 In vivo primate electrophysiology, optical stimulation, and data analysis... 61
6.9 Histology... 63
7. Acknowledgements ... 646... 8. References ... 65
1. Introduction
1.1 Overview
A fundamental challenge in biology is the spatiotemporally precise study and control of complex systems. Classical methods such as physical ablation, electrode stimulation, and genetic
knockout are crude and invasive, while exogenous ligand addition and drug delivery are spatially imprecise due to their diffusible natures. Optogenetics, which combines molecular biology -- in the form of genetically engineering light-drivable proteins - and optical stimulation from
sophisticated light-delivery hardware offers a tantalizing alternative. The heterologous
expression of light-drivable ion channels and pumps such as the depolarizing channelrhodopsin-2 (ChRchannelrhodopsin-2)1 from the algae Chlamydomonas reinhardtil and the hyperpolarizing halorhodopsin (halo/NpHR)2,3 from the halobacterium Natromonas pharaonis allows neural circuits to be
observed, mapped, and controlled with great spatial precision and millisecond timescale resolution.
Although optogenetics is a young field, its scope has rapidly expanded in the past half-decade. The ability to precisely control neural circuits has proven invaluable in understanding complex brain modalities such as aggressionl, anxiety', autism' and drug abuse7, and physiological
processes such as cardiac arrhythmia8 and muscle fiber contractions9. Yet there is still much room for improvement. The high-level, heterologous expression of these proteins in the mammalian brain may lead to intracellular aggregates and possible toxicity, as well as a
significantly lower yield of functional protein. Improving opsin kinetics would extend the length of time that neuronal populations can be silenced, as well as enabling the creation of sustained, high-frequency neuron spike trains. Low light sensitivity is critical to the silencing of larger brain regions, which in turn reduces the invasiveness of surgically implanted optical hardware.
Finally, creating opsins which are responsive to different light wavelengths enables the creation of a spectral toolbox of optical sensitizers, and the multiple color control of independent neuron populations.
This thesis presents three novel optical silencers identified through an exploratory screen of ecological and genomic diversity, and discusses the underlying biological principles. Section 1.1 introduces the importance of optical neural control as well as some major goals and
considerations of opsin engineering. Section 1.2 describes neuron electrophysiology and the electrophysiological techniques involved in optogenetics. Sections 1.3 discusses the larger microbial rhodopsin families in the context of member diversity and protein structure.
Chapter 2 presents two novel optogenetic silencers, known as Arch and Mac, which function as proton pumps rather than chloride pumps. Chapter 3 presents ArchT, an improved version of Arch which was identified through a directed genomic screen for Arch relatives. Chapter 4 discusses some of the principles involved in developing novel optogenetic tools and the ways in which they can be extrapolated to the larger field of synthetic physiology. Chapter 5 presents the
experimental methods. Finally, chapter 6 summarizes the presented work and proposes future directions of study.
1.2 Neuron electrophysiology
Action potential shape and kinetics in the brain are very cell-type dependent, but some
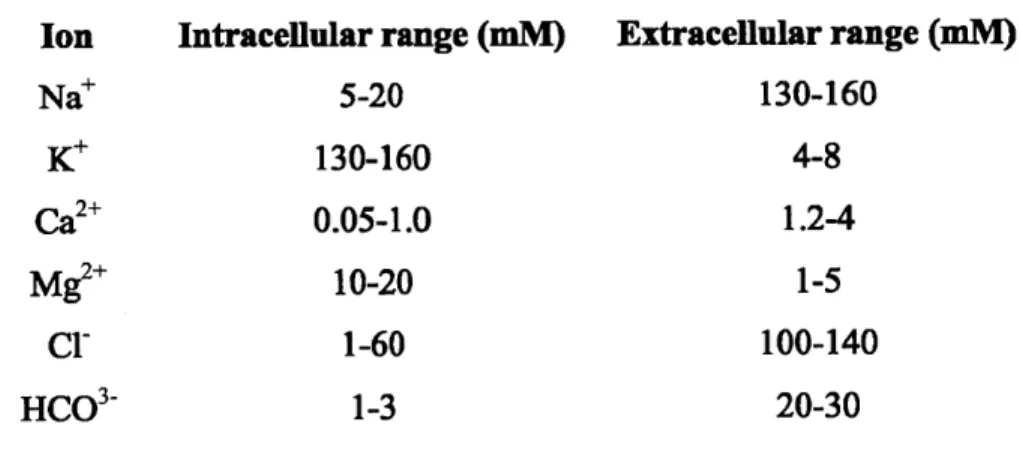
generalizations can be made for all neurons. In its resting state, a neuron has a voltage difference of approximately -60 mV across the cell plasma membrane (Figure 1-1) which is referred to as the resting potential (Vrest). This voltage difference is established by ion pumps and channels which maintain a not-insignificant number of ion concentration gradients (Table 1).
Ion Intracellular range (mM) Extracellular range (mM)
Na* 5-20 130-160 K* 130-160 4-8 Ca2+ 0.05-1.0 1.2-4 M2-+ 10-20 1-5 Cl- 1-60 100-140 HCO3- 1-3 20-30
Table 1.11 Intracellular and extracellular distribution of the main ions found in animal fluids. (Figure adapted from Molleman 20031 0)
The tendency of ions to move with the concentration gradient, or from a region of higher concentration to lower concentration, can be mathematically described as:
AG = -RT in [ion]extracelluiar
[lon]intracellular
where AG is the Gibbs energy released by diffusion, R is the universal gas constant (-8.31 J mol' K-), T is temperature in degrees Kelvin, and [ion]extraceiuar and [ion]imraceiar refer to the
respective extracellular and intracellular concentrations of the given ion.
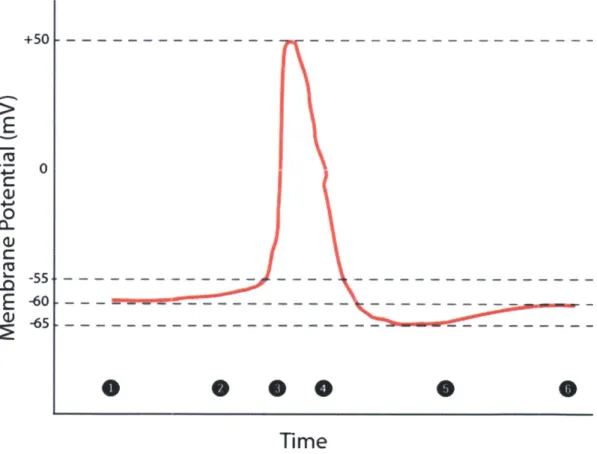
allows that region to reach a voltage threshold of approximately -50 mV (Figure 1-2). This voltage deflection causes additional sodium channels to open. Sodium ions rapidly enter the cell in accordance with the sodium ion concentration gradient, and the rapid influx of positive charge causes the neuron to rapidly depolarize to 0 mV, then overshoot to a level of approximately +50 mV (Figure 1-3). Subsequently, the sodium channel gates close, and voltage-gated potassium channels open (Figure 1-4). The cell then repolarizes, voltage briefly falling below the normal resting potential (afterhyperpolarization) (Figure 1-5), before returning to its initial -60 mV resting state (Figure 1-6).
+501-- --- - --- -
--E
C 0 z-55.E
-600@O
0
Time
Figure 1 | A Neuron Action Potential. (1) Neuron in its resting state. (2) Action potential initiation, cell begins to approach voltage threshold. (3) Rapid depolarization. (4) Voltage gated potassium channels open, causing
repolarization. (5) Afterhyperpolarization. (6) Return to resting state.
Neuron voltage deflections and the corresponding action potentials (or lack thereof) are assessed
---in this thesis by one of two means: whole-cell patch clamp and extracellular record---ing.
Whole-cell patch clamping was developed by Erwin Neher and Bert Sakmarr in the late 1970s", who later won the Nobel Prize in Physiology or Medicine in 1991 for their work. A glass micropipette with an open tip diameter of 1-2 pm is used to approach the cell under study, and
suction is used to first create a high resistance gigaohm seal between the glass and cell membrane, then to rupture the region of cell membrane directly in contact with the glass micropipette opening. The glass micropipette subsequently has access to the cell cytoplasmic space and is referred to as the intracellular electrode. Another electrode is placed in the bath solution to serve as a ground. Recordings are then taken either in voltage-clamped mode
(measuring the amount of current which must be injected in order to maintain a constant voltage difference across the cell membrane), or in current-clamped mode (which maintains a constant amount of injected current while measuring voltage deflections). Both voltage- and current-clamped recordings are standard practice within optogenetics, but this thesis primarily uses voltage-clamped recordings to assess photocurrent. Photocurrent is here defined as the amount of charge generated by ion influx or efflux within the cell as a result of optical stimulation.
In contrast to whole-cell patch clamp, extracellular recording measures extracellular matrix voltage deflections generated by the current fields outside the neuron as a result of action potentials. The activity of one or multiple neurons may be recorded, depending on electrode tip
size and local neuron density, and referred to respectively as "single-unit" or "multi-unit" recordings. While the obtained data has a significantly smaller signal than whole-cell patch clamp, extracellular recording can be conducted in vivo on awake, restrained animals. Further, extracellular recordings can be used to simultaneously determine the signaling state of a neuron population, rather than that of individual cells, and recordings can be carried out for much longer time durations without the time limits cell dialysis imposes on whole-cell patch clamp.
1.3 Microbial opsins
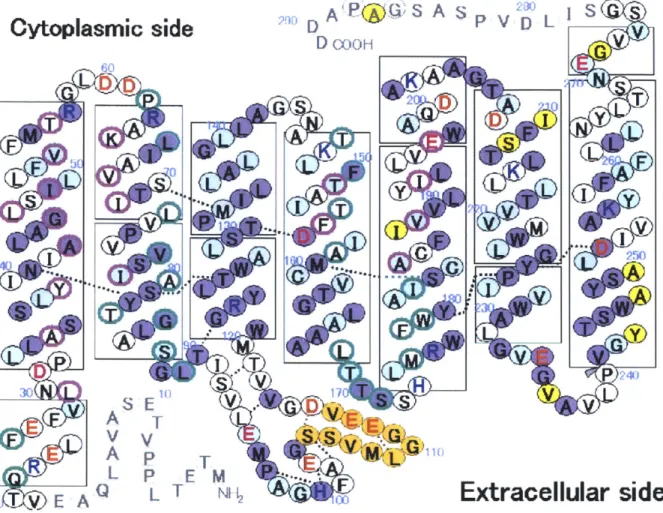
While all members of the opsin superfamily share a highly characteristic seven transmembrane alpha-helical structure and retinal chromophore attached to a conserved lysine residue (Figure 2), primary sequence alignments divide them into two independent protein families: the type 1
opsins which play a role in phototaxis and light-driven ion transport in both eukaryotic and prokaryotic microbial species, and the type 2 opsins, which mediate vision and circadian rhythms in higher eukaryotes. At present, it is unknown whether the two families descend from a single progenitor ancestor or whether they are the product of convergent evolution 2. The presence of type 1 opsins among organisms as diverse as archaea, bacteria, and fungi may either be the result of a shared common ancestor, or horizontal gene transfer within the haloarchaea.
Functionally, type 1 microbial opsins can be divided into transporters and receptors.
Bacteriorhodopsin, one of the most extensively studied of all opsins, was identified by Oesterhelt and Stoeckenius in 1971 '4 from the archaeal Halobacterium halobium and soon determined to be a light-dependent proton pump'. Subsequent work was carried out in Halobacterium to identify
similar light-sensitive proteins and halorhodopsin1'617 8, sensory rhodopsin 119,20,21,22 and sensory
rhodopsin II23,24,25,26,27,28 (also known as phoborhodopsin) were isolated and characterized over the next two decades. Of these, bacteriorhodopsin and halorhodopsin are transporters -- ion pumps which respectively generate proton electrochemical potentials for ATP production and hyperpolarize the cell membrane via chloride transport -- and the sensory rhodopsins serve as "visual" photoreceptors for microbial phototaxis in low oxygen environments.
Cytoplasmic side
D AE(iO
QS A S P V D LD COOH
L P E M \
mTVEA LT NH cExtracellular
side
Figure 2 | Natromonas pharaonis halorhodopsin structure. Schematic of the classic seven-transmembrane helix opsin structure. (Figure adapted from Kouyama et al. 201029)
Extensive structural work has been conducted on the type 1 microbial opsins. Electron
crystallographic analyses of bacteriorhodopsin were carried out by Henderson and Unwin to a resolution of 7
A
as early as 197530. This work was later improved on, yielding a number of electron and x-ray crystallography structures3 1,32,3 3,34,35, culminating in the 1.6
A
structure reported by Luecke and colleagues in 199936. High resolution structures of halorhodopsin have also been obtained for the Halobacterium salinarum strain in 200037,3' and for the Natromonaspharaonis strain in 201029. Finally, sensory rhodopsin II has additionally been crystallized39.
Remarkably, the helix architecture is highly conserved among all four types of type 1 microbial opsins from the same organism, and additionally within orthologs, suggesting a potential underlying architecture that can be engineered across all microbial opsins.
2. Mining Opsin Phylogenetic Diversity
The work outlined in this chapter resulted in the publication of "High-performance genetically targetable optical neural silencing by light-driven proton pumps" in Nature (2010) by Brian Chow and colleagues4 0. My contribution to this project was in the area of gene cloning, virus making, and cell culture transfection.
2.1 Engineering Halo
The heterologous expression of the Natromonaspharaonis halorhodopsin (halo/NpHR) in neurons to achieve light-drivable silencing represented a major stride forward for the
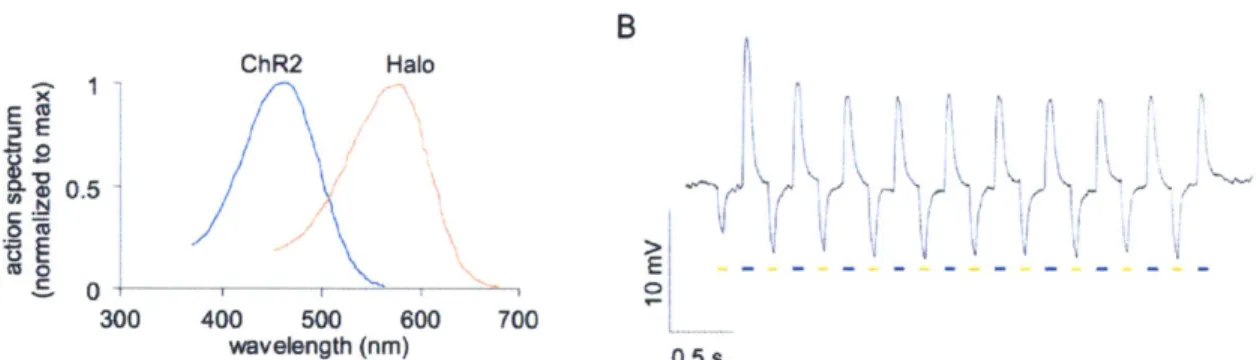
burgeoning field of optogenetics. A hyperpolarizing complement to the depolarizing ChR2 now existed for the first time, allowing the transient silencing of neuron populations and enabling bidirectional signaling within the same cell (Figure 2).
A B
ChR2 Halo
0.5
300 400 500 600 700
wavelength (nm) 0.5 s
Figure 3 1 Single-cell bidirectional signaling using stoichiometric
co-expression of Halo and ChR2. (A) Overlaid peak-normalized action spectra for ChR2 and Halo. (B) Hyperpolarization and depolarization events elicited in a single representative neuron by blue and yellow light pulse trains. (Figure adapted from Han et al 200941)
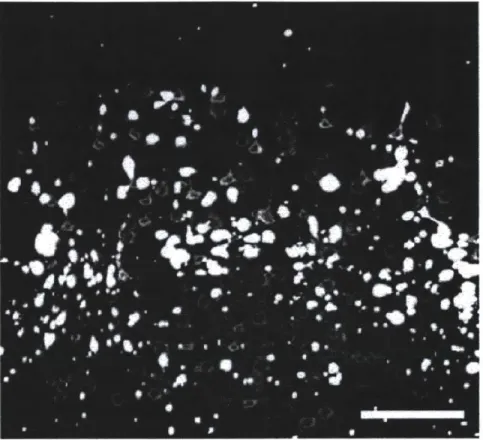
Yet despite its great in vitro promise, Halo still has a number of problems which needed to be solved for in vivo implementation. When expressed at high levels, such as those seen with high titer virus or in transgenic mice, Halo forms puncta and intracellular blebs (Figure 4).
Figure 41 Poor membrane expression and intracellular blebbing in Halo transgenic mice. NpHR-YFP forms numerous intracellular blebs in neurons of Thyl-NpHR-YFP transgenic mice. Scale bars: 100 pm. (Figure adapted from Zhao et al. 20084')
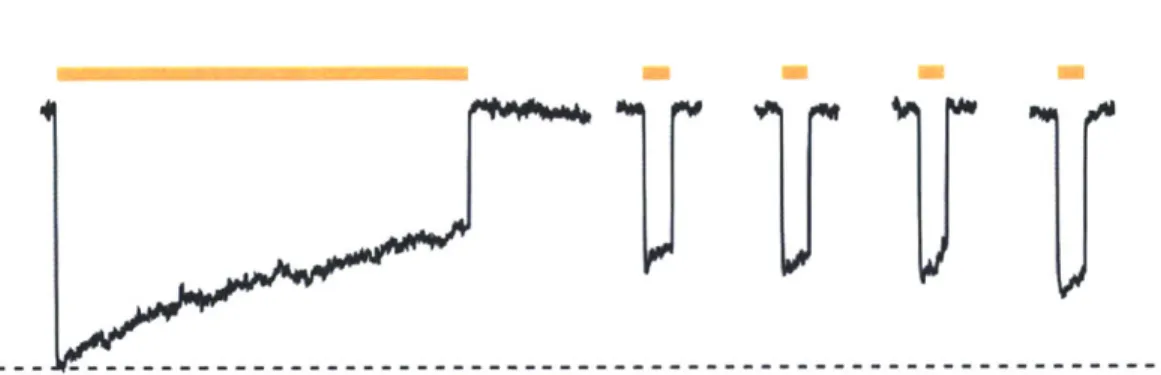
Additionally, Halo's pumping activity -- and with it, its ability to silence neurons -- runs down
and the protein inactivates during long periods of illumination (Figure 5). While this
phenomenon can be addressed via blue-light resets, there are many situations in which it may not be experimentally desirable to have two optics sources. Additionally, it would be advantageous to boost the single-molecule efficacy of Halo, as this would enable the more powerful silencing of individual neurons, and additionally the silencing of much larger brain regions.
10mVL_
5s
Figure 5 1 Halo inactivation during sustained periods of illumination. Time-course of Halo-mediated hyperpolarizations in a representative current-clamped hippocampal neuron during 15 seconds of continuous yellow light, followed by four 1 second test pulses of yellow light (one every 30 seconds, starting 10 seconds after the end of the first 15-second period of yellow light. (Figure adapted from Han & Boyden 20072)
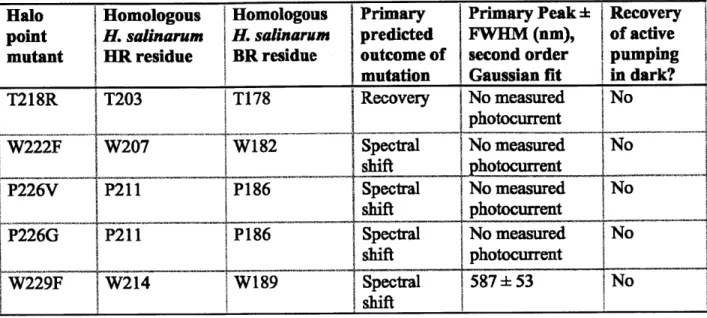
In order to improve upon Halo, we screened a number of trafficking sequences and point mutants in HEK 293FT cells to see if it was possible to achieve spectral shift or to generate a Halo
mutant which could spontaneously recover its active pumping state in the dark over a second timescale without blue-light illumination (Table 2). 'Recovery' residues were targeted based on hypothesized roles in chloride affinities and/or transport kinetics, as determined by structure-function studies and mutagenesis studies using other halorhodopsins4 2,4 3,44,4 . Spectral residues
were targeted based upon their predicted retinal flanking locations based on crystal structures,
37,46,47,48,49,50
Halo Homologous Homologous Primary Primary Peak i Recovery point H. salinarum H. salinaruim predicted FWHM (nm), of active mutant HR residue BR residue outcome of second order pumping
mutation Gaussian fit in dark?
Wild type N/A N/A N/A 584 51 No
T126H T111 D85 Recovery No measured No T126R T111 D85 Recovery No measured No potocurrent W127F W112W86 Spectral No measured No shift hotourrent S130T S130 T89 Recovey 568± 55 No S130D S130 T89 Recovery No measured No otocurrent
SI3IH S130 T89 Recovery No measured No
S130R S130 89 Recovery No measured No
A137T A122 D96 Recovery 585 52 No
A137D A122 D96 Recovery 57553 No
A137H11219 ecvr No measured No
photocurrent _
A137R A122 D96 Recovery No measured No
photocurrent G163C 1G148 G122 Spectral No measured No shift hotocurrent W179F W164 W137 Spectral No measured I No shift hotocurrent S183C F168 S141 Spectral No measured No shift p ourent F187M F172 M145 Spectral 589±52 No shift
F187A F172 M145 Spectral No measured No
shift photocurrent K215H R200 R149 Recovery 586+50 No K215R R200 R149 Recovery 575 51 No K215Q R200 R149 Recovery 585+56 No ~T18S |T203 TRecovery 582 ± 53 No T218D 203 T178 Recovery No measured No photocurrent T218H T203 T178 Recovery No measured No photocurrent
I
' __LHalo Homologous Homologous Primary Primary Peak Recovery point H. salinarum H. salinarum predicted FWHM (nm), of active
mutant HR residue BR residue outcome of second order pumping mutation Gaussian fit in dark?
T218R T203 T178 Recovery No measured No photocurrent SW207 W82 Spectral No measured No shift - 1phtocurrent P226V P211 P186 Spectral No measured No shift photocurrent
P226G IP211 P186 Spectral No measured No
shift photocurrent
W229F W214 W189 Spectral 587 53 No
shift
Table 21 Action spectrum and spontaneous recovery to active pumping state in the dark for N. pharaonis halorhodopsin point mutants examined in HEK293FT cells. (Table adapted from Chow et al. 2010")
We additionally screened a number of signal sequences from the MHC Class I antigen (ss')52,
prolactin ('prl')53, and an ER export sequence from the potassium channel Kir2.1 ('ER2')41' 54 t
see if it was possible to improve Halo photocurrents and trafficking. While photocurrents did improve relative to the wildtype, presumably through improving functional protein yield, we did not observe changes in Halo spectral shift or photorecovery (data not shown).
For these reasons, we thought it would be advantageous to mine genomic diversity to see whether other opsins existed which naturally possessed the properties of interest.
2.2 Phylogenetic opsin screening
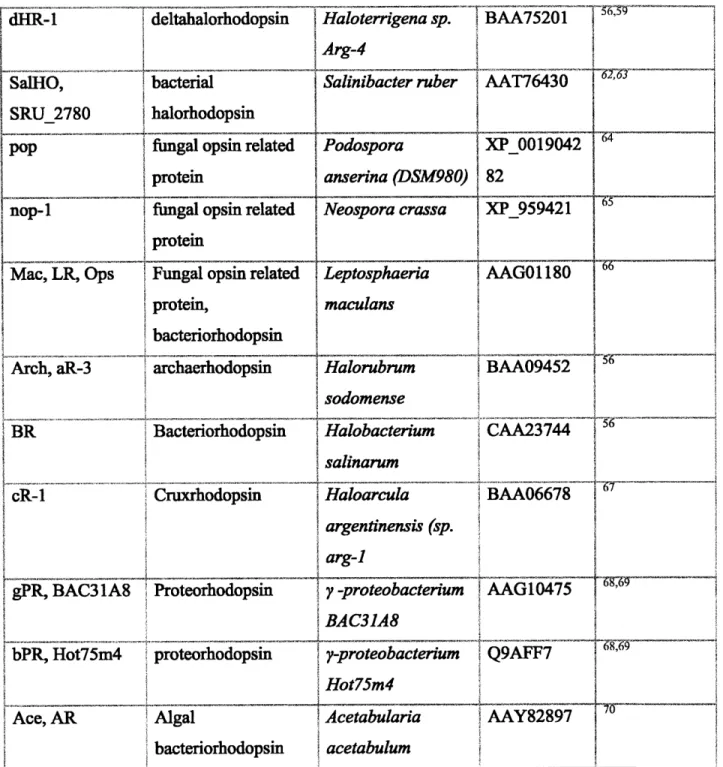
We screened a total of seventeen type I microbial opsins (Table 3) from archaebacteria, bacteria, plants, and fungi to identify light-driven hyperpolarizers which had improved photocurrents and action spectra. Mammalian codon-optimized genes were synthesized, cloned into GFP-fusion expression vectors under the CamKII promoter, and transfected into primary hippocampal or cortical neuron cultures. Opsin photocurrents were measured via whole-cell patch clamp, and additionally reported as photocurrent densities by normalizing for cell-capacitance as a measure of cell size, and spectrum normalized photocurrent densities by adjusting for different opsin
spectral peaks (Figure 6).
400~ Screen photocurrent
-i Screen photocurrent density
-- Spectrum normalized screen photocurrent density -12 @CD
<300 -0 U) 0 - - 8 o CD 0200-- 4 CD C cn. (D C/) 100- - -0 0icb~ d pm F a op
Halorhodopsins- relate prten Bateirhdpsn
denitisorie pupbFar xige opsain Prcru-omaize photcuren
cultured neurons under screening illumination conditions (575 25 nm, 7.8 mW/mm2 for all except Mac/LR/Ops, gPR, bPR and Ace/AR, which were 535
25 nm, 9.4 mW/mm2; n=4-16 neurons for each bar). Data are mean and s.e. Full
species names from left to right: Natronomonaspharaonis2,3,5, Halobacterium
salinarum55'56, Halorubrum sodomense5 6, Halorubrum species ausS-5 -S,
Haloarcula vallismortis58'5 9, Haloarcula marismortuie9', Haloquadratum
walsbyi61, Haloterrigena species Arg-4 '59, Salinibacter ruber62 63, Podospora
anserina", Neurospora crassa65, Leptosphaeria maculans66, Halorubrum
sodomense56, Halobacterium salinarum55,56, Haloarcula species Arg-167,
uncultured gamma-proteobacterium BAC31A8 6 8
,6 9, uncultured
gamma-proteobacterium Hot75m4 and Acetabularia acetabulum70. (Figure adapted
from Chow & Han et al. 201051)
Abbreviations Molecule class Species of origin GENBANK References Accession Halo, NpHR, halorhodopsin sHR, HR halorhodopsin aHR-3 archaehalorhodopsin aHR-1, SGHR archachalorhodopsin cHR-3 cruxhalorhodopsin cHR-5 cruxhalorhodopsin
SquareHOP square halorhodopsin
Natronomas pharaonis Halobacterium salinarum Halorubrum sodomense Halorubrum aus-1 (sp. SG1) AD 05Oo BQz NP_279315 BAA75202 CAA49773 Haloarcula BAA06679 vallismortis Haloarcula AAV46572 marismortui Haloquadratum walysbyi CAJ53165 :x) 58,59 61 50
dHR-1 deltahalorhodopsin Hato rr a BAA75201 Arg-4 SaIHO, SRU_2780 bacterial halorhodopsin
Salinibacter ruber AAT76430 0*
POp fungal opsin related Podospora XP_00042
protein anserina (DSM980) 82
nop-1 fungal opsin related Neospora crassa XP959421
protem
Mac, LR, Ops Fungal opsin related Leptosphaeria AAGO 1180
protein, maculans
bacteriorhodopsin
Arch, aR-3 archaehodopsin Halorubrum BAA09452
sodomense
BR Bacteriorhodopsin Halobacterium CAA23744
salinarum
cR-1 Cruxrhodopsin Haloarcula BAA06678
argentinensis (sp. arg-I
gPR, BAC31A8 Proteorhodopsin y -proteobacterium AAG10475
BAC31A8
bPR, Hot75m4 proteorhodopsin 7-proteobacterium 7Q9AF
Hot75m4
Ace, AR Algal Acetabularia AAY82897
bacteriorhodopsin acetabulum
Table 3 | Summary of molecular screening candidates, including abbreviations, molecule classification, species of origin, GenBank accession number, and references.
Of these constructs, the putative proton pump archaerhodopsin-3 from H.
sodomense (Arch/aR-3)7' generated the highest photocurrents. Two other proton
also had significantly larger photocurrents than the Natromonas pharaonis halorhodopsin. All of the assessed light-driven proton pumps had higher screen photocurrents than the light-driven proton pumps.
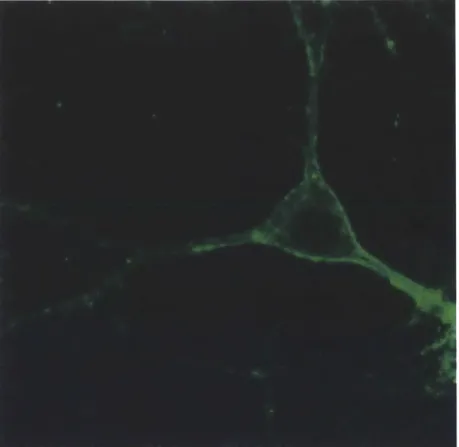
We assessed Arch and Halo membrane expression using confocal microscopy and found that Halo and Arch possessed similar absolute expression levels on the cell plasma membrane5. Unlike Halo, Arch traffics well to the cell membrane without signs of intracellular aggregates (Figure 7).
Figure 7 1 Confocal fluorescence image of a lentivirally infected cultured neuron expressing Arch-GFP under the CamKII promoter.
Arch-mediated currents exhibited excellent kinetics of light-activation (8.8 ± 1.8 ms, n=16) and post-light-recovery (19.3 ± 2.9 ms, n=16). Unlike the wildtype Halo and Halo mutants, Arch
demonstrated a significant dynamic range. At low light irradiances of 0.35 and 1.28 mW/mm2
(Figure 9i), neural currents were 120 and 189 pA, respectively; at higher light powers (at which Halo currents saturate), Arch currents continued to increase, approaching 900 pA at effective irradiances of 36 mW/mm2 (Figure 9ii).
15 s dark 30 s dark 30 s dark 30 s dark 30 s dark
15 s light cDi 1.0 aE 09 I L.. L.C 0.7
0.6
0.5
1 s light 1 s light I M I I I I I 1 s light 1sUI
light light 3s 0 30 60 90 120 150Time from end of
initial
15 second illumination (sec)
Figure 8 | Arch spontaneously recovers pumping post-illumination. Top half shows raw current trace of a neuron lentivirally infected with Arch, illuminated
by a 15-s light pulse (575 ± 25 nm, 7.8 mW/mm2) followed by 1-s test pulses
delivered at 15, 45, 75, 105 and 135 s after the end of the 15-s light pulse. Bottom half of graph shows population data of averaged Arch photocurrents
(n=1 1 neurons) sampled at the times indicated by the vertical dotted lines. (Figure adapted from Chow & Han et al. 201051)
400
Arch
1000
Halo /NpHR
800
300
600 t200 400o 100
.c 200-0 _ _ _ _ _ _ _ _ _ ---- ---- 0 0.1 1 10 0.1 1 10 100Irradiance (mW/mm
2)
Irradiance (mW/mm
2)
Figure 9 1 Arch has significantly greater dynamic range than Halo.
Photocurrents of Arch versus Halo measured as a function of 575 ±25 nm light irradiance in patch-clamped cultured neurons (n = 4-16 neurons for each point), for low (left) and high (right) light powers. The line is a single Hill fit to the data. (Figure adapted from Chow et al. 201051)
2.3 Arch implementation in the in vivo rodent brain
We first estimated the tissue volumes which could be silenced, using in vitro culture data to estimate photocurrents for different irradiances and computational Monte Carlo simulations (Figure 10). We chose 0.35, 1.28, and 6 mW/mm2 in order to simulate irradiance at 1.7, 1.2, or
0.6 mm away from the tip of a 200 pm fiber emitting 200 mW/mm2, and measured the reduction in spike rate for each condition. Arch expressing neurons were significantly more inhibited than eNpH R-expressing cells, suggesting a 10-fold increase in brain tissue volume that would be
~50% silenced.
Irradiance contours at 100, 10, 5, 2.4, 2, 1, and 0.6 mW/mm2
0 500 1000
Distance from Fiber Surface (microns)
1500
Figure 10 | Irradiance contours for 593 nm yellow light in the brain. 593 nm light is plotted as a function of location with respect to the top of a 200 pm fiber emitting 200 mW/mm2 at the fiber tip into gray matter. Light irradiance was
adapted from Chow et al. 201051)
To directly assess Arch's behavior in vivo, we injected encoding for Arch under the CamKII promoter into the mouse cortex and recorded neural responses -1 month later via extracellular recording. We recorded neurons in awake head-fixed mice, illuminating neurons with a 200-pm
optical fiber coupled to a 593 nm laser. The firing rate of many neurons immediately and strongly declined after light onset, and remained low throughout the illumination duration for both brief (Figure 11a, top) and long durations (Figure 11a, bottom).
5 seconds
-1-11- 111I 1 11 Nib seconds _ A. I______ INIII II IIIItill 11. tI
5 seconds 1.5 seconds hI.L.~L~k.)J. .Llip 400 mV 1 minute 20.-10 -5 0 5 c 0% -a -100% *I 1.J1IIIiLIUIi1JLLLJ.1IJLJlL1 1 1L~. £ Time (s) 10 15 20
E
E 0 5 10 15 20 Time (s) % change % changein the fight after the light
(vs. pre-light) (vs. pre-light)
3 +
% reduction In firing rate, for each Individual neuron
(integrated across all 5 second silencing periods)
Figure 11 | High-performance Arch-mediated optical neural silencing of neocortical regions in awake mice. (A) Representative extracellular recordings showing neurons undergoing 5-s, 15-s, and 1-min periods of light illumination. (B) Neural activity in a representative neuron before, during, and after 5 s of yellow light illumination, shown as a spike raster plot (top) and as a histogram of instantaneous firing rate averaged across trials (bottom; bin size, 20 ms). (C) Population average of instantaneous firing rate before, during and after yellow
B
C
light illumination (black line, mean; gray lines, mean + s.e.; n= 13 units). (D) Average change in spike firing during 5-s of yellow light illumination (left) and during the 5 s immediately after light offset (right), for the data shown in B. (E) Histogram of percentage reductions in spike rate, for each individual neuron, integrated across all 5-s silencing periods.
We recorded 13 single-units that showed any decrease in firing during illumination and found spiking rates during exposure to 5 seconds of yellow light (Figure 11b) to drop by an average of 90 : 15% (mean + s.d.; Figure 11c, d) and restoring to levels indistinguishable from the baseline after light cessation (P>0.2, paired t-test; Figure 11d). Six of the 13 units decreased spike rate by at least 99.5%, and the median decrease was 97.1% (Figure 11e). One possibility is that
Arch-expressing cells were almost completely silenced, whereas non-infected cells also decreased activity owing to network activity reduction during illumination.
The kinetics of silencing were rapid: for the six neurons that underwent >99.5% silencing, spike firing reduced with near-0-ms latency, rarely firing spikes after light onset; averaged across all cells, firing-rate reductions plateaued within 229 ± 310 ms (mean ± s.d.) after light onset. After
light cessation, the initial firing rate rapidly restored itself for the highly silenced neurons;
averaged across all cells, firing rates took 355 ± 505 ms to recover after light offset. The level of
post-light firing did not vary with repeated light exposure. Thus, Arch can mediate reliable silencing of neurons in the awake mammalian brain.
2.4 Multiple-color control of independent neuron populations
Great spectral diversity can be found in the proton pumps, in contrast to chloride pumps, which are primarily driven by yellow-orange light. The light-driven proton pump Mac in our screen had an action spectrum strongly blue-shifted relative to the light-driven chloride pump Halo (Figure 12a). We found that Mac-expressing neurons undergo four-fold larger
hyperpolarizations with blue light than with red light, while Halo-expressing neurons undergo three-fold larger hyperpolarizations with red light than with blue (Figure 12b). Accordingly, we were able to demonstrate selective neural silencing in Mac-expressing neurons in response to blue light, and selective silencing of spike-firing in Halo-expressing neurons in response to red light (Figure 12c). It is clear that the spectral diversity of proton pumps enables the possibility of independent multicolor silencing of separate neural populations.
A
-Mac excitation band Halo excitation band
82 E2 0.5
{J400
450
Wavelength (nm)50
55
600
650
700
Bs E r 40- Halo Mac 0 20f ). 30 470 630 470 5.3 2.1 5.3 2.1 Light wavelength (nm) Light irradiance (mW/mrr) C. Halo-expressing neuron Mac-expressing neuron 2 s 1 50 mV -82mV --- --- -65 mVFigure 12 Multicolor silencing of two neural populations, enabled by blue-and red-light drivable ion pumps of different classes. (A) Action spectra of Mac versus Halo; rectangles indicated filter bandwidths used for multicolor silencing in vitro. Blue light is delivered by a 470 ± 20 nm filter at 5.3 mW/mm2
and red light is delivered by a 630 ± 15 nm filter at 2.1 mW/mm2. (B) Membrane hyperpolarizations elicited by blue versus red light, in cells expressing Halo or Mac (n = 5 Mac expressing and n=6 Halo-expressing neurons). (C) Action potentials evoked by current injection into patch-clamped cultured neurons transfected with Halo (top) were selectively silenced by the red light, but not by the blue-light and vice-versa in neurons expressing Mac (Middle). Grey boxes in the inset (bottom) indicate periods of patch-clamp current injection. (Figure adapted from Chow et al. 201 051)
2.5 Discussion
Arch and Mac represent members of a new, diverse and powerful class of optical neural silencing reagent: the light-driven proton pump. The efficacy of these proton pumps is
surprising, given that protons occur at a million-fold lower concentration in mammalian tissue than the ions carried by other optical control molecules.
Extensive work has been done in the optogenetic field with the goal of engineering opsin structure to obtain certain properties. However, this work suggests that a much simpler alternative may be mining ecological and genomic diversity to find naturally-occurring
molecular reagents. These opsins may possess desirable properties difficult to engineer, such as the proton pumps' spontaneous recovery after optical activation, and their wide diversity lends itself to spectral diversity which would enable the multiple-color control of independent, discrete neuron populations. Further, structure guided mutagenesis of Arch and Mac may further
facilitate the development of neural silencers with altered spectrum or ion selectivity, and lends itself to a better understanding of proton pumps, as well as the larger opsin family.
3. ArchT: a novel, high-light sensitivity neural silencer
The work outlined in this chapter resulted in the publication of "A High-Light Sensitivity Optical Neural Silencer: Development and Application to Optogenetic Control of Non-Human Primate
Cortex" in Frontiers in Systems Neuroscience (2011) by Xue Han and colleagues72. My
contribution to this project was in the area of gene cloning, virus making, cell culture transfection, and assessing the effect of different protein trafficking sequences.
3.1 Engineering Arch
In our previous work, we found that the light-driven outward proton pump archaerhodopsin-3 (Arch) was capable of mediating strong, reliable, and safe neural silencing in response to green-yellow light, likely due to its good functional expression in neurons, fast photocycle, rapid post-illumination recovery kinetics, and the excellent proton handling capability of neurons4". We next embarked upon a number of strategies to improve Arch including targeted residue
mutagenesis, the addition of trafficking sequences, and additional phylogenetic screening. While targeted mutagenesis either significantly reduced or did not alter Arch photocurrents (data not
shown), we explored the neural silencing capability of opsins with a high sequence homology to Arch, cloned from various archeal species within the Halorubrum genus. All electrogenetic members of this opsin class, known as archaerhodopsins, expressed cleanly and well on the
neuron cell plasma membrane and demonstrated large hyperpolarizing currents when expressed in primary rodent neuron culture (Figure 13).
'E
800
"Arch"
"ArchT"
D-C)c
... 600
6
.1
400
-O
c
200
~'
aR-1
aR-2 aR-3
aR-4 aR-TPOO9 aR-BD1
Halorubrum
archaerhodopsins
Figure 13|I Archaerhodopsin screen photocurrents. Screen photocurrents generated by various opsins within the archaerhodopsin class, as assessed in neuron culture (n = 5-16 neurons for each bar), measured by whole-cell voltage
clamp under 7.8 mW/mm2, 575±25 nm illumination. Full names from left to right: archaerhodopsin from Halorubrum strain aus- 1 (aR-1), archaerhodopsin from Halorubrum strain aus-2 (AR-2), archaerhodopsin from Halorubrum
sodomense (Arch), archaerhodopsin from Halorubrum strain xz5 15 (aR-4),
archaerhodopsin from Halorubrum strain TPO09 (aR-TPO09, aka ArchT), archaerhodopsin from Halorubrum xingjianense (aR-BD 1). (Figure adapted
from Han et al. 20117)
Like Arch, all of the screened archaerhodopsins exhibited rapid photocurrent rise and fall
kinetics during illumination, as well as good post-illumination recovery (data not shown). All of the archaerhodopsins exhibited similar action spectra to that of Arch and were proton pumps as evidenced by photocurrent in the absence of sodium, potassium, calcium and chloride ions. The archaerhodopsin from Halorubrum strain TPO09, which we named ArchT, had the highest of all screened photocurrents. Although Arch and ArchT have highly similar sequences which are homologous by 91.9% (Figure 14), ArchT has an action spectrum slightly red-shifted relative to
Arch and exhibits a 3.3-fold increase in light sensitivity over Arch (Figure 15), with a similar maximum current to Arch (~900 pA in vitro) and similar photocurrent rise and fall kinetics.
MDPIALQAGYDLLGDGRPETLWLGIGTLLMLIGTFYFLVRGWGVTDKDAREYYAVTILVP MDPIALQAGYDLLGDGRPETLWLGIGTLLMLIGTFYFIVKGWGVTDKEAREYYSITILVP GIASAAYLMFFGIGLTEVTVGGEMLDIYYARYADWLFTTPLLLLDLALLAKVDRVTIGT GIASAAYLSMFFGIGLTEVTVAGEVLDIYYARYADWLFTTPLLLLDLALLAKVDRVSIGT LVGVDALMIVTGLIGALSHTAIARYSWWLFSTICMIVVLYFLATSLRSAAKERGPEVAST LVGVDALMIVTGLIGALSHTPLARYSWWLFSTICMIVVLYFLATSLRAAAKERGPEVAST FNTLTALVLVLWTAYPILWIIGTEGAGVVGLGIETLLFMVLDVTAKVGFGFILLRSRAIL FNTLTALVLVLWTAYPILWIIGTEGAGVVGLGIETLLFMVLDVTAKVGFGFILLRSRAIL ******** ********************** ****************** ************ 60 60 120 120 180 180 240 240 h GDTEAPEPSAGADVSAAD 258 hT GDTEAPEP--- 248
Figure 14 | Arch and ArchT have significant sequence homology. Alignment was done using the ClustalW2 pairwise sequence algorithm created by Thompson
73 and colleagues 600
-5-00
Arch
5001 -o-ArchT 400 300 200 100 0 1 2 3 4 5 6 7 1000 900 800 * 700 600 --500 400 300 200 100 0 0 10 20 Irradiance (mW/mm2' A = 575 +/- 25 nm)Figure 15 1 ArchT is a novel, high-light sensitivity optical neural silencer. Photocurrents of Arch and ArchT measured as a function of 575 ±25 nm light irradiance (n = 4-16 neurons for each point); curves are Hill plots. (Figure adapted from Han et al. 201172)
Arch ArchT Arch ArchT Arch ArchT Arch ArchT Arc Arc 30 40
We did not examine irradiances greater than 36.3 mW/mm2 (the rightmost datapoint in Figure 15), but we would expect a similar maximum degree of inhibition between neurons expressing Arch and ArchT, but a significantly larger silenced brain volume with ArchT given that irradiances as higher as 200-500 mW/mm2 are used in vivo. According to our earlier
computational models (Figure 10), a three-fold improvement in light sensitivity would increase the tissue volume addressed by a typical single optical fiber two-fold, making ArchT of instant utility for silencing larger brain volumes. From this, we concluded that ArchT could mediate fast hyperpolarization of neurons with excellent light sensitivity.
3.2 ArchT implementation in the in vivo rodent and primate brain
We next made ArchT lentivirus, targeting expression to cortical pyramidal neurons of the murine brain under the CamKII promoter. We found that ArchT trafficked well to the cell membrane and, additionally, expressed rapidly and well along axonal projections traveling far from the cell body, suggesting possible utility in silencing defined projection pathways between different brain regions.
Encouraged by ArchT's high-light sensitivity and good trafficking, coupled with the success of earlier optogenetic non-human primate experiments74, we used the aforementioned lentivirus to genetically target ArchT to cortical pyramidal neurons of the cortex of the rhesus macaque. Histological examination of ArchT-expressing neurons in cortical tissue from one monkey
showed that neurons appeared healthy and expressed ArchT well at a timepoint 1 month after viral injection (data not shown). When cortical neurons in a second monkey were recorded
during illumination with a fiber coupled to an inexpensive 532 nm laser (fiber tip irradiance 100-200 mW/mm2) 1-3 months after viral injection, clear ~100% light-mediated silencing of neural
activity was observed in the majority of recorded cells (Figure 16a, b) with a median resultant firing rate of 0 spikes/s among the neurons which showed any decrease in firing upon light delivery (Figure 16c).
}-* 1 0: 1 2 3 4 5 6
n=45 neurons
-1 0: 1 2 Time (s) Sc C = -2 -1 0 1 2 Time (s) 3 4 5 6 C 3 4 5 6 evi..mF1~
95 90 Peak reduction in 85 80 firing rate(%)
Figure 16 1 ArchT-mediated silencing of cortical neurons in the awake
C C 25- 20- 15-10+ 0 100
fHT=F -R.
--- 4 1primate brain. (A) Neural activity in a representative silenced neuron in the primate brain before, during and after 1 s of green light illumination. Neural activity shown as a spike raster plot (top), and as a histogram of instantaneous
firing rate averaged across trials (bottom; bin size 20 ms). (B) Histogram of instantaneous firing rate, averaged across all silenced single units recorded upon 1 s green light exposure either using raw firing rate data (top) or using firing rate data normalized to baseline firing rate (bottom). (C) Histogram of peak
percentage reductions in spike rate, for each individual silenced neuron. (Figure adapted from Han et al. 201172.)
Interestingly, 7 of the 74 recorded neurons did not show reductions in firing rate during
illumination but instead underwent significant increases in spiking activity during light-delivery to ArchT expressing pyramidal neurons. These cells increased their firing rate by a median of 2.9 fold (range 2.0- to 10.6-fold; Figure 17). These neurons began spiking with a latency of 280 ms after light onset, significantly longer than the latency for initiating optical quieting of the primary population of light-silenced neurons (p<0.01, Mann-Whitney U-test). These increased-activity neurons were recorded at locations that were interspersed amongst the locations where silenced neurons were recorded.
A
N I25 0B
n=7 neurons
F 20 10 0 -- -- ---2 -1 0 1 2 3 4 5 6 Time (s) *.L12 0 8 4 0 e -2 -1 0 1 2 3 4 5 6 Time (s)Figure 17 ArchT silencing causes a firing-increase in a small percentage of neurons. (A) Neural activity, shown as a spike raster plot (top) and as a
histogram of instantaneous firing rate averaged across trials (bottom; bin size 20 ms). (B) Histogram of instantaneous firing rate, averaged across all increased-activity single units recorded upon 200 ms green light exposure, either using raw firing data (top) or using firing rate data normalized to baseline firing rate
(bottom). Black line, mean; gray lines, mean ± standard error; n=7 increased activity single units. (Figure adapted from Han et al. 201172.)
We used spike waveform shapes to analyze the cell-type identity of the silenced and increased-activity neurons. Six of the 45 silenced neurons had narrow spike waveforms with trough-to-peak durations of 100-200 microseconds, suggestive of putative inhibitory neurons, whereas the
remainder had broader spike waveforms, suggestive of putative excitatory neurons'5. Three of the seven increased-activity neurons had narrow spike waveforms, suggestive of inhibitory neurons7 5. Thus, it is likely that both the silenced and increased-activity populations of neurons comprised mixed populations of pyramidal cells and inhibitory cells.
3.3 Discussion
We here present a novel optical neural silencing tool that expresses well on the neuron cell membrane, with good axonal expression, and operates well in the context of the awake
mammalian brain. Like Arch, ArchT supports light-driven quieting of neural activity with high efficacy and fast kinetics, utilizing inexpensive 532 nm lasers for illumination. The key
difference is that ArchT has >3x improved light sensitivity relative to Arch at lower light powers from 1-10 mW/mm2, something of critical importance for silencing large brain volumes with a single fiber: a system in which light falls off rapidly and geometrically.
4. Synthetic Physiology: Strategies for Adapting Tools From Nature
This chapter was published elsewhere as "Synthetic physiology strategies for adapting tools from nature for genetically targeted control of fast biological processes" in Methods in Enzymology (2011) by Brian Chow, myself, Nathan Klapoetke and Edward Boyden'.
4.1 Molecular design and construction
We here identified a number of opsins from genomic databases by searching for proteins with similar amino acid sequence homology to previously characterized opsins. This method can be
extrapolated to the larger goal of developing synthetic physiology tools. A number of microbial opsins have been identified at a genomic level in the forty years since the class was first
identified, yet only a subset of these molecules have been characterized at a physiological level.
De novo gene synthesis has proven important for rapid construction of opsin DNA from
sequences derived from genomic and transcriptomic databases2,40. One can obtain a gene codon-optimized to the target organism 77'7879 within a few days to weeks of sequence identification. Codon optimization is useful for heterologous expression of these genes, which are originally isolated from algae, bacteria, and other non-animal species. De novo gene synthesis additionally allows the elimination of restriction sites within the gene to ease later molecular cloning steps, for example, by enabling fusion of a fluorescent protein tag to the molecule, adding trafficking sequences, or adding a cell type-specific promoter to the gene to delimit the expression to specific cells within the target organism.
After gene synthesis, the next step is to alter the gene as needed, or to append extra sequences to optimize its function toward a directed physiological control goal. A few opsin crystal structures have been obtained80 ,3 7,36,81,82,83 and decades of studies have been performed in which specific residues within opsins were mutated, followed by spectroscopic or physiological characterization of the resultant mutated opsins84'49-50'85'4'47'86'87'88'89'90'51. These datasets have proven influential
in guiding the strategic engineering of these molecules through site-directed
mutagenesis 91,92,93,40,94 , enabling the creation of molecules with improved trafficking, or faster or slower kinetics. Antibodies for localizing many of these opsins in an immunocytochemical
fashion are not yet commonly available, so tagging the proteins with a fluorophore or a known antibody epitope is helpful to efficiently determine which cells within the target organism are expressing the opsin. Such tagging additionally yields critical information about the membrane trafficking and localization of opsins within cells - indeed, fluorophore localization to the plasma membrane of opsin-fluorophore fusions has been used to predict photocurrent magnitude, as measured through electrophysiology characterization 93.
We have previously reported a method for quantifying membrane localized proteins in neurons0, based on a Gaussian-blur-based technique developed for the same purpose in HEK293 cells93. This method is useful for quantifying protein localization in the cells, but it does not provide information on whether the protein is properly folded and functional within the membrane. Ultimately it is the number of functional proteins in the membrane which determines their overall physiological control efficacy. Since these molecules, when expressed in neurons or other animal cells, are often in a very different lipid environment than the one they evolved to function in, even a properly folded molecule in a lipid membrane may not be fully functional. As a concrete example, photocurrent enhancement of an opsin by appending the flanking
sequences of the KiR2.1 protein95 boosts the membrane expression of opsins as observed through microscopy, but may boost the photocurrent even more than might be expected from the cellular appearance alone: this appearance-current discrepancy may vary from opsin to opsin. Indeed, KiR2.1 sequences may even decrease overall cellular expression for some opsins, even as it increases the amount of properly folded functional membrane-embedded protein. Thus,
quantitative confocal microscopy must be supplemented by a functional, physiological assay. This theme -- that there are few proxies for function in the assessment of synthetic physiology tools -- is partly why they are hard to find, engineer, and assess.
It is important to realize that the complexity of these molecules means that even an innocuous change like creating a fusion protein between an opsin and a fluorophore may modulate the function of the opsin. Several laboratories have observed that fluorophore fusions with a target molecule can alter performance of the target molecule by altering viral titer96. Appending different fluorophores (e.g., EGFP vs. mCherry vs. ECFP) to an opsin can result in different appearances (e.g., due to mCherry's greater tendency to aggregate than EGFP or ECFP) and
potentially different photocurrent for a given cell type. In the event that fusion of a fluorophore to a given opsin is undesirable, alternatives exist to directly fusing fluorophores to opsins, while still enabling identification of cells expressing the opsin, including interposing IRES (internal ribosome entry sites) or 2A sequences ('self-cleaving' linkers first identified in foot-and-mouth-disease virus) between opsins and fluorophores. Protein expression levels for the gene that
appears after the IRES is often a small fraction of that of the gene before the IES97'98'99'100. 2A sequences in principle yield highly stoichiometric amounts of translated protein, but in reality, different functional levels may be observed for the pre- and post-2A proteins, due to alterations in protein trafficking or function that result from the residual amino acids of the 2A sequence left behind after protein translation41.
The use of trafficking sequences, export motifs, and other signal sequences is useful for improving the heterologous expression of opsins in the cells of target organisms, since the function of opsins in neurons is primarily achieved when opsins express on the plasma
membrane. Practically all opsins come from organisms whose membrane structure and overall cellular architecture is different from neurons. For example, N. pharaonis halorhodopsin photocurrents can be enhanced several fold in mammalian cells by appending the N- and C-terminal sequences of the human KiR2.1 potassium channel protein, which are responsible for
endoplasmic reticulum-export and Golgi-export (although, see alternative explanations of the role that these KiR2.1 sequences play in boosting cellular expression, above)' 02"03,104,95. The
enhancement offered by a given exogenous trafficking sequence is opsin-dependent. A trafficking sequence that boosts N. pharaonis halorhodopsin expression levels (the ER2 sequence54) has no effect on improving the currents of the H. sodomense archaerhodopsin-3,
although adding a different sequence (the Prl sequence, derived from the prolactin secretion targeting sequence) does improve archaerhodopsin-3 expression and photocurrent 0. Through experimenting with combinatorial addition of N- and C-terminal signal sequences, we have found adding multiple signal sequences does not necessarily improve expression in a linear way, perhaps owing to interactions between the multiple trafficking mechanisms at play. It should be noted that opsins may also possess intrinsic, even covert, sequences that enable them to be expressed very well on the plasma membrane. For example, the light-driven outward proton pump archaerhodopsin-3 from H. sodomense (and, in general, members of the archaerhodopsin
class of opsins) naturally expresses rapidly and well on plasma membranes4 0. Opsin mutagenesis and chimeragenesis has pointed towards candidate amino acids that may play a critical role in opsin trafficking and expression on the plasma membrane92,93
4.2 Transduction of microbial opsins into cells for heterologous expression.
The analysis of the potential power of a given microbial opsin to control the voltage or ionic composition of a target cell type should ideally be performed in the target cell type itself, or in a testbed cell type as similar as possible to the target cell type. For example, the trafficking-enhancement and protein folding trafficking-enhancement sequences described above are derived from specific species, and were optimized in cells from specific species; accordingly, they may not work equally well in species different from the source species, or in cell types greatly different from the cell types used to assess and optimize the sequences. Similarly, the covert trafficking sequences found within opsins may not function equally well in all cell types. As a concrete
example, the H. salinarum bacteriorhodopsin has long been considered a difficult protein to express in E. colil05, but it expresses readily in mammalian neurons, and can mediate
biologically meaningful photocurrents*0. Similarly, channelrhodopsin-2 does not express well in
E. coli, but expresses well in mammalian neurons. Conversely, proteorhodopsins from
uncultured marine gamma-proteobacteria express and function well in E.coli, but do not generate photocurrents in HEK293 cells or mouse neurons40, despite a rudimentary degree of expression of the proteorhodopsin protein in these mammalian cells. Thus, reliance on a single heterologous expression cell type (e.g., E. coli, yeast, Xenopus oocytes, HEK cells) as the sole testbed for characterizing opsin physiological function, may lead to a partial picture of how well the opsins assessed will perform across the broad set of cell targets confronted in biology. Similarly, screening for enhancing mutations, trafficking sequences, or other beneficial modifications, using a single heterologous expression cell type, may lead to unintentional optimization of the opsin for function in that particular cell type, and potential deoptimization of expression, trafficking, or function in other cell types of interest within the ultimate tool usage spectrum.
If mammalian neurons in the living mouse or rat are the target, then mammalian neurons in primary culture should be at some point used to assess the function of a given opsin*0', although ideally in vivo assessment should be performed as well, given the very different state of neurons
in vivo vs. in vitro. It is important to note that different types of neurons, at different ages, may
mouse hippocampal and cortical primary cultures because they contain representatives of some of the major cell classes in the brain'. However, primary neuron cultures are laborious to prepare and maintain, and so we and others use HEK293 cell lines to perform electrophysiological
characterization of opsins40,92,106,93. HEK cells are more robust, and easier to work with, than neurons, and can be grown for multiple cell division cycles in culture, unlike neuron cultures which do not replicate after plating and differentiation. In addition, HEK cells possess cellular shapes and molecular phenotypes that are somewhat less variable than those of neurons, and possess fewer active conductances than do neurons; both of these features help reduce variability of opsin characterization measurements. Conversely, HEK cells may yield smaller photocurrents than do neurons due to their smaller surface area, and may have limited utility in fully predicting how well a protein will traffic in neurons. As a simple example of this latter point, HEK cells do not possess axons or dendrites; some findings have been published claiming that certain opsins preferentially traffic to the synaptic processes of neurons'07, and any such effects would not be
observable in a IEK cell. However, HEK cells are still extremely useful for performing fast screening assays of whether there is any physiological effect of illuminating a given opsin, and may be particularly useful for characterization of amplitude-normalized features of opsins such as the action spectrum, the plot of the relative photocurrent observed upon delivery of light of different colors.
Transfection is the simplest and fastest way to get DNA that encodes for opsins into cells, for rapid characterization of opsins in a cellular context For HEK cells, transfection can increase the likelihood of delamination from the substrate; the use of Matrigel to promote cell adhesion to a glass coverslip when plating, as opposed to poly-lysine, is suggested. Well-dissociated HEK cells that are spatially separated from one another are critical for high-quality
electrophysiological assays, as HEK cells that grow together can form gap junction-connected syncytia that can preclude accurate electrophysiological analysis of expressed opsins, by compromising voltage-clamp fidelity. In order to improve the quality of HEK cells for
physiological assessment, passage the cells for their final plating when they reach medium levels of confluence (~50%); then, during the fmal plating step, trypsinize the HEK cells, resuspend the cells in serum-free media and pipette the cells against the sidewalls of the dish or flask to break up clumps of cells, perhaps triturating the cells with a fine-gauged sterile needle (e.g., <5 times
to avoid excessive mechanical force on cells, through a -31 gauge needle), and then add serum-containing media (to halt the trypsinization) before plating the final mixture on glass coverslips. For neuron culture, mouse or rat hippocampal or cortical neurons should be cultured from PO pups or E18 embryos at moderate densities, using standard protocols40. Multiple experimenters in our laboratory have independently found that the best recordings from opsin-expressing neurons are often from ones in areas of sparse neuron density, often at the edge of the area occupied by cells. The preferred method for HEK and neuron culture transfection is calcium phosphate precipitation of DNA, e.g. using commercially available kits. The calcium phosphate precipitation-based process can be harsh on neurons; accordingly, precautions should be taken.
The best transfection rates in neurons, in our hands, are achieved when neurons are transfected 3-4 days in vitro, with rapidly diminishing efficiency beyond then (although the genes encoding for quickly and highly expressed proteins, like Arch, can be delivered at 5 days in vitro).
Viral vectors can also be useful for assessing opsin function, because they can result in a high yield of opsin-expressing cells in a cultured cell environment, and they can also be used to insure a precise gene dosage into a cell of interest. They present lower neuron toxicity at a higher cellular yield than can commonly be achieved with calcium phosphate transfection. One key consideration is that recombination can be a major issue when preparing viral vectors, due to the presence of repetitive sequences within the genomic vector of the virus, i.e. the
payload-encoding plasmid. In theory any E. coli with loss of function mutation in rec gene(s) should be
suitable for growing up such plasmids. However in our experience working with lentiviral plasmids, Stbl3 (recA13-) E. coli have a much lower rate of recombination compared to other rec- cells such as XL1-Blue (recAl-). XL10-Gold E. coli may work as well, with AAV
plasmids. It is recommended to try out different types of rec- cells to find the optimal one for a particular viral vector, as recombination events can cause loss of vectors, and require
time-consuming plasmid reconstruction. It is also important to check if any special considerations are needed for utilizing these specialized viral plasmid-optimized competent cell lines. For example Stbl3 is endA+, and thus the endA endonuclease will need to be removed with appropriate washing when purifying the DNA, to prevent DNA degradation. To check for recombination, viral plasmids should regularly be verified in both sequence and topology, using DNA
sequencing short regions, such as the cloned insert, will only inform whether the sequence is locally correct, while recombination can occur between unpredictable locations, so that the cloned sequence is largely locally correct but different in global topology. Therefore it is highly recommended to perform multiple restriction digests to verify that the global sequence topology has not deviated from the designed plasmid. When cloning payloads into viral vectors, it is
important to use only parent vectors that have also been tested for recombination, and it is important to perform both sequencing and restriction digests periodically as a viral plasmid stock is generated and propagated, ideally minimizing the number of generations that a stock is