TECHNICAL NOTE
Spectrophotometric quantification of lactose in solution
with a peroxidase-based enzymatic cascade reaction system
Sara Fornera&Kenjiro Yazawa&Peter WaldeReceived: 30 June 2011 / Revised: 2 August 2011 / Accepted: 2 August 2011 / Published online: 16 August 2011 # Springer-Verlag 2011
Abstract A spectrophotometric assay was developed for the quantification of lactose in aqueous solution via a one-pot enzymatic cascade reaction at 25 °C and pH 7.2. Lactose (0.2– 1.8 mM), E. coliβ-galactosidase (β-Gal), Aspergillus niger glucose oxidase (GOD), horseradish peroxidase (HRP) and o-phenylenediamine (OPD) were incubated, and the increase in absorbance at 417 nm (A417) due to the formation of DAP
(2,3-diaminophenazine), the dimeric oxidation product of OPD, was followed. The increase in A417 was found to
depend linearly on the initial lactose concentration via three consecutive but simultaneously occurring enzymatic reaction steps catalyzed byβ-Gal, GOD, and HRP. No pre-incubation of lactose withβ-Gal is needed with this simple lactose assay. Keywords Lactose .β-Galactosidase . Glucose oxidase . Horseradish peroxidase . o-Phenylenediamine .
Enzymatic cascade reaction
Introduction
Enzymatic cascade reaction systems have been used for many years for the quantitative spectrophotometric deter-mination of various analytes (metabolites) in aqueous
solution [1]. In most cases, the last step involves an oxidoreductase that catalyzes the so-called indicator reac-tion, which can be monitored with a spectrophotometer [1]. This indicator reaction is either (a) a coenzyme-dependent enzymatic reaction in which the oxidation state of the added coenzyme leads to a change in the absorption spectrum of the coenzyme (typically the oxidation of NADH to NAD+, monitored at 340 nm), or (b) a peroxidase-catalyzed oxidation of added aromatic peroxidase substrates to yield colored reaction products [1,2]. This latter indicator system is applicable to enzymatic cascade reactions in which the penultimate reaction results in the formation of H2O2,
which activates the peroxidase [3]; examples include the determination of (i) choline with choline oxidase, peroxi-dase, phenol, and 4-aminoantipyrine [4], (ii) cholesterol with cholesterol oxidase, peroxidase, and o-dianisidine [5], (iii) creatinine with creatinine amidinohydrolase, sarcosine oxidase, peroxidase, 3,5-dichloro-2-hydroxybenzenesulfonic acid, and 4-aminophenazone [6], and (iv) lactose with β-galactosidase, glucose oxidase, peroxidase, and either o-dianisidine [7] or 4-aminophenazone and phenol [8].
Based on our previous work with o-phenylenediamine (OPD) for the optimized spectrophotometric quantification of horseradish peroxidase (HRP) [9], we developed a simple enzymatic assay system for the quantitative spec-trophotometric determination of lactose in solution with E. coliβ-galactosidase (β-Gal, EC 3.2.1.23), Aspergillus niger glucose oxidase (GOD, EC 1.1.3.4), and horseradish peroxidase (HRP, EC 1.11.1.7); see Scheme 1. In contrast to earlier similar quantifications [7,8], the assay developed was optimized for conditions that do not require any preincubation steps. The assay solution, containing all three enzymes β-Gal (3.3 nM), GOD (0.05 nM) and HRP (2.0 nM) and the peroxidase substrate OPD (3.14 mM), was incubated together with lactose (0.0–1.8 mM) for 7 h at
S. Fornera
:
K. Yazawa:
P. Walde (*) Department of Materials, ETH Zürich, Wolfgang-Pauli-Strasse 10,8093 Zürich, Switzerland e-mail: [email protected] Present Address:
K. Yazawa
Department of Biomolecular Engineering, Graduate School of Tokyo Institute of Technology, 4259-B53 Nagatsuda, Midori-ku,
Yokohama 226-8501, Japan
Anal Bioanal Chem (2011) 401:2307–2310 DOI 10.1007/s00216-011-5312-9
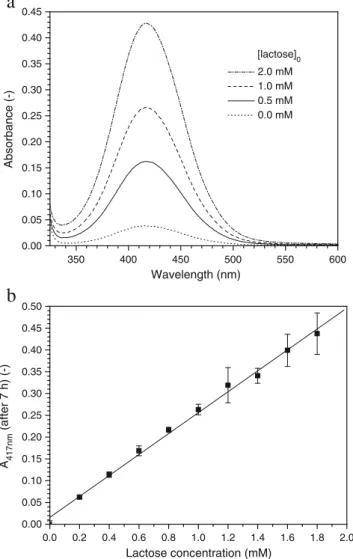
pH 7.2 and 25 °C. The absorption spectrum of the solution was then measured between 325 and 600 nm (Fig.1a). The absorbance at 417 nm, A417, corresponding to the maximum
absorbance observed in the spectrum of the resulting 2,3-diaminophenazine (DAP) at pH 7.2, [9], was plotted as a function of the initial lactose concentration in the assay solution (Fig.1b). A417was found to be linearly dependent
on the initial amount of lactose between 0.2 and 1.8 mM, corresponding to 0.6–5.4 nmol lactose in 3 ml of assay solution. The calculated lower limit of detection (LOD) for the conditions used was 0.1 mM, assuming that the LOD equals three times the standard deviation [8].
The details of the determinations as well as the characteristics of the enzymes utilized are listed in the following. All enzymes used were of diagnostic reagent grade and were obtained from Toyobo, Japan: product GAH-201 (β-Gal, 769 U/mg), product GLO-2022 (GOD, 242 U/mg), and product PEO-131 (HRP, 293 U/mg); see
http://www.toyobo.co.jp/e/ for the definition of U. The concentrations of the dissolved enzymes were determined spectrophotometrically using the following molar absorp-tion coefficients: for β-Gal, ε280= 1.13×10⁶ M−1cm−1,
calculated from the spectral properties given in [10] and using a relative molar mass of the enzyme of 540,000; for GOD,ε280=2.70×10⁵M−1cm−1[11]; for HRP isoenzyme C
(RZ≥3.0), ε403=1.02×10 5
M−1cm−1 [9]. OPD, β-lactose and all salts used to prepare the buffer solutions were from Sigma–Aldrich, Switzerland.
The measurements were carried out in the following way. First, several stock solutions were freshly prepared: HRP stock solution (15 nM in 10 mM sodium phosphate buffer containing 0.15 M NaCl, pH 7.2); GOD stock solution (3.0 nM in 10 mM sodium phosphate buffer containing 0.15 M NaCl, pH 7.2); β-Gal stock solution (50 nM in 50 mM sodium phosphate buffer containing 2 mM MgCl2, pH 7.0); OPD stock solution (6.28 mM in O OH H H HO H H OH H OH O H O H HO H H OH H OH OH O OH H H HO H H OH H OH OH O H HO H HO H H OH H OH OH
+
O H HO H HO H OH H OH O OH H HO H HO H OH H OH O OH GOD-FAD GOD-FADH2 H2O H2O, -Gal H2O2 O2 H2O HRP-Fe(III) HRP-Fe(IV) O NH2 NH2 N N NH2 NH2 2 1 2 3 4 5 6 7Scheme 1 Outline of the enzymatic cascade reaction system used for the quantification of lactose. The hydrolysis of lactose (1) into
D-galactose (2) andD-glucose (3)—partially via the intermediate formation of allolactose—is catalyzed by β-Gal [13]. Theβ-form of
D-glucose (3) is oxidized by the FAD-dependent GOD to glucono- δ-lactone (4) and H2O2. During this reaction step, the coenzyme FAD
is reduced to FADH2, which, in the presence of O2, is reoxidized to
FAD. Glucono-δ-lactone is further hydrolyzed nonenzymatically to gluconic acid (5) [14]. In the final “indicator reaction,” H2O2
activates HRP (i. e., oxidizes the heme group of HRP [15]), which then oxidizes OPD (6) to obtain one DAP (7) from two OPD molecules [9]. Please note that for the sake of clarity only the most relevantβ-forms of 1, 2, and 3 are given. The overall reaction is: 3 lactose+2 OPD+3 O2→
3D-galactose+3 gluconic acid+DAP+3 H2O
10 mM sodium phosphate buffer containing 0.15 M NaCl, pH 7.2); and lactose stock solution containing 10.27 g/ l lactose (30 mM) in deionized water.
The assay solutions (total volume: 3.00 ml) were prepared in 5 ml glass vials by first adding 850–670 μl 10 mM sodium phosphate buffer containing 0.15 M NaCl, pH 7.2, followed by 400 μl of the HRP stock solution, 50μl of the GOD stock solution, 200 μl of the β-Gal stock solution, 1.5 ml of the OPD stock solution, and finally 0– 180μl of the lactose stock solution. After closing the vials with plastic stoppers, the assay solutions were mixed by gentle shaking. Afterwards, the vials were stored unstirred for 7 h at room temperature (ca. 25 °C) in the dark, and the
absorption spectra of the solutions were then recorded with a 1 cm quartz cuvette in a PerkinElmer Lambda 19 spectrophotometer. For the data plotted in Fig. 1b, the A417value of an assay solution that did not contain lactose
(A417 (after 7 h)≈0.03, see Fig. 1a) was subtracted. With
initial lactose concentrations above 2 mM, deviations from linearity were clearly observed (data not shown).
The chosen enzyme concentrations turned out to be appropriate for obtaining a linear relationship between A417
and the initial lactose concentration (Fig.1b). For example, increasing the GOD concentration from 0.05 to 0.5 nM led to a hyperbolic dependence (for 2.0 nM HRP and 0.8– 3.3 nM β-Gal). Furthermore, the choice of pH 7.2 was a compromise to fulfill the requirements of optimal activity and stability of the three enzymes.1
As shown previously [9], an OPD concentration of 3.14 mM yields solely DAP as the reaction product of the indicator reaction, no other polymeric products. Based on the reported molar absorption coefficient of DAP (ε418=
1.67×10⁴M−1cm−1[9]), it can be estimated that about 1.6% of the OPD was transformed into DAP after 7 h for an initial lactose concentration of 1.8 mM. The estimated O2
consumption for this yield is 77 μM, which is below the concentration of dissolved O2in an aqueous solution at
25 °C (≈250 μM, [12]). Therefore, the dissolved O2was
not limiting under the studied conditions. Since DAP is fluorescent [16], a fluorometric format for the assay could be explored.
As is the case for other spectrophotometric (or spectro-fluorometric) assays, if turbid lactose samples are analyzed (e.g., milk), the samples need to be pretreated to eliminate turbidity (e.g., by treating milk with acid to precipitate the milk proteins). Furthermore, the analysis of samples containingD-glucose requires corresponding control meas-urements and an analysis of the samples to which defined amounts of lactose were added (internal standard).
In summary, the spectrophotometric assay developed here is a simple alternative to previously reported spectro-photometric peroxidase-based determinations of lactose [7, 8]. No preincubation steps are required with this new assay, and there is no need for large amounts of enzymes and substrate. With 550 μg β-Gal, 160 μg GOD, 25 μg HRP, and 100 mg OPD, one hundred 3 ml assays can be performed. If desired, the assay volume (and therefore the
1When all three enzyme stock solutions were prepared at tenfold
higher concentrations, and the reaction time was set to 30 min instead of 7 h, a linear dependency of A417 on the lactose concentration
between 0.25 and 1.50 mM was also found (data not shown), although the linear correlation was lower (r=0.9932). Measurements with shorter incubation times have the disadvantages of consuming more enzyme and requiring more precise control over the incubation time, which may be a problem if a large number of samples are assayed simultaneously.
a
b
350 400 450 500 550 600 0.00 0.05 0.10 0.15 0.20 0.25 0.30 0.35 0.40 0.45 2.0 mM 1.0 mM 0.5 mM 0.0 mM Absorbance (-) Wavelength (nm) 0.0 0.2 0.4 0.6 0.8 1.0 1.2 1.4 1.6 1.8 2.0 0.00 0.05 0.10 0.15 0.20 0.25 0.30 0.35 0.40 0.45 0.50 Lactose concentration (mM) A417nm (after 7 h) (-) [lactose]0Fig. 1 a Examples of absorption spectra between 325 and 600 nm for assay solutions containing various initial amounts of lactose, recorded after incubation for 7 h at 25 °C. [β-Gal]=3.3 nM, [GOD]=0.05 nM, [HRP]=2.0 nM, [OPD]0=3.14 mM, pH 7.2, pathlength: 1 cm. b
Dependence of the absorbance at 417 nm on the initial concentration of lactose, recorded after 7 h. For each data point, the blank value obtained in the absence of lactose was subtracted. Mean values and the corresponding standard deviations of six measurements are given for each concentration. The standard deviation of A417for the blank
(no lactose) was ±0.008. Correlation coefficient r=0.9976
amount of enzymes and OPD used) can be scaled down by a factor of three at least. When compared to electrochemical biosensors that use the same set of enzymes but in an immobilized state, the spectrophotometric assay with free enzymes certainly has several disadvantages, particularly if the response time and the detection limit are considered [17–20]. Furthermore, an optimal biosensor allows the immobilized enzymes to be used for a large number of samples, while each analysis is performed with new enzyme solutions in the spectrophotometric assay. The spectrophotometric assay, however, may be useful when analyzing aqueous solutions of lactose in an analytical research laboratory equipped with a standard UV/Vis spectrophotometer.
Acknowledgments The financial support from the Swiss National Science Foundation (200021–116205) is highly appreciated. Kenjiro Yazawa acknowledges the International Training Program (ITP) from the Japan Society for the Promotion of Science (JSPS). Martin Willeke (Department of Materials, ETH) is acknowledged for his careful and critical reading of the manuscript.
References
1. Bergmeyer HU (ed), Gawehn K (1978) Principles of enzymatic analysis. Verlag Chemie, Weinheim
2. Bergmeyer HU (ed) (1983) Methods of enzymatic analysis, vol I, 3rd edn. Weinheim, Verlag Chemie
3. Ngo TT (2010) Peroxidase in chemical and biochemical analysis. Anal Lett 43:1572–1587
4. Imamura S, Horiuti Y (1978) Enzymatic determination of phospholipase D activity with choline oxidase. J Biochem 83:677–680
5. Omodeo Salè F, Marchesini S, Fishman PH, Berra D (1984) A sensitive enzymatic assay for determination of cholesterol in lipid extracts. Anal Biochem 142:347–350
6. Fossati P, Prencipe L, Berti G (1983) Enzymatic creatinine assay: a new colorimetric method based on hydrogen peroxide measure-ment. Clin Chem 29:1494–1496
7. Kotler DP, Tierney AR, Rosensweig NS (1981) An enzymatic microassay for lactose. Anal Biochem 110:393–396
8. Sánchez-Manzanares JA, Fernández-Villacañas MR, Marín-Iniesta F, Laencina J (1993) Determination of lactose by an enzymatic method. Food Chem 46:425–427
9. Fornera S, Walde P (2010) Spectrophotometric quantification of horseradish peroxidase with o-phenylendiamine. Anal Biochem 407:293–295
10. Craven GR, Steers E Jr, Anfinsen CB (1965) Purification, composition, and molecular weight of the β-galactosidase of Escherichia coli K12. J Biol Chem 240:2468–2477
11. Wong CM, Wong KH, Chen XD (2008) Glucose oxidase: natural occurrence, function, properties and industrial applications. Appl Microbiol Biotechnol 78:927–938
12. Millero FJ, Huang F, Laferiere AL (2002) The solubility of oxygen in the major sea salts and their mixtures at 25 °C. Geochim Cosmochim Acta 66:2349–2359
13. Matthews BW (2005) The structure of E. coliβ-galactosidase. C R Biologies 328:549–556
14. Leskovac V, Trivić S, Wohlfahrt G, Kandrač J, Peričin D (2005) Glucose oxidase from Aspergillus niger: the mechanism of action with molecular oxygen, quinones, and one-electron acceptors. Int J Biochem Cell Biol 37:731–750
15. Azevedo AM, Martins VC, Prazeres DMF, Vojinović V, Cabral JMS, Fonseca LM (2003) Horseradish peroxidase: a valuable tool in biotechnology. Biotechnol Annu Rev 9:199–247
16. Fu PKL, Abuzakhm S, Turro C (2005) Photoinduced DNA cleavage and cellular damage in human dermal fibroblasts by 2,3-diaminophenazine. Photochem Photobiol 81:89–95
17. Liu H, Ying T, Sun K, Li H, Qi D (1997) Reagentless amperometric biosensors highly sensitive to hydrogen peroxide, glucose and lactose based on N-methyl phenazine methosulfate incorporated in a Nafion film as an electron transfer mediator between horseradish peroxi-dase and an electrode. Anal Chim Acta 344:187–199
18. Tkáč J, Šturdík E, Gemeiner P (2000) Novel glucose non-interference biosensor for lactose detection based on galactose oxidase-peroxidase with and without co-immobilised β-galactosidase. Analyst 125:1285–1289
19. Eshkenazi I, Maltz E, Zion B, Rishpon J (2000) A three-cascaded-enzymes biosensor to determine lactose concentration in raw milk. J Dairy Sci 83:1939–1945
20. Conzuela F, Gamella M, Campuzano S, Ruiz MA, Reviejo AJ, Pingarrón JM (2010) An integrated amperometric biosensor for the determination of lactose in milk and dairy products. J Agr Food Chem 58:7141–7148