Div-Seq: Single-nucleus RNA-Seq reveals
dynamics of rare adult newborn neurons
The MIT Faculty has made this article openly available.
Please share
how this access benefits you. Your story matters.
Citation
Habib, Naomi et al. "Div-Seq: Single-nucleus RNA-Seq reveals
dynamics of rare adult newborn neurons." Science 353, 6302
(August 2016): 925-928 © 2016 American Association for the
Advancement of Science
As Published
http://dx.doi.org/10.1126/SCIENCE.AAD7038
Publisher
American Association for the Advancement of Science (AAAS)
Version
Author's final manuscript
Citable link
http://hdl.handle.net/1721.1/112730
Terms of Use
Creative Commons Attribution-Noncommercial-Share Alike
Detailed Terms
http://creativecommons.org/licenses/by-nc-sa/4.0/
Div-Seq: Single nucleus RNA-Seq reveals dynamics of rare adult
newborn neurons
Naomi Habib1,2,3,*, Yinqing Li1,2,3,4,*, Matthias Heidenreich1,2,3, Lukasz Swiech1,2,3, Inbal
Avraham-Davidi1, John J. Trombetta1, Cynthia Hession1, Feng Zhang1,2,3,5,6,†, and Aviv
Regev1,7,†
1Broad Institute of MIT and Harvard, 75 Ames Street, Cambridge, Massachusetts 02142, USA 2Stanley Center for Psychiatric Research, Broad Institute of MIT and Harvard, 75 Ames Street, Cambridge, Massachusetts 02142, USA
3McGovern Institute of Brain Research, Massachusetts Institute of Technology, Cambridge, Massachusetts 02139, USA
4Department of Electrical Engineering and Computer Science, Massachusetts Institute of Technology, Cambridge, Massachusetts 02139, USA
5Department of Brain and Cognitive Sciences, Massachusetts Institute of Technology, Cambridge, Massachusetts 02139, USA
6Department of Biological Engineering, Massachusetts Institute of Technology, Cambridge, Massachusetts 02139, USA
7Howard Hughes Medical Institute, Koch Institute of Integrative Cancer Research, Department of Biology, Massachusetts Institute of Technology, Cambridge, Massachusetts 02139, USA
Abstract
Single cell RNA-Seq provides rich information about cell types and states. However, it is difficult to capture rare dynamic processes, such as adult neurogenesis, because isolation of rare neurons from adult tissue is challenging and markers for each phase are limited. Here, we develop Div-Seq, which combines scalable single nucleus RNA-Seq (sNuc-Seq) with pulse labeling of proliferating cells by EdU to profile individual dividing cells. sNuc-Seq and Div-Seq can sensitively identify closely related hippocampal cell types and track transcriptional dynamics of newborn neurons within the adult hippocampal neurogenic niche, respectively. We also apply Div-Seq to identify and profile rare newborn GABAergic neurons in the adult spinal cord, a non-canonical neurogenic region. sNuc-Seq and Div-Seq open the way for unbiased analysis of diverse complex tissues.
†To whom correspondence should be addressed; zhang@broadinstitute.org (F.Z.); aregev@broadinstitute.org (A.R.). *These authors contributed equally to this work.
Supplementary materials contain: Supplemental Materials and Methods Supplementary text Figures S1–S24 Tables S1–S7 References (22–53)
HHS Public Access
Author manuscript
Science. Author manuscript; available in PMC 2017 June 22.
Published in final edited form as:
Science. 2016 August 26; 353(6302): 925–928. doi:10.1126/science.aad7038.
A
uthor Man
uscr
ipt
A
uthor Man
uscr
ipt
A
uthor Man
uscr
ipt
A
uthor Man
uscr
ipt
Single cell RNA-Seq (scRNA-Seq) has extended our understanding of heterogeneous tissues including the central nervous system (CNS) (1–3). However, dynamic processes, such as adult neurogenesis, remain challenging to study using scRNA-Seq. First, scRNA-Seq requires enzymatic tissue dissociation (Fig. 1A), which may compromise the integrity of neurons and their RNA content, skew data towards easily dissociated cell types, and is restricted to fetal or young animals (1). Second, it is difficult to capture rare cell types, such as adult newborn neurons (4), because of limitations in cell tagging and isolation at each phase of the dynamic process.
We therefore developed Div-Seq, a method for RNA-seq of individual, recently-divided cells. Div-Seq relies on sNuc-Seq, a single-nucleus isolation and RNA-Seq method compatible with frozen or fixed tissue (Fig. 1A), which enables enrichment of rare labeled cell populations by fluorescence-activated cell sorting (FACS) (fig. S1). Div-Seq combines sNuc-Seq with pulse labeling of dividing cells by 5-ethynyl-2′-deoxyuridine (EdU) (5, 6). We validated that sNuc-Seq on population of nuclei faithfully represents tissue level RNA (7) (fig. S2A–B), in agreement with earlier studies on the feasibility of single nucleus RNA-seq (7, 8). Next, we analyzed 1,367 single nuclei from hippocampal anatomical sub-regions (DG, CA1, CA2, and CA3) from adult mice, including enrichment of genetically-tagged lowly abundant GABAergic neurons (9) (fig. S1). sNuc-Seq robustly generated high quality data across animal age groups (including 2 years old mice, fig. S2C–H, S3), detecting 5,100 expressed genes per nucleus on average, with comparable complexity to single neuron RNA-Seq from young mice (1–3) (fig. S3A–C).
Analysis of sNuc-Seq data revealed distinct nuclei clusters (Fig. 1B–D, fig. S4–S5, S6A–C and table S1) corresponding to known cell types and anatomical distinctions in the
hippocampus. Analysis was consistent with microdissections, in situ hybridization (Allen ISH (10), fig. S5), and bulk RNA-Seq (11) (fig. S6D). We captured finer distinctions between closely related cells using a new clustering algorithm, biSNE (biclustering on Stochastic Neighbor Embedding) (fig. S7), which partitioned the GABAergic neurons into sub-clusters (fig. S8 and table S2), and associated each sub-cluster with combinations of canonical markers (fig. S8C). We validated selected markers using fluorescent RNA in situ hybridization (FISH) (fig. S9).
BiSNE also distinguished between spatial hippocampal sub-regions with divergent
transcriptional profiles. BiSNE partitioned glutamatergic cells into sub-clusters (Fig. 2A and fig. S10), which were further mapped to hippocampal sub-regions, using ISH of spatial landmark genes (10) (Fig. 2B and fig. S11–S13). We validated our mapping by confirming expression patterns using the Allen ISH dataset (10) (Fig. 2C and fig. S14). While some regions were assigned to a single cluster (e.g., dorsal lateral CA1, Fig. 2B), most sub-regions were assigned partially overlapping sub-clusters, suggesting a gradual transition of transcriptional profiles between neighboring sub-regions. This extends current anatomical resolutions of the hippocampus (figure S15), and support the notion that cellular diversity does not always partition into discrete sub-types (12).
A
uthor Man
uscr
ipt
A
uthor Man
uscr
ipt
A
uthor Man
uscr
ipt
A
uthor Man
uscr
ipt
We identified genes that are indicative of specific cell type or position (tables S1–S3). For example, Penk, encoding an opioid neuropeptide (Enkephalin), and its receptor Oprd1 (13), were expressed in mutually exclusive sub-clusters of cells (Fig. 2D), which we validated by FISH and the Allen ISH dataset (10) (Fig 2E, fig. S16). These cell types and spatial positions may be involved in Enkephalin signaling within the hippocampus.
Next, to study transcriptional dynamics during adult neurogenesis we developed Div-Seq by combining sNuc-Seq with EdU labeling of dividing cells (Fig. 3A). Unlike genetic labeling (2, 14), EdU tags proliferating cells at any time window, marking stem cells and their progeny with high temporal resolution. We applied Div-Seq in the DG, a canonical neurogenic niche (4), over multiple time points (1–14 days after cell division, Fig. 3B, fig. S17, Table S4). Div-Seq enriched for diverse newborn cell types and neurogenic stages (fig. S17F–G), from proliferating stem cells to immature neurons (4).
BiSNE analysis of neuronal lineage nuclei placed the DG newborn neurons on a continuous trajectory. The order of nuclei along the trajectory matched the EdU labeling time (Fig. 3C), was independent of animal age (fig. S17H) and recapitulated known dynamics of
neurogenesis markers (2, 3, 15) (fig S18A), indicating that the trajectory indeed captured the neuronal maturation process.
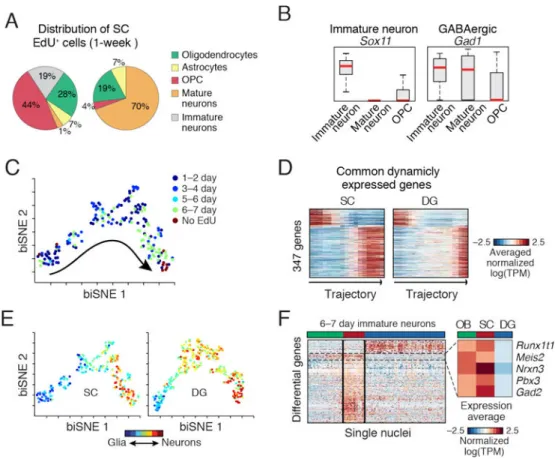
To characterize the transcriptional program of adult neurogenesis, we identified and clustered genes with dynamic expression patterns along the trajectory (Fig. 3D and table S5). We found major coordinated transcriptional waves, involving hundreds of genes, and aligned with known transitions between neurogenic stages, with expression shifts from proliferation to neuronal differentiation (consistent with (2)), and then to neuronal integration and maturation (Fig. 3D). We identified genes with restricted expression in specific stages of neurogenesis (fig. S18–S19), including transcription factors and chromatin regulators (fig. S18). We confirmed the early neurogenic stage-specific expression of the axon guidance molecule Draxin and the ribonucleotide reductase Rrm2 by FISH (fig. S19). Accumulating evidence suggests that adult neurogliogenesis occurs in multiple non-canonical regions (16), but traditional methods are limited for the characterization of rare newborn cells, and can lead to less definitive findings, as in the spinal cord (SC) (17) (18). We applied Div-Seq over multiple time points (1–7 days) in the SC (fig. S20). SC nuclei 6–7 days post labeling (Fig. 4A–B) comprised a diverse population of newborn cells including oligodendrocyte precursor cells (OPCs, 44%) and immature neurons (19%), in contrast to 4% OPCs and no immature neurons in the non-EdU labeled population. The SC newborn neurons expressed the GABAergic markers Gad1 and Gad2, suggesting GABAergic neurogenesis (18) (Fig. 4B). Notably, we found a set of immature neuronal nuclei (10%) at 23–24 days post EdU labeling (fig. S21), suggesting survival of newborn neurons in the SC. The full set of neuronal lineage nuclei (fig. S20A) map to a continuous trajectory (Fig. 4C), that matched labeling time and expression dynamics of known markers (fig. S20C). Comparison of dynamically expressed genes along the SC and DG trajectories (fig. S20B) identified 347 (28%) common neurogenesis genes (Fig. 4D, fig. S20C), and revealed notable distinctions in expression dynamics and branching in the DG and SC (Fig. 4D–E and (6)),
Habib et al. Page 3
Science. Author manuscript; available in PMC 2017 June 22.
A
uthor Man
uscr
ipt
A
uthor Man
uscr
ipt
A
uthor Man
uscr
ipt
A
uthor Man
uscr
ipt
which can result from differences in time scales, cell populations, or parallel gliogenesis and neurogenesis processes.
The immature neurons from SC and DG are comprised of different neuronal types (GABAergic in SC, granule cells in DG). To identify candidate genes driving neuronal lineage specification, we first identified differentially expressed genes between SC and DG (t-test), and then compared their expression patterns to those of newborn neurons in the olfactory bulb (OB), where GABAergic neurons are born (Fig. 4F). A set of SC-specific genes was also up-regulated in the OB relative to the DG, including the transcription factors Pbx3 and Meis2. This is consistent with previous reports (19, 20), and with
immunohistochemistry of Pbx3 showing expression in newborn cells both in the OB and SC but not in the DG (fig. S22–S24).
Application of Div-Seq to the adult CNS highlighted potential regulators and the neurogenic potential of the SC, though the functional roles of these SC newborn neurons remained to be elucidated. Future technology developments may increase the sensitivity, throughput, and cell types amenable to these methods. sNuc-Seq and Div-Seq open new avenues in the study of neuronal diversity and dynamic processes in the CNS, and can be readily applied to diverse biological systems and human tissues.
Supplementary Material
Refer to Web version on PubMed Central for supplementary material.
Acknowledgments
Raw data is deposited to the Gene Expression Omnibus with accession no. GSE84371, annotated data available at
https://portals.broadinstitute.org/single_cell, and software tools are available at https://github.com/yinqingl/ nucseq_analysis. We thank N. Friedman, A. Shalek, D. Gennert, T. Blosser, S. Kadosch, O. Rosen, Z. Wang, P. Rogers, and L. Gaffeny for support. J. Campbell for dissociated neurons image. N.H. is a HHMI Fellow of The HHWF. M.H. is supported by the HFSP. This work was supported by the KCO, NIMH grant U01MH105960 (F.Z., A.R.). F.Z. is supported by the NIH through NIMH (5DP1-MH100706 and 1R01-MH110049), NSF, the New York Stem Cell, Simons, Paul G. Allen Family, and Vallee Foundations; and James and Patricia Poitras, Robert Metcalfe, and David Cheng. A.R. is on the SAB for Syros Pharmaceuticals and Thermo Fisher and a consultant for Driver group. NH, YL, AR and FZ are inventors on provisional patent application 62/311,129 applied for by the Broad Institute and MIT that covers the methods described in this paper.
References and Notes
1. Zeisel A, et al. Brain structure. Cell types in the mouse cortex and hippocampus revealed by single-cell RNA-seq. Science. 2015; 347:1138–1142. [PubMed: 25700174]
2. Shin J, et al. Single-Cell RNA-Seq with Waterfall Reveals Molecular Cascades underlying Adult Neurogenesis. Cell Stem Cell. 2015; 17:360–372. [PubMed: 26299571]
3. Tasic B, et al. Adult mouse cortical cell taxonomy revealed by single cell transcriptomics. Nat Neurosci. 2016; 19:335–346. [PubMed: 26727548]
4. Ming GL, Song H. Adult neurogenesis in the mammalian brain: significant answers and significant questions. Neuron. 2011; 70:687–702. [PubMed: 21609825]
5. Moore DL, Pilz GA, Arauzo-Bravo MJ, Barral Y, Jessberger S. A mechanism for the segregation of age in mammalian neural stem cells. Science. 2015; 349:1334–1338. [PubMed: 26383951] 6. Materials and methods are available as supplementary materials on Science Online
7. Lacar B, et al. Nuclear RNA-seq of single neurons reveals molecular signatures of activation. Nat Commun. 2016; 7:11022. [PubMed: 27090946]
A
uthor Man
uscr
ipt
A
uthor Man
uscr
ipt
A
uthor Man
uscr
ipt
A
uthor Man
uscr
ipt
8. Swiech L, et al. In vivo interrogation of gene function in the mammalian brain using CRISPR-Cas9. Nat Biotechnol. 2015; 33:102–106. [PubMed: 25326897]
9. Hu H, Gan J, Jonas P. Interneurons. Fast-spiking, parvalbumin(+) GABAergic interneurons: from cellular design to microcircuit function. Science. 2014; 345:1255263. [PubMed: 25082707] 10. Lein ES, et al. Genome-wide atlas of gene expression in the adult mouse brain. Nature. 2007;
445:168–176. [PubMed: 17151600]
11. Zhang Y, et al. An RNA-sequencing transcriptome and splicing database of glia, neurons, and vascular cells of the cerebral cortex. J Neurosci. 2014; 34:11929–11947. [PubMed: 25186741] 12. Cembrowski MS, et al. Spatial Gene-Expression Gradients Underlie Prominent Heterogeneity of
CA1 Pyramidal Neurons. Neuron. 2016
13. Roques BP, Fournie-Zaluski MC, Wurm M. Inhibiting the breakdown of endogenous opioids and cannabinoids to alleviate pain. Nat Rev Drug Discov. 2012; 11:292–310. [PubMed: 22460123] 14. Llorens-Bobadilla E, et al. Single-Cell Transcriptomics Reveals a Population of Dormant Neural
Stem Cells that Become Activated upon Brain Injury. Cell Stem Cell. 2015; 17:329–340. [PubMed: 26235341]
15. Schouten M, Buijink MR, Lucassen PJ, Fitzsimons CP. New Neurons in Aging Brains: Molecular Control by Small Non-Coding RNAs. Front Neurosci. 2012; 6:25. [PubMed: 22363255] 16. Feliciano DM, Bordey A, Bonfanti L. Noncanonical Sites of Adult Neurogenesis in the
Mammalian Brain. Cold Spring Harb Perspect Biol. 2015; 7
17. Horner PJ, et al. Proliferation and differentiation of progenitor cells throughout the intact adult rat spinal cord. J Neurosci. 2000; 20:2218–2228. [PubMed: 10704497]
18. Shechter R, Ziv Y, Schwartz M. New GABAergic interneurons supported by myelin-specific T cells are formed in intact adult spinal cord. Stem Cells. 2007; 25:2277–2282. [PubMed: 17540856] 19. Agoston Z, et al. Meis2 is a Pax6 co-factor in neurogenesis and dopaminergic periglomerular fate
specification in the adult olfactory bulb. Development. 2014; 141:28–38. [PubMed: 24284204] 20. Rottkamp CA, Lobur KJ, Wladyka CL, Lucky AK, O’Gorman S. Pbx3 is required for normal
locomotion and dorsal horn development. Dev Biol. 2008; 314:23–39. [PubMed: 18155191] 21. Picelli S, et al. Smart-seq2 for sensitive full-length transcriptome profiling in single cells. Nat
Methods. 2013; 10:1096–1098. [PubMed: 24056875]
22. Paul CA, Beltz B, Berger-Sweeney J. Sectioning of brain tissues. Cold Spring Harbor Protocols. 2008; 2008 pdb.
23. Hideo H, Keiko T, Nobuyuki Y, Tsuyoshi M. Dissection of hippocampal dentate gyrus from adult mouse. Journal of Visualized Experiments. 2009
24. Satija R, Farrell JA, Gennert D, Schier AF, Regev A. Spatial reconstruction of single-cell gene expression data. Nature biotechnology. 2015; 33:495.
25. Hempel CM, Sugino K, Nelson SB. A manual method for the purification of fluorescently labeled neurons from the mammalian brain. Nature protocols. 2007; 2:2924. [PubMed: 18007629] 26. Trapnell C, Pachter L, Salzberg SL. Tophat: discovering splice junctions with rna-seq.
Bioinformatics. 2009; 25:1105. [PubMed: 19289445]
27. Trapnell C, et al. Transcript assembly and quantification by rna-seq reveals unannotated transcripts and isoform switching during cell differentiation. Nature biotechnology. 2010; 28:511.
28. Robinson JT, et al. Integrative genomics viewer. Nature biotechnology. 2011; 29:24.
29. Li B, Ruotti V, Stewart RM, Thomson JA, Dewey CN. Rna-seq gene expression estimation with read mapping uncertainty. Bioinformatics. 2010; 26:493. [PubMed: 20022975]
30. Langmead B, Salzberg SL. Fast gapped-read alignment with bowtie 2. Nature methods. 2012; 9:357. [PubMed: 22388286]
31. DeLuca DS, et al. Rna-seqc: Rna-seq metrics for quality control and process optimization. Bioinformatics. 2012; 28:1530. [PubMed: 22539670]
32. Dunn JC. Well-separated clusters and optimal fuzzy partitions. Journal of cybernetics. 1974; 4:95. 33. Roweis ST, Saul LK. Nonlinear dimensionality reduction by locally linear embedding. Science.
2000; 290:2323. [PubMed: 11125150]
34. Van der Maaten L, Hinton G. Visualizing data using t-sne. Journal of Machine Learning Research. 2008; 9:85.
Habib et al. Page 5
Science. Author manuscript; available in PMC 2017 June 22.
A
uthor Man
uscr
ipt
A
uthor Man
uscr
ipt
A
uthor Man
uscr
ipt
A
uthor Man
uscr
ipt
35. Rodriguez A, Laio A. Clustering by fast search and find of density peaks. Science. 2014; 344:1492. [PubMed: 24970081]
36. Shalek AK, et al. Single cell rna seq reveals dynamic paracrine control of cellular variation. Nature. 2014; 510:363. [PubMed: 24919153]
37. Shalek AK, et al. Single-cell transcriptomics reveals bimodality in expression and splicing in immune cells. Nature. 2013; 498:236. [PubMed: 23685454]
38. Robinson MD, McCarthy DJ, Smyth GK. edger: a bioconductor package for differential expression analysis of digital gene expression data. Bioinformatics. 2010; 26:139. [PubMed: 19910308] 39. Love MI, Huber W, Anders S. Moderated estimation of fold change and dispersion for rna-seq data
with deseq2. Genome Biol. 2014; 15:550. [PubMed: 25516281]
40. Botev ZI, Grotowski JF, Kroese DP, et al. Kernel density estimation via diffusion. The Annals of Statistics. 2010; 38:2916.
41. Kharchenko PV, Silberstein L, Scadden DT. Bayesian approach to single-cell differential expression analysis. Nature methods. 2014; 11:740. [PubMed: 24836921]
42. Amir, E-aD, et al. visne enables visualization of high dimensional single-cell data and reveals phenotypic heterogeneity of leukemia. Nature biotechnology. 2013; 31:545.
43. Macosko EZ, et al. Highly parallel genome-wide expression profiling of individual cells using nanoliter droplets. Cell. 2015; 161:1202. [PubMed: 26000488]
44. Benjamini Y, Hochberg Y. Controlling the false discovery rate: a practical and powerful approach to multiple testing. Journal of the Royal Statistical Society Series B (Methodological). 1995:289– 300.
45. Moran PA. Notes on continuous stochastic phenomena. Biometrika. 1950:17–23. [PubMed: 15420245]
46. Rousseeuw PJ, Croux C. Alternatives to the median absolute deviation. Journal of the American Statistical association. 1993; 88:1273.
47. Edelman A, Rao NR. Random matrix theory. Acta Numerica. 2005; 14:233.
48. Eden E, Lipson D, Yogev S, Yakhini Z. Discovering motifs in ranked lists of dna sequences. PLoS Comput Biol. 2007; 3:e39. [PubMed: 17381235]
49. Maruyama Y. An alternative to moran’s i for spatial autocorrelation. arXiv preprint arXiv: 1501.06260. 2015
50. Van Der Maaten L. Accelerating t-sne using tree-based algorithms. The Journal of Machine Learning Research. 2014; 15:3221.
51. Yianilos PN. SODA. 1993; 93:311–321.
52. Anders S, Huber W. Differential expression analysis for sequence count data. Genome Biology. 2010; 11:R106. [PubMed: 20979621]
53. Brennecke P, et al. Accounting for technical noise in single-cell rna-seq experiments. Nature methods. 2013; 10:1093. [PubMed: 24056876]
A
uthor Man
uscr
ipt
A
uthor Man
uscr
ipt
A
uthor Man
uscr
ipt
A
uthor Man
uscr
ipt
Fig. 1.
sNuc-Seq identifies cell types in adult mouse brain. (A) Representative images of isolated nuclei are more uniform than of dissociated neurons from adult brain. Scale = 10μm. sNuc-Seq method (right): nuclei are isolated, FACS sorted and profiled using modified Smart-Seq2 (21). (B) Major cell types identified from sNuc-Seq data reflected by clusters, shown as 2-D embedding of 1,188 nuclei from adult mouse hippocampus. (C) Cluster-specific genes across single nuclei. Color bar matches cluster color in B. (D) Identification of DG granule cell, CA1, CA2, and CA3 pyramidal cell clusters, by marker genes, shown as: 1, ISH image in hippocampus section (10) (arrowhead: high expression; Scale = 400μm.); 2, histogram quantifying expression in relevant cluster; and 3, 2-D embedding of nuclei (as in B) colored by relative expression.
Habib et al. Page 7
Science. Author manuscript; available in PMC 2017 June 22.
A
uthor Man
uscr
ipt
A
uthor Man
uscr
ipt
A
uthor Man
uscr
ipt
A
uthor Man
uscr
ipt
Fig. 2.
sNuc-Seq and biSNE distinguish cell subtypes and spatial expression patterns. (A)
Pyramidal CA1 and CA3 biSNE sub-clusters. Shown is a 2-D embedding of the CA1 and CA3 pyramidal nuclei (colored by cluster). Inserts: the CA1 cluster (orange) and CA3 cluster (green) within all other clusters from Fig. 1B. (B) Mapping of CA1 and CA3 pyramidal sub-clusters to sub-regions. Sub-cluster assignments are numbered and color coded as in A. Top: hippocampus schematic. (C) Predictions by CA1 and CA3 sub-cluster spatial mapping match with Allen ISH data (10). Left illustrations: boxes: predicted differential expression regions; arrowhead: high expression; asterisk: low expression. (D) Mutually exclusive expression of Penk (facing up) and its receptor Oprd1 (facing down) across neuronal sub-clusters. Red line: median, box: 75% and 25% quantile. Single and double asterisks: GABergic clusters associated with Pvalb or Vip markers, respectively. (E) co-FISH of Penk or Oprd with markers of GABAergic sub-types (Pvalb and Vip as in D). Arrowheads: co-expression. Scale = 20μm.
A
uthor Man
uscr
ipt
A
uthor Man
uscr
ipt
A
uthor Man
uscr
ipt
A
uthor Man
uscr
ipt
Fig. 3.
Transcriptional dynamics of adult neurogenesis by Div-Seq. (A) Div-Seq. EdU is injected into adult mice and incorporates into dividing cells (5), isolated EdU labeled nuclei are fluorescently tagged and captured by FACS for sNuc-Seq. (B) Adult neurogenesis in the DG (4). Tan box: timing of EdU labeling. Bottom panel: EdU labeling and tissue dissection (grey) time course. (C) A continuous trajectory of newborn cells in the DG. biSNE 2-D embedding of neuronal lineage nuclei (n = 269). Arrow: direction of trajectory determined by labeling time and marker expression. Top: Colored by labeling time (1–14 days). Bottom: Expression of markers, shown as: 1, 2-D embedding colored by the expression level; 2, average expression along the trajectory. Markers (clockwise from top left): Sox9 (NSC), Notch1 (proliferation/differentiation), Neurod1 (immature neurons), Eomes/Tbr2 (neuronal precursor). (D) Expression waves along the trajectory. Left: average expression of cluster genes along the trajectory. Middle: heatmap of average expression of each gene along the trajectory and neurogenic stages (labeled as in B). Right: representative enriched biological pathways.
Habib et al. Page 9
Science. Author manuscript; available in PMC 2017 June 22.
A
uthor Man
uscr
ipt
A
uthor Man
uscr
ipt
A
uthor Man
uscr
ipt
A
uthor Man
uscr
ipt
Fig. 4. Dynamics of adult newborn GABAergic neurons in SC
(A) Div-Seq in SC captures OPCs and immature neurons. Distribution of cell types in non-EdU-labeled and 6–7 days EdU labeled nuclei. (B) Div-Seq captured nuclei expressing marker genes of immature (Sox11) and GABAergic (Gad1) neurons. Box plots for immature neurons, mature neurons and OPCs. Red: median, box: 75% and 25% quantiles. (C)
Newborn cells in SC form a continuous trajectory. 2-D embedding of 1–7 days EdU labeled and non-labeled nuclei (n=184, neuronal lineage nuclei), colored by labeling time.
Trajectory directionality is EdU labeling time and marker genes. (D) Dynamically expressed genes shared in SC and DG neurogenesis (347 genes from fig. S22B and Fig. 3D). (E) Gradual transition from a glia-like to neuronal state. Neuronal trajectories in the SC (as in C) and DG (as in Fig. 3C) colored by a glia-neuron RNA expression score. (F) Region specific gene expression in immature neurons (6–7 days post EdU). 236 genes differentially expressed between SC and DG (t-test FDR<0.05, log-ratio>1), in olfactory bulb (OB), SC and DG. Box: average expression of example genes up-regulated in OB and SC compared to DG.