HAL Id: insu-03166590
https://hal-insu.archives-ouvertes.fr/insu-03166590v2
Submitted on 22 Apr 2021
HAL is a multi-disciplinary open access
archive for the deposit and dissemination of
sci-entific research documents, whether they are
pub-lished or not. The documents may come from
teaching and research institutions in France or
abroad, or from public or private research centers.
L’archive ouverte pluridisciplinaire HAL, est
destinée au dépôt et à la diffusion de documents
scientifiques de niveau recherche, publiés ou non,
émanant des établissements d’enseignement et de
recherche français ou étrangers, des laboratoires
publics ou privés.
Distributed under a Creative Commons Attribution - NonCommercial| 4.0 International
Loïc Rossi, Margaux Vals, Franck Montmessin, Francois Forget, Ehouarn
Millour, Anna Fedorova, Alexander Trokhimovskiy, Oleg Korablev
To cite this version:
Loïc Rossi, Margaux Vals, Franck Montmessin, Francois Forget, Ehouarn Millour, et al..
The
effect of the Martian 2018 global dust storm on HDO as predicted by a Mars Global Climate
Model. Geophysical Research Letters, American Geophysical Union, 2021, 48 (7), pp.e2020GL090962.
�10.1029/2020GL090962�. �insu-03166590v2�
1. Introduction
Mars is known to have had a significant liquid water reservoir on the surface (Bibring et al., 2006; Carr & Head III, 2003) and the deuterium to hydrogen (D/H) ratio derived from the HDO/H2O abundance ratio is
a sensitive tool to constrain the primordial abundance of the water reservoir on Mars and its evolution with time. The current ratio is at least five times that of the Vienna standard mean ocean water (SMOW) refer-ence derived from Earth’s oceans (Encrenaz et al., 2018; Krasnopolsky, 2015; Owen et al., 1988; Villanueva et al., 2015). Henceforth, D/H ratios presented in the rest of this study are expressed with respect to SMOW. H and D atoms in the upper atmosphere come from H2O and HDO, their sole precursor in the lower
at-mosphere. The lower mass of H over D atoms and the fact that H2O is preferentially photolyzed over HDO
(Cheng et al., 1999) explain the differential escape of these two elements. Also, the heavier isotope, HDO, has a lower vapor pressure than H2O, which results in an enrichment of the deuterated isotope in the solid
phase of water. This effect is known as the vapor pressure isotope effect which can reduce the D/H ratio above the condensation level to values as low as 10% of the D/H ratio near the surface (Bertaux & Montmes-sin, 2001; Fouchet & Lellouch, 2000).
Fractionation should affect the amount of HDO depending on latitude, longitude, altitude, and season. In particular, a previous model (Montmessin et al., 2005, hereafter referred to as M05) has predicted that an isotopic gradient should exist between the cold regions where condensation depletes the atmosphere in
Abstract
The deuterium to hydrogen (D/H) ratio is commonly used to investigate the history of water on Mars, yet the mechanisms controlling present-day HDO behavior are poorly understood. Significant variations of the D/H ratio were first predicted on the basis of a 3D global climate model, which were later confirmed by ground-based observations. This behavior, consisting of lower HDO/H2O ratios in thecolder regions of Mars, is related to the isotopic fractionation occurring at condensation. We leverage this previous effort and present an updated implementation, using the modern version of the model, that remains in agreement with the older version. We explore the impact of the global dust storm (GDS) that occurred during Martian year 34 (MY34) on HDO. Our simulations indicate that HDO is on average 40% more abundant at 100 km during the MY34 GDS year than during a regular year, with likely large consequences for the escape flux of water that year.
Plain Language Summary
HDO, the semi-heavy isotope of water, when compared towater, is a good indicator of how much water has been escaping from the atmosphere of Mars over the ages. Ultimately, it can be used to estimate the past reservoir of water available on Mars in its early youth. Because HDO has a slightly higher molecular mass compared to H2O, condensation induces an
enrichment of HDO in the ice phase compared with the vapor phase. This subsequently causes spatial and temporal variations of the deuterium to hydrogen ratio. We use a global circulation model to simulate the HDO cycle in the atmosphere. Our model is an upgrade of the previous model presented in Montmessin et al. (2005, Journal of Geophysical Research, 110(E3), E10004. doi:10.1029/2004JE002357). We then simulate the effect of the global dust storm that affected Mars during the summer of 2018, and show that it should have had a strong impact on the vertical distribution of HDO, allowing it to reach higher altitudes. Such simulations are intended to be compared with observations from the Trace Gas Orbiter, currently in orbit around Mars.
© 2021. The Authors.
This is an open access article under the terms of the Creative Commons Attribution License, which permits use, distribution and reproduction in any medium, provided the original work is properly cited.
The Effect of the Martian 2018 Global Dust Storm on
HDO as Predicted by a Mars Global Climate Model
Loïc Rossi1 , Margaux Vals1, Franck Montmessin1 , François Forget2,
Ehouarn Millour2 , Anna Fedorova3 , Alexander Trokhimovskiy3, and Oleg Korablev3
1LATMOS/IPSL, UVSQ Université Paris-Saclay, Sorbonne Université, CNRS, Guyancourt, France, 2LMD, Paris, France, 3Space Research Institute (IKI), Moscow, Russia
Key Points:
• We reimplemented the HDO cycle in a more recent version of the Laboratoire de Météorologie Dynamique Mars global climate model
• We reproduce the observed gradient of the deuterium to hydrogen ratio between cold and warm regions • The global dust storm of Martian
year 34 has a strong effect on the vertical distribution of HDO
Supporting Information:
Supporting Information may be found in the online version of this article.
Correspondence to:
L. Rossi,
Citation:
Rossi, L., Vals, M., Montmessin, F., Forget, F., Millour, E., Fedorova, A., et al. (2021). The effect of the Martian 2018 global dust storm on HDO as predicted by a Mars global climate model. Geophysical Research Letters,
48, e2020GL090962. https://doi. org/10.1029/2020GL090962 Received 26 OCT 2020 Accepted 26 FEB 2021 10.1029/2020GL090962
RESEARCH LETTER
HDO and the warmer, condensation-free, regions where D/H is found to be maximum. This led M05 to predict a latitudinal gradient of D/H (with variations greater than a factor of 5) between the warm and moist summer hemisphere and the cold and dry winter hemisphere. This gradient was later confirmed by several Earth ground-based and Mars orbiting assets (Aoki et al., 2019; Encrenaz et al., 2018; Krasnopolsky, 2015; Villanueva et al., 2015). Yet some observations (Khayat et al., 2019; Villanueva et al., 2015) have revealed longitudinal variations of D/H ratios in appearance correlated to topography that were not reproduced by any model.
Since HDO and H2O dictate eventually how many D and H atoms will populate the Martian exosphere,
studying their escape and extrapolating back in times to infer the amount of water lost to space requires modeling their present-day behavior correctly in the lower atmosphere. It is therefore relevant to address the HDO cycle and its associated fractionation with respect to water in a 3D Mars climate model (GCM) akin to M05. The present work leverages on this past effort, and implements important changes that oc-curred between the 2005 GCM version and the one currently in use. Upgrading the HDO model enabled the possibility to test the theoretical reaction of HDO during the most extreme meteorologic event that can happen on Mars, namely a global dust storm (GDS). The Martian year 34 (henceforth MY34, corresponding to the 2017–2019 time frame) was the siege of a GDS that started in the middle of the year (Ls = 176°) and stopped shortly before perihelion (Ls = 235°) (Guzewich et al., 2018). This event profoundly affected the behavior of water vapor in the Martian atmosphere (Fedorova et al., 2020) with hints of a comparable affect for HDO (Vandaele et al., 2019).
The present study describes a 3D climate model projection of the behavior of HDO in the context of a dust annual scenario mimicking the dust seasonal and spatial evolution observed during MY34 which include the occurrence of the GDS. The simulations reported here emphasize the contrast in HDO behavior be-tween a perturbed year such as MY34 and a more traditional MY where the seasonal evolution of dust obeys a recurrent and more quiet, so-called ”climatological” scenario.
2. Model Overview
The simulations presented here were conducted with the Martian Global Climate Model (MGCM) devel-oped at the Laboratoire de Météorologie Dynamique (LMD) in collaboration with several European teams (LATMOS, IAA Granada, University of Oxford, The Open University), with support from ESA and CNES. A general description of the model is given in Forget et al. (1999). A first implementation of the water cycle was presented in Montmessin et al. (2004) (used in M05) and was then improved in Madeleine et al. (2011) and subsequently in Navarro et al. (2014), with the implementation of the radiative effect of clouds and the microphysics accounting for the fine processes of cloud formation as nucleation, ice growth, scavenging of dust by condensing ice, and supersaturation. However, those were not activated for the simulations con-ducted in this study. This is motivated by the desire to track changes added to the GCM since M05 before increasing model complexity. The simpler cloud approach of M05 employed here is nevertheless augmented by the predictive dust representation of Madeleine et al. (2011), which better constrains the availability of dust nuclei for water ice clouds to condense onto, even if the details of cloud-dust interactions (nuclea-tion, scavenging, and supersaturation as mentioned above) are not yet introduced. Observations from Earth (Khayat et al., 2019; Novak et al., 2011; Villanueva et al., 2015) are in agreement with predictions of M05 regarding the latitudinal variability of the D/H ratio over the column of atmosphere, supporting the idea that a simple cloud model carries enough physics to capture the effect of condensation-induced fractiona-tion on HDO. We also menfractiona-tion that since Colaïtis et al. (2013) the model integrates a thermal plume model to better represent the sub-grid scale convection occurring in the planetary boundary layer (PBL). This parametrization has been shown to significantly improve the wind and temperature structures near to the surface in comparison to observations and LES studies, which has a direct impact on the transport of water and dust above the PBL.
In this upgraded version of the HDO model, the vertical distribution of dust obeys a semi-interactive scheme (Madeleine et al., 2011) based on an order two moment representation of the dust tracer. Dust is injected everywhere and at every numerical time-step (15 min in our simulations) at the surface of the model by a constant lifting rate. Both the mass and the number of dust particles are transported, enabling
Geophysical Research Letters
the interactive derivation of the dust particle size in every model cell to better constrain dust sedimenta-tion. While the vertical profile of the dust evolves freely, sustaining changes due to winds and gravitational settling, the resulting opacity profile is multiplied by a scaling factor so that the column dust opacity of the model matches the observed column dust opacity as compiled by Montabone et al. (2015, 2020). The latter being the main parameter controlling the radiative balance of the atmosphere and thus the background thermal state. It also linearly scales the number of dust nuclei available for water ice cloud formation and thus ice crystal size and subsequent gravitational fall.
The MGCM used for our HDO simulations relies on a 64 × 48 longitude-latitude grid with 32 vertical levels, covering the atmospheric column from the surface up to 120 km (10−3 Pa). An extension to the
thermo-sphere up to the exobase around 250 km (Angelats i Coll et al., 2005; González-Galindo et al., 2009) and a photochemical module with 15 species (Lefèvre et al., 2004, 2008) are available in the model. However, these modules have not been activated in the simulations used for the present paper, since their integration will be part of a future study analyzing the whole HDO and D/H cycle.
2.1. Simulation of HDO
HDO is tracked in both its vapor and ice phases in the atmosphere and also on the surface as ice deposit. It is treated as a tracer separate from H2O, but undergoes the same condensation and transport processes.
Isotopic fractionation is introduced during condensation following the approach described by Fouchet and Lellouch (2000), Bertaux and Montmessin (2001) and later by M05.
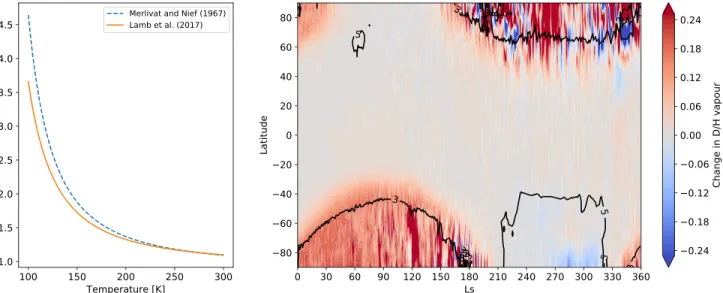
The fractionation factor α has been traditionally derived from the formula established by Merlivat and Nief (1967). This factor describes the relative enrichment of HDO in the ice with respect to the surround-ing vapor phase at equilibrium (i.e., no net flux between the two phases), for a temperature T, and can be expressed as: 2 2 2 2 ( / ) 16288 ( ) exp 9.34 10 ( / )vapice HDO H O T HDO H O T (1) We note that Equation 1 is based on experiments performed at temperatures above 233 K, warmer than typ-ical temperatures encountered on Mars, leading M05 to extrapolate Equation 1 down to temperatures as low as 100 K. However, recent experimental measurements from Lamb et al. (2017) were conducted between 234 and 194 K. In doing so, they updated the fractionation law and proposed a new formula:
2 2 13525 ( ) expT 5.59 10 T (2) The difference between the two formulas increases exponentially with decreasing temperature, from 3% at 200 K, to 8% at 150 K and 21% at 100 K (Figure 1). The Lamb formula yields a fractionation factor system-atically smaller than the classical Merlivat formula at Martian temperatures, which suggests the studies conducted so far on Martian HDO have slightly overestimated the fractionation factor. Lamb’s formula is used as a reference for this study.
We assume that the condensation flux is in isotopic equilibrium with the vapor phase. This is justified by the fact that diffusivity of HDO inside ice is too slow to homogenize HDO inside the ice particle. Therefore, the newly added icy layer is independent of the existing ones. In that context, the condensing mass dMD of HDO can be expressed as:
( ) D D H H M dM T dM M (3) where M indicates the mass in the vapor phase, dM the mass condensing, with subscript H referring to water and D to HDO.
In the model, the flux of water during cloud condensation is computed assuming that any supersaturated excess of water vapor is turned into atmospheric water ice (Montmessin et al., 2004). At the surface, the flux
of water is computed with the surface turbulent flux (Forget et al., 1999; Montmessin et al., 2004). In both cases, once the flux of water is known, the flux of HDO is computed using Equation 3. The temperature used to compute α(T) is that of the atmospheric layer condensing (for the particular case of the surface flux, it corresponds to the temperature of the first layer above the surface).
A significant difference with M05 is the implementation of the ”tracer genealogy” scheme developed by Risi et al. (2010) to study the HDO atmospheric cycle in the LMDZ Earth GCM. M05 had an older version of the dynamical core of the GCM that did not include or require this specific transport of isotopes in the tracer scheme. In this scheme, the isotopic ratio is transported by the dynamical transport scheme instead of HDO itself (more details about this transport scheme can be found in the appendix of Risi et al., 2010, and in the Supplementary Information). The implementation of the ”tracer genealogy” scheme has significantly improved the GCM results by eliminating the unphysical isotopic ratios initially observed.
2.2. Dust Scenarios
We employ two dust scenarios for this study. We are calling ”dust scenario” the prescription in the model of the seasonal evolution and the spatial variation of the dust column opacity. The scenarios for each MY have been compiled by Montabone et al. (2015), and the dust scenario relevant to MY34 that encompasses the 2018 GDS was recently added by Montabone et al. (2020) to the existing database.
The first one is the climatology scenario, which corresponds to an average of non-GDS Martian years, and that is used as our reference run. The other one is the dust scenario of MY34, which includes the dust storm occurrence between Ls = 176° and Ls = 235°.
The MY34 GDS started in May 2018 in the northern hemisphere and progressively expanded to eventually enshroud the entire Martian globe by June 2018 (Ls = 186°). Then the GDS progressively faded and let the Mars atmosphere return to a nominal (climatological) state from August to September 2018 (Ls = 270°) (Montabone et al., 2020; Snchez-Lavega et al., 2019).
2.3. Initial Conditions
The initial conditions of the simulation impose a constant D/H ratio of 5 everywhere in the atmosphere and in the surface ice. The perennial ice in the northern polar cap acts as an infinite reservoir of water ice, which is also prescribed to have a D/H ratio of 5.
Figure 1. (Left) Value of the fractionation factor α as derived from Lamb et al. (2017) or Merlivat and Nief (1967). (Right) Change on the zonally averaged
seasonal variation of the D/H ratio. The absolute difference is showed between the use of the formula from Lamb et al. (2017) and that of Merlivat and
Geophysical Research Letters
In order to reproduce the column of water vapor, in particular the peak of the subliming north pole in northern spring and summer, we had to adjust the albedo of the perennial surface ice, as described in Navarro et al. (2014), to a value of 0.32 yielding a maximum column abundance of 70 pr.-μm similar to observations (Trokhimovskiy et al., 2015).
We start using the climatology scenario and run the model for a couple of Mars years, allowing us to reach a stable state. The resulting model state, after this two-year spin-up phase, supplies the new initial conditions of two following simulations: one based on the ”climatology” dust scenario, and one based on the MY34 dust scenario.
3. Results
3.1. Reference Run: The ”Climatological” Scenario
Figure 2 (center column) shows the latitudinal and seasonal distribution of the zonally averaged column abundance of HDO vapor along with the corresponding D/H ratio. In essence, HDO vapor and ice repro-duce the global cycle of water vapor and ice with a peak of vapor and atmospheric ice abundance in the Aphelion period where the north polar cap, fully exposed to the Sun, rejects massive amounts of water and heavy water in the atmosphere. At the same time, water ice clouds are building up in the northern tropics where air masses ascend and adiabatically cool as a consequence of a global convergence of the atmosphere in the lower atmosphere, causing the recurrent apparition of the ”Aphelion” cloud belt.
In summary, the polar night in both hemispheres, which encompasses the Ls = 180° to Ls = 360° period in the north and the Ls = 0° to Ls = 180° period in the south, extends equatorward up to 45° near solstices. These regions host the coldest atmospheric temperature overall and as a result the most active water ice con-densation mechanism. Likewise, HDO condenses a lot in these regions and is subsequently heavily fraction-ated, even more because of the exponential increase of the fractionation factor with decreasing temperature (α doubles between 150 and 100 K). This results in a 5:1 gradient between the polar night regions and the regions elsewhere in both hemispheres. Remarkably, the edge of the polar night corresponds to a sharp gra-dient in D/H, indicating fractionation is very effective there and rather ineffective in regions equatorward.
10.1029/2020GL090962
Figure 2. Seasonal evolution of the zonally averaged column of H2O (a and b) and HDO (d and e) in the vapor phase, for the climatology and Martian year 34 (MY34) scenarios. Below is the corresponding D/H ratios in terms of standard mean ocean water (SMOW) (g and h), for the vapor phases. Units are precipitable microns or nanometers. Left column is for MY34, center column for the climatology scenario and right column (c, f, and i) is the absolute difference between MY34 and climatology. A similar figure for the ice phase can be found in the supplementary information.
Therefore, the latitudinal gradient suggested by M05 between the cold regions and the warm regions, and whose existence has been confirmed later by several observers, is also present in our simulation.
Clearly, an event such as the Aphelion Cloud belt has no strong D/H signature in a column-integrated perspective since (1) the cloud belt results from moderately cold temperature (180 K) condensation and (2) forms above 10–15 km where atmospheric density has already dropped by a factor 3 to 10, fractionating HDO over a small portion of the column. Altogether, this explains why the global effect of fractionation on Mars is so much dominated by the polar regions.
3.2. The Martian Year 34 Run: Impact of the Global Dust Storm
Figure 2 (left column) shows the latitudinal and seasonal evolution of the HDO vapor column and D/H ra-tio, this time for the MY34 dust scenario. The difference with the climatology scenario is shown in the right panels. One can note that the D/H ratios over the column are quite similar, suggesting that the dust storm does not affect the isotopic ratio of the atmosphere as a whole.
In order to assess the effect that the dust storm may potentially have on the vertical transport of H2O and
HDO and its evolution with time, we analyze zonally averaged meridional profiles of these quantities (Fig-ure 3). This figure shows a comparison of the computed meridional profiles between the climatology and the MY34 scenarios. The influence of the dust storm is evident on the temperature field with a strong (>20 K) increase of the temperatures in the whole atmosphere due to heating by dust.
Increased dust content has a direct effect on fractionation: higher temperatures restrain condensation, and the subsequent cloud formation in the middle atmosphere exhibited in the Climatological run is pushed to higher altitudes in the MY34 run. Condensation being the main source of isotopic fractionation for water, the deuteropause, that is the level above which D/H declines due to condensation-induced fractionation (Bertaux & Montmessin, 2001), is found around 100 Pa in the climatology run throughout the same Ls pe-riod as the GDS run. In the MY34 run, clouds are forming above 10 Pa, moving the deuteropause higher in altitude, leaving the D/H ratio mostly unchanged vertically below that level with values of 4.5 reached at 10 Pa, instead of 3.5 in the climatology run. This implies that the vertical barrier of deuterium becomes 30% more porous in a MY34 configuration, likely letting the same excess of deuterium atoms accessing the upper atmosphere where they can escape to space.
The GDS therefore affects the D/H profile in two ways: (1) higher temperature suppresses the vertical con-finement imposed by condensation with associated fractionation, (2) intensified atmospheric circulation conveys higher amount of water and its isotope to much higher altitude. This effect on D/H, predicted here by our HDO model, has been already highlighted for water by concomitant observations from the instru-ments ACS and NOMAD onboard TGO (Aoki et al., 2019; Fedorova et al., 2020; Vandaele et al., 2019) and also reproduced by a GCM (Neary et al., 2020).
Figure 4 shows vertical profiles of the planetary-averaged amount of H2O and HDO vapor and the related
D/H ratio, averaged over the second half of the year (Ls = 180° − 360°). The effect of the GDS is quite visible on the water and HDO vapor with a sharp increase in the mixing ratio at most altitudes above 100 Pa in the case of the MY34 scenario. The amount of water is increased in the upper atmosphere by about 10%, but the effect is even stronger for HDO with an increase by 40% which directly scales with the escaping flux of deuterium and can be attributed to the reduced efficiency of the deuteropause. On average over the dust-storm season, the D/H at high altitude is greater by 25% compared to a regular year represented by the climatology run.
4. Discussion
Our scenario of the MY34 GDS is not fully representative of the observed conditions. In particular, regard-ing the dust profile and the altitude of the hygropause. In our simulations, the dust remains mostly below 70 km, while observations from MCS show that the dust reached altitudes up to 80 km during the storm (Kass et al., 2020). And the height of the hygropause is limited to 60–65 km in our simulation, while obser-vations show that it extended up to 75–80 km during the GDS (Heavens et al., 2019).
Geophysical Research Letters
These discrepancies may be attributed to missing physical processes in the model. First, we ignore the radi-ative effect of clouds and the microphysics of cloud formation. These affect the temperatures and enhance the global circulation, as discussed in Madeleine et al. (2011) and Navarro et al. (2014). This could result in an overestimation of the ice content and a reduced transport of water vapor. In addition, without taking microphysics into account, it is not possible to reproduce the important supersaturation observed by ACS during the GDS, and which is thought to help water vapor reaching higher altitudes (Fedorova et al., 2020). Second, Madeleine et al. (2011) particularly mention the limits of uniformly lifting dust in the case of strong dust storm events, as it does not account for the strong positive feedback between atmospheric dust heating and lifting occurring then. However, other approaches using finer parametrizations of dust lifting have
10.1029/2020GL090962
Figure 3. Zonally averaged meridional profiles of (from top to bottom) temperature (a) and (b), dust extinction at
500 nm (c and d), H2O vapor (e and f), HDO ice (g and h) and D/H ratio of the vapor (i and j), at a local-time of 14
h and at solar longitude Ls = 210°. The left column is the Climatology scenario and the right column is MY34. The
contours on panels (e and f) are the zonally averaged stream function (in units of 109 kg/s), with positive values
similar difficulties reproducing the dust vertical distribution in the GDS conditions (Neary et al., 2020). Finally, the model doesn’t account for the convective events suspected to be responsible for the presence of the detached dust layers (Daerden et al., 2015; Heavens et al., 2018; Spiga et al., 2013; Wang et al., 2018). As discussed by Neary et al. (2020), an underestimation of the amount of dust above 40 km leads to insufficient heating, leaving the formation of ice particles possible and therefore restraining the extent of water vapor in the upper atmosphere.
For these reasons, we suspect that our simulation could in fact overestimate the efficiency of the deutero-pause. It is thus possible that the increased amount of HDO at high altitudes caused by the GDS as in our simulation, is in fact a lower estimate of the real effect. While we are not able to represent the full extent of the GDS of MY34, our results feature the essential processes occurring in such situation, in particular the reduction of the condensation-induced fractionation, which defines the altitude of the deuteropause, and the increase in atmospheric circulation.
5. Conclusions
We have presented an updated model of the Martian HDO cycle inherited from Montmessin et al. (2005) and leveraging on the work done since then in particular by Madeleine et al. (2011). This model, which rep-resents the 3D advection of HDO along with the physical processes controlling the fate of HDO in the Mar-tian atmosphere, has been employed to explore for the first time the theoretical impact of a GDSon HDO. Of particular interest is the access of HDO to the upper atmospheric layers where it is subsequently chemically decomposed into escaping deuterium atoms. In doing so, we find that the presence in increased amounts of dust in the atmosphere at times of the GDS restrains condensation and cloud formation, mostly removing the effect of condensation-induced fractionation. The deuteropause, that is otherwise predicted to remain at an approximate altitude of 30 km in a regular year is pushed up to 50 km and appears more porous than in our climatology run representative of average climatic conditions on Mars. The GDS is predicted to enhance the presence of deuterated water at 100 km by 40%, implying that a similar excess of deuterium atoms might escape from Mars in a year of a GDS.
The detailed effects of GDS on the amount of HDO in the upper atmosphere will be further explored in-cluding detailed cloud microphysics and cloud radiative feedbacks, which are known to affect the cloud formation (Navarro et al., 2014), and should have an effect on condensation-induced fractionation. The
Figure 4. Planetary averaged profiles of H2O vapor (a), HDO vapor (b) and D/H ratio of the vapor (c) averaged over the period Ls = 180° − 360° for the
Geophysical Research Letters
details of the photochemistry and processes occurring in the thermosphere are missing from the present simulation, but are essential to represent the differential photolysis of H2O and HDO and their subsequent
escape. These processes will be the object of future improvements of the LMD MGCM, in particular in the context of detailed comparison with available spacecraft observations from ACS onboard TGO. They will help us better understand the global cycle of deuterium from the troposphere to the exosphere, and supply a self-consistent framework to investigate its relation with the escape of water from the planet.
Data Availability Statement
The data used to produce the figures presented in this article can be obtained on the following link: https:// doi.org/10.14768/7f37269b-7e29-42de-a365-139e703a5fc4.
References
Angelats i Coll, M., Forget, F., López-Valverde, M., & González-Galindo, F. (2005). The first Mars thermospheric general circulation model: The martian atmosphere from the ground to 240 km. Geophysical Research Letters, 32(4), L04201. https://doi.org/10.1029/2004GL021368
Aoki, S., Vandaele, A. C., Daerden, F., Villanueva, G. L., Liuzzi, G., Thomas, I. R., & the NOMAD Team. (2019). Water vapor vertical profiles on mars in dust storms observed by TGO/NOMAD. Journal of Geophysical Research: Planets, 124(12), 3482–3497. https://doi. org/10.1029/2019JE006109
Bertaux, J.-L., & Montmessin, F. (2001). Isotopic fractionation through water vapor condensation: The deuteropause, a cold trap for deute-rium in the atmosphere of mars. Journal of Geophysical Research, 106(E12), 32879–32884. https://doi.org/10.1029/2000JE001358
Bibring, J.-P., Langevin, Y., Mustard, J. F., Poulet, F., Arvidson, R., Gendrin, A., & Neukum, G. (2006). Global mineralogical and aqueous mars history derived from OMEGA/Mars express data. Science, 312(5772), 400–404. https://doi.org/10.1126/science.1122659
Carr, M. H., & Head, J. W., III (2003). Oceans on Mars: An assessment of the observational evidence and possible fate. Journal of
Geophys-ical Research, 108(E5), 5042. https://doi.org/10.1029/2002JE001963
Cheng, B.-M., Chew, E. P., Liu, C.-P., Bahou, M., Lee, Y.-P., Yung, Y. L., & Gerstell, M. F. (1999). Photo-induced fractionation of water isoto-pomers in the Martian atmosphere. Geophysical Research Letters, 26(24), 3657–3660. https://doi.org/10.1029/1999GL008367
Colaïtis, A., Spiga, A., Hourdin, F., Rio, C., Forget, F., & Millour, E. (2013). A thermal plume model for the Martian convective boundary layer. Journal of Geophysical Research: Planets, 118, 1468–1487. https://doi.org/10.1002/jgre.20104
Daerden, F., Whiteway, J. A., Neary, L., Komguem, L., Lemmon, M. T., Heavens, N. G., & Smith, M. D. (2015). A solar escalator on Mars: Self-lifting of dust layers by radiative heating. Geophysical Research Letters, 42(18), 7319–7326. https://doi.org/10.1002/2015GL064892
Encrenaz, T., DeWitt, C., Richter, M. J., Greathouse, T. K., Fouchet, T., Montmessin, F., & Sagawa, H. (2018). New measurements of D/H on Mars using EXES aboard SOFIA. Astronomy and Astrophysics, 612, A112. https://doi.org/10.1051/0004-6361/201732367
Fedorova, A. A., Montmessin, F., Korablev, O., Luginin, M., Trokhimovskiy, A., Belyaev, D. A., & Wilson, C. F. (2020). Stormy water on Mars: The distribution and saturation of atmospheric water during the dusty season. Science, 367, 297–300. https://doi.org/10.1126/ science.aay9522
Forget, F., Hourdin, F., Fournier, R., Hourdin, C., Talagrand, O., Collins, M., & Huot, J.-P. (1999). Improved general circulation models of the Martian atmosphere from the surface to above 80 km. Journal of Geophysical Research, 104(E10), 24155–24175.
Fouchet, T., & Lellouch, E. (2000). Vapor pressure isotope fractionation effects in planetary atmospheres: Application to deuterium. Icarus,
144(1), 114–123. https://doi.org/10.1006/icar.1999.6264
González-Galindo, F., Forget, F., López-Valverde, M. A., Angelats i Coll, M., & Millour, E. (2009). A ground-to-exosphere Martian gen-eral circulation model. 1. Seasonal, diurnal and solar cycle variation of thermospheric temperatures. Journal of Geophysical Research,
114(E13), 4001. https://doi.org/10.1029/2008JE003246
Guzewich, S. D., Lemmon, M., Smith, C., Martínez, G., de Vicente-Retortillo, Á., Newman, C., & others (2018). Mars science laboratory observations of the 2018/Mars year 34 global dust storm. Geophysical Research Letters, 46, 71–79. https://doi.org/10.1029/2018GL080839
Heavens, N. G., Kass, D. M., & Shirley, J. H. (2019). Dusty deep convection in the mars year 34 planet-encircling dust event. Journal of
Geophysical Research: Planets, 124(11), 2863–2892. https://doi.org/10.1029/2019JE006110
Heavens, N. G., Kleinböhl, A., Chaffin, M. S., Halekas, J. S., Kass, D. M., Hayne, P. O., & Schofield, J. T. (2018). Hydrogen escape from Mars enhanced by deep convection in dust storms. Nature Astronomy, 2, 126–132. https://doi.org/10.1038/s41550-017-0353-4
Kass, D. M., Schofield, J. T., Kleinbhl, A., McCleese, D. J., Heavens, N. G., Shirley, J. H., & Steele, L. J. (2020). Mars climate sounder ob-servation of Mars’ 2018 global dust storm. Geophysical Research Letters, 47, e2019GL083931. https://doi.org/10.1029/2019GL083931
Khayat, A. S., Villanueva, G. L., Smith, M. D., & Guzewich, S. D. (2019). IRTF/CSHELL mapping of atmospheric HDO, H2O and D/H on
Mars during northern summer. Icarus, 330, 204–216. https://doi.org/10.1016/j.icarus.2019.04.007
Krasnopolsky, V. A. (2015). Variations of the HDO/H2O ratio in the Martian atmosphere and loss of water from Mars. Icarus, 257, 377–386. https://doi.org/10.1016/j.icarus.2015.05.021
Lamb, K. D., Clouser, B. W., Bolot, M., Sarkozy, L., Ebert, V., Saathoff, H., & Moyer, E. J. (2017). Laboratory measurements of HDO/H2O
iso-topic fractionation during ice deposition in simulated cirrus clouds Proceedings of the National Academy of Sciences 114(22), 5612–5617.
https://doi.org/10.1073/pnas.1618374114
Lefèvre, F., Bertaux, J.-L., Clancy, R. T., Encrenaz, T., Fast, K., Forget, F., & Perrier, S. (2008). Heterogeneous chemistry in the atmosphere of Mars. Nature, 454, 971–975. https://doi.org/10.1038/nature07116
Lefèvre, F., Lebonnois, S., Montmessin, F., & Forget, F. (2004). Three-dimensional modeling of ozone on Mars. Journal of Geophysical
Research, 109, E07004. https://doi.org/10.1029/2004JE002268
Madeleine, J.-B., Forget, F., Millour, E., Montabone, L., & Wolff, M. J. (2011). Revisiting the radiative impact of dust on mars using the LMD global climate model. Journal of Geophysical Research, 116(E11). https://doi.org/10.1029/2011JE003855
Merlivat, L., & Nief, G. (1967). Fractionnement isotopique lors des changements dtat solide-vapeur et liquide-vapeur de l’eau des tempra-tures infrieures 0°C. Tellus, 19(1), 122–127. https://doi.org/10.1111/j.2153-3490.1967.tb01465.x
10.1029/2020GL090962
Acknowledgments
The authors thank Camille Risi for her valuable help on the new isotopic trans-port scheme. Loïc Rossi acknowledges the support he received from the Excel-lence Laboratory ”Exploration Spatiale des Environnements Planétaires (ESEP)” and from CNES. Margaux Vals is supported by DIM ACAV labeled by the Île-de-France region in support for the research (Domaine d’Intérêt Majeur, Astrophysique et Conditions d’Apparition de la Vie). The project ac-knowledges funding by Roscosmos and CNES. Science operations of ACS are funded by Roscosmos and ESA. Oleg Korablev, Anna Fedorova and Alexan-der Trokhimovskiy in IKI are funded by RSF grant number 20-42-09035.
Montabone, L., Forget, F., Millour, E., Wilson, R., Lewis, S., Cantor, B., & Wolff, M. (2015). Eight-year climatology of dust optical depth on Mars. Icarus, 251, 65–95. https://doi.org/10.1016/j.icarus.2014.12.034
Montabone, L., Spiga, A., Kass, D. M., Kleinbhl, A., Forget, F., & Millour, E. (2020). Martian year 34 column dust climatology from mars cli-mate sounder observations: Reconstructed maps and model simulations. Journal of Geophysical Research: Planets, 125, e2019JE006111.
https://doi.org/10.1029/2019JE006111
Montmessin, F., Forget, F., Rannou, P., Cabane, M., & Haberle, R. (2004). Origin and role of water ice clouds in the Martian water cycle as inferred from a general circulation model. Journal of Geophysical Research, 109(E10). https://doi.org/10.1029/2004JE002284
Montmessin, F., Fouchet, T., & Forget, F. (2005). Modeling the annual cycle of HDO in the Martian atmosphere. Journal of Geophysical
Research, 110(E3), E10004. https://doi.org/10.1029/2004JE002357
Navarro, T., Madeleine, J.-B., Forget, F., Spiga, A., Millour, E., Montmessin, F., & Mttnen, A. (2014). Global climate modeling of the Mar-tian water cycle with improved microphysics and radiatively active water ice clouds. Journal of Geophysical Research: Planets, 119(7), 1479–1495. https://doi.org/10.1002/2013JE004550
Neary, L., Daerden, F., Aoki, S., Whiteway, J., Clancy, R., Smith, M., & others (2020). Explanation for the increase in high-altitude wa-ter on Mars observed by nomad during the 2018 global dust storm. Geophysical Research Letwa-ters, 47(7), e2019GL084354. https://doi. org/10.1029/2019GL084354
Novak, R., Mumma, M., & Villanueva, G. (2011). Measurement of the isotopic signatures of water on mars: Implications for studying methane. Planetary and Space Science, 59(2), 163–168. https://doi.org/10.1016/j.pss.2010.06.017
Owen, T., Maillard, J. P., de Bergh, C., & Lutz, B. L. (1988). Deuterium on Mars: The Abundance of HDO and the value of D/H. Science,
240(4860), 1767–1770. https://doi.org/10.1126/science.240.4860.1767
Risi, C., Bony, S., Vimeux, F., & Jouzel, J. (2010). Water-stable isotopes in the LMDZ4 general circulation model: Model evaluation for present-day and past climates and applications to climatic interpretations of tropical isotopic records. Journal of Geophysical Research,
115, D12118. https://doi.org/10.1029/2009JD013255
Snchez-Lavega, A., del R-o-Gaztelurrutia, T., Hernndez-Bernal, J., & Delcroix, M. (2019). The onset and growth of the 2018 Martian global dust storm. Geophysical Research Letters, 46(11), 6101–6108. https://doi.org/10.1029/2019GL083207
Spiga, A., Faure, J., Madeleine, J.-B., Määttänen, A., & Forget, F. (2013). Rocket dust storms and detached dust layers in the Martian atmos-phere. Journal of Geophysical Research: Planets, 118, 746–767. https://doi.org/10.1002/jgre.20046
Trokhimovskiy, A., Fedorova, A., Korablev, O., Montmessin, F., Bertaux, J.-L., Rodin, A., & Smith, M. D. (2015). Mars water vapor mapping by the SPICAM IR spectrometer: Five Martian years of observations. Icarus, 251, 50–64. https://doi.org/10.1016/j.icarus.2014.10.007
Vandaele, A. C., Korablev, O., Daerden, F., Aoki, S., Thomas, I. R., Altieri, F., & others (2019). Martian dust storm impact on atmospheric H2O and D/H observed by ExoMars trace gas orbiter. Nature, 568(7753), 521–525.
Villanueva, G. L., Mumma, M. J., Novak, R. E., Käufl, H. U., Hartogh, P., Encrenaz, T., & Smith, M. D. (2015). Strong water isotopic anom-alies in the Martian atmosphere: Probing current and ancient reservoirs. Science, 348(6231), 218–221. https://doi.org/10.1126/science. aaa3630
Wang, C., Forget, F., Bertrand, T., Spiga, A., Millour, E., & Navarro, T. (2018). Parameterization of Rocket dust storms on Mars in the LMD Martian GCM: Modeling details and validation. Journal of Geophysical Research: Planets, 123(4), 982–1000. https://doi. org/10.1002/2017JE005255
References From the Supporting Information
Hourdin, F. (2005). Représentation du transport direct et inverse dans les modèles globaux de climat et étude des couplages entre composition
et dynamique atmosphérique sur titan. Orsay, France:Habilitation à Diriger des Rechx.
Van Leer, B. (1977). Towards the ultimate conservative difference scheme: IV. A new approach to numerical convection, Journal of