HAL Id: hal-03104002
https://hal.archives-ouvertes.fr/hal-03104002
Submitted on 8 Jan 2021
HAL is a multi-disciplinary open access
archive for the deposit and dissemination of
sci-entific research documents, whether they are
pub-lished or not. The documents may come from
teaching and research institutions in France or
abroad, or from public or private research centers.
L’archive ouverte pluridisciplinaire HAL, est
destinée au dépôt et à la diffusion de documents
scientifiques de niveau recherche, publiés ou non,
émanant des établissements d’enseignement et de
recherche français ou étrangers, des laboratoires
publics ou privés.
Diurnal Variations of Dust During the 2018 Global Dust
Storm Observed by the Mars Climate Sounder
Armin Kleinböhl, Aymeric Spiga, David Kass, James Shirley, Ehouarn
Millour, Luca Montabone, Francois Forget
To cite this version:
Armin Kleinböhl, Aymeric Spiga, David Kass, James Shirley, Ehouarn Millour, et al..
Diurnal
Variations of Dust During the 2018 Global Dust Storm Observed by the Mars Climate Sounder.
Journal of Geophysical Research.
Planets, Wiley-Blackwell, 2020, 125 (1), pp.e2019JE006115.
Armin Kleinböhl1 , Aymeric Spiga2,3 , David M. Kass1 , James H. Shirley1 , Ehouarn Millour2 , Luca Montabone2,4 , and François Forget2
1Jet Propulsion Laboratory, California Institute of Technology, Pasadena, CA, USA,2Laboratoire de Météorologie
Dynamique (LMD/IPSL), Sorbonne Université, Centre National de la Recherche Scientifique, École Polytechnique, École Normale Supérieure, Paris, France,3Institut Universitaire de France, Paris, France,4Space Science Institute,
Boulder, CO, USA
Abstract
We report observations by the Mars Climate Sounder showing strong diurnal variations in temperature and the vertical dust distribution during the 2018 (Mars Year 34) global dust event. The temperature field shows weak diurnal tidal activity at equatorial latitudes but a strong diurnal tide in middle to high latitudes with a maximum amplitude of 29 K in the lower atmosphere of the south polar region. The diurnal variability of dust is small in the equatorial region and increases toward higher latitudes. At middle and low latitudes, comparable dust amounts are found about 5–10 km higher in the atmosphere on the dayside than on the nightside. The dust reaches the highest altitudes in the late afternoon and is found at the lowest altitudes in the late night. In the southern high latitudes a persistent cold air mass with low dust content is identified on the nightside of the planet centered at 3–6 a.m. local time. The observed variations are well represented by model simulations with the Laboratoire de Météorologie Dynamique General Circulation Model. Comparisons between data and model results suggest that the diurnal variations in the dust are largely driven by the meridional circulation exhibiting diurnal tidal variations. The model results show that the compact air mass in the south polar region has a high potential vorticity, supporting its interpretation as a remnant of the southern polar vortex, which is forced toward the nightside of the planet due to the enhanced diurnal tide during the global dust event.Plain Language Summary
One of the most distinctive features of the Martian atmosphere are global dust storms, one of which occurred in 2018. We report on observations of the vertical structure of atmospheric temperature and dust by the Mars Climate Sounder onboard Mars Reconnaissance Orbiter. Strong differences between day and night are found in both temperature and dust vertical structure. The strongest temperature variations are observed in the south polar atmosphere, with temperature differences up to 58◦C/136◦F between day and night. Comparable dust amounts are found 5–10 km (3–6 miles) higher in the atmosphere on the dayside than on the nightside at central and equatorial latitudes. In the southern polar region a persistent cold body of air with low dust is identified on the nightside of the planet. The observations are compared with the results from a global atmospheric computer model. The observed temperature and dust distribution and their variations over the Martian day are well represented by the model. The diurnal variations in the dust are largely driven by diurnal changes in the large-scale atmospheric circulation. The compact body of air in the south polar region is forced to the nightside by this altered circulation but does not dissipate for several months.1. Introduction
Global, or planet-encircling, dust storms or dust events (hereafter referred to as GDEs) are the probably the most distinctive features of the Martian atmosphere. They can lift dust well into the middle atmosphere, enshroud the planet with dust for months, and have a profound effect on atmospheric temperatures and the overall circulation (Kahre et al., 2017; Smith et al., 2017). In contrast to regional dust storms, GDEs do not occur every Mars year. Historically, GDEs occur in about one Mars year out of three (Shirley, 2015; Martin & Zurek, 1993; Zurek & Martin, 1993), although the most recent GDE in 2018 occurred only after a hiatus of five Mars years. Six GDEs have been observed by orbital assets around Mars to date. These include the GDEs of 1971 (MY9) that was observed by Mariner 9 (Martin, 1974a, 1974b), two GDEs in 1977 (MY12)
Special Section:
Studies of the 2018/Mars Year 34 Planet-Encircling Dust Storm
Key Points:
• The Mars Climate Sounder observes strong diurnal variations in the vertical distribution of dust during the 2018 global dust storm • Dust diurnal variability at low
and middle latitudes is largely related to the meridional circulation exhibiting diurnal tidal variations • Diurnal variations at south polar
latitudes are related to a remnant of the polar vortex confined to the nightside of the planet
Supporting Information: • Supporting Information S1 • Data Set S1 Correspondence to: A. Kleinböhl, [email protected] Citation:
Kleinboehl, A., Spiga, A., Kass, D. M., Shirley, J. H., Millour, E.,
Montabone, L., & Forget, F. (2020). Diurnal variations of dust during the 2018 global dust storm observed by the Mars Climate Sounder. Journal of Geophysical Research: Planets, 125, e2019JE006115. https://doi.org/10. 1029/2019JE006115
Received 3 JUL 2019 Accepted 2 OCT 2019
Accepted article online 18 OCT 2019 Corrected 2 JUL 2020
This article was corrected on 2 JUL 2020. See the end of the full text for details.
©2019. American Geophysical Union. All Rights Reserved.
Journal of Geophysical Research: Planets
10.1029/2019JE006115
observed by the Viking Orbiters 1 and 2 (Ryan and Sharman, 1981), and the GDE in 2001 observed by the Mars Global Surveyor (Cantor, 2007; Smith et al., 2002). The GDE of 2007 (MY28) and the most recent GDE of 2018 (MY34) were observed from orbit by Mars Odyssey, Mars Express, and the Mars Reconnaissance Orbiter (MRO; e.g., Kass et al., 2019; Kleinböhl et al., 2014; Smith, 2009; Wolkenberg et al., 2018).Most quantitative dust measurements from orbiters during GDEs have provided dust column amounts that are available only on the dayside part of the orbit. Camera observations that use reflected sunlight (Cantor, 2007) are only available during daylight. Nadir viewing infrared observations, which rely on the surface-atmosphere temperature contrast for the retrieval of dust columns, are typically also only available during daytime (Smith et al., 2002; Smith, 2009). Dust profile observations at infrared wavelengths can be performed during daytime and nighttime, but such observations have been rare and sparse during GDEs. Clancy et al. (2010) analyzed limb observations from the Thermal Emission Spectrometer on Mars Global Surveyor and found that dust reached altitudes up to ∼80 km during the peak of the 2001 GDE. Dust profiles tended to be largely well mixed up to a certain altitude, above which the dust extinction started to decrease rapidly. This behavior was confirmed with limb observations by the Mars Climate Sounder (MCS) during the 2007 GDE (Kleinböhl et al., 2014). However, restrictions of its scanning capability at the time prevented MCS from acquiring on-planet measurements in addition to limb measurements, restricting the retrievable altitude range to the middle atmosphere. Wolkenberg et al. (2018) analyzed solar infrared occultation obser-vations by the SPICAM instrument on Mars Express and provided constraints on the extinction as well as the particle size distributions of dust and water ice aerosols during the 2007 GDE.
The recent 2018 GDE on Mars provides a unique opportunity to gain insight into the behavior of these large-scale dust events using dust profile observations by MCS. Kass et al. (2019) provide an initial overview of MCS observations obtained during the GDE. Here we expand on these initial analyses by focusing on differences in the dust distributions between daytime and nighttime observations. We use zonal averages of MCS dust profile measurements to evaluate variations in the observed dust distribution with local time between southern high and northern midlatitudes. We compare the measured dust distributions with results from the General Circulation Model (GCM) by the Laboratoire de Météorologie Dynamique (LMD) and draw conclusions on the mechanisms that drive the observed variability.
2. MCS Instrument and Retrievals
The Mars Climate Sounder (McCleese et al., 2007) is an infrared thermal emission radiometer on board the Mars Reconnaissance Orbiter (Zurek and Smrekar, 2007). With its five mid-infrared, three far infrared, and one broadband visible/near-infrared channels it measures radiances in limb and on-planet viewing geome-tries. Each channel consists of a linear array of 21 detectors, which provides an instantaneous measurement of a radiance profile when pointed at the limb. From these radiance measurements, profiles of atmospheric temperature, dust, and water ice are retrieved from the surface to ∼80 km altitude with a vertical resolution of ∼5 km (Kleinböhl et al., 2009, 2011; Kleinböhl, Friedson, et al., 2017). Retrieved profiles are reported on a regular pressure grid with a spacing of eight levels per scale height. Altitude information relies largely on spacecraft pointing, which introduces an intrinsic uncertainty of the order of 1 km. Temperature measure-ments exploit the atmospheric emission of the CO2band around 660 cm−1. Dust and water ice extinction
retrievals are centered on major absorption bands at 463 and 843 cm−1, respectively. Dust extinction is
rep-resented through Mie scattering by particles that follow a modified𝛤 distribution with an effective radius of 1.06 μm (Kleinböhl et al., 2011) with dust spectroscopic parameters based on Wolff and Clancy (2003). This leads to an extinction efficiency of 0.3506 (Kleinböhl et al., 2011).
For the dusty conditions experienced during the GDE, the MCS dust retrievals have been expanded by incor-porating radiance information from the MCS far infrared channel centered at 316 cm−1. The dust extinction
efficiency for this channel was derived empirically by evaluating ratios between measured and calculated radiances in the channel between southern high and northern midlatitudes during the dusty season of MY29 (February–August 2009), when dust was the predominant aerosol in the atmosphere. An average extinction efficiency of 0.1766 at 316 cm−1was calculated from these measurements (Kleinböhl, Chen, et al., 2017),
which is nearly identical to the value derived theoretically from the particle size distribution in Kleinböhl et al. (2011). The retrieval algorithm invokes detectors from the far infrared channel at 316 cm−1during the
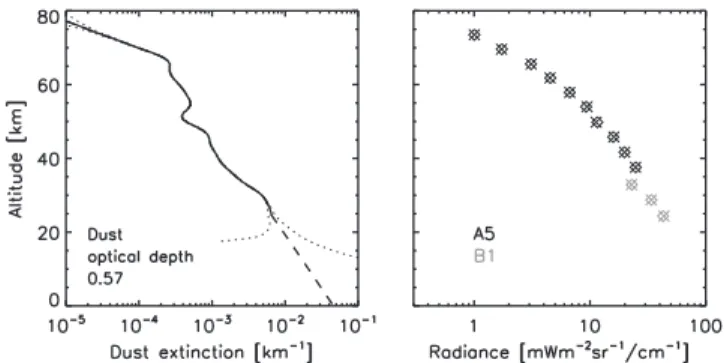
iterative retrieval process when it finds that the line-of-sight optical depth in the corresponding mid-infrared detectors under high opacity conditions becomes too large to be useful for a profile retrieval. Figure 1 shows
Figure 1. Limb retrieval of an equatorial dust extinction profile during the 2018 GDE at Ls= 197◦(22 June 2018) using
a combination of MCS channels in the mid-infrared and far infrared. (left) The retrieved dust extinction profile at a frequency of 463 cm−1is given as a solid line, with the dotted lines indicating error estimates. The dashed line shows a
homogeneously mixed extrapolation from the lowest altitude at which profile information is available. (right) Measured (crosses) and fitted (diamonds) radiances for detectors in the channel at 463 cm−1(A5, black) and the
channel at 316 cm−1(B1, gray) at the altitudes where they were used for retrieval.
an example of a dust profile retrieval at low latitudes during the 2018 GDE. The limb retrieval uses the mid-infrared channel (A5) down to an altitude of 35 km and supplements detectors from the far infrared channel (B1) below this altitude. Because the far infrared extinction efficiency is only about half of the mid-infrared extinction efficiency, the use of the far infrared channel extends the retrievable altitude range typically between 1 and 1.5 scale heights. The retrieval has good sensitivity down to dust extinction levels of 10−5km−1, which are found close to 80 km altitude in Figure 1. We note that lower dust extinctions might
be impacted by systematic uncertainties due to imperfect representations of the instrument's field of view (Kleinböhl et al., 2015). Dust extinction profiles are reported with reference to a frequency of 463 cm−1at all
altitudes using the extinction efficiency ratio between the far and mid-infrared for conversion. Extending the dust profile homogeneously from the lowest retrievable altitude to the surface (dashed line in Figure 1) provides an estimate of the dust column optical depth. The column dust optical depth for this measurement is estimated to be 0.57 at 463 cm−1. A homogeneously mixed profile in the lower atmosphere during a GDE
is a reasonable assumption (Conrath, 1975) that is supported by the shapes of many retrieved dust profiles at low to southern mid-latitudes during the 2018 GDE. Conversion to visible wavelengths can be achieved by multiplying the retrieved dust quantities by a factor of 7.3 based on the particle size distribution used in the retrieval (Kleinböhl et al., 2011). Larger particle sizes would lead to a decrease of this factor.
MCS was observing the Martian atmosphere nearly continuously over the duration of the GDE, measuring profiles of temperature, dust extinction, and water ice extinction during daytime and nighttime from the Sun-synchronous MRO orbit. The only interruptions occurred around Ls = 222◦due to a spacecraft safe
mode entry and between 16 October and 2 November 2018 (Ls= 270–280◦) due to the instrument being
turned off for spacecraft testing. MCS dust profiles are available on both the dayside and nightside parts of the orbit, allowing the study of diurnal variations of dust. For most limb measurements that view the direction of spacecraft travel, coincident on-planet views are available that are used together with limb mea-surements for profile retrievals of atmospheric temperature (McCleese et al., 2010). This extends the vertical range of the temperature retrievals during the 2018 GDE further into the lower atmosphere, compared to what has been available from limb-only retrievals during the 2007 GDE. In addition, the MCS observations included frequent sideways scans (cross track) to extend the range of local times observed during the event (Kleinböhl et al., 2013). MCS observed cross track both daytime and nighttime starting 31 May through 28 July (Ls= 185–220◦). MCS observed in-track only through 15 August (Ls= 221–231◦) after which it resumed
cross-track scanning during the sunlit part of the orbit. MCS returned to full cross-track scanning on 3 Octo-ber (Ls= 262◦). These cross-track measurements allow the study of dust variability on time scales less than
half a solar day.
3. MCS Observations of the MY34 GDE
3.1. Overview
The 2018 GDE originated in the northern hemisphere as a series of frontal dust storms. The dust storm moved to equatorial regions along the dust storm corridor in the Acidalia area. Initial dust signatures of the
Journal of Geophysical Research: Planets
10.1029/2019JE006115
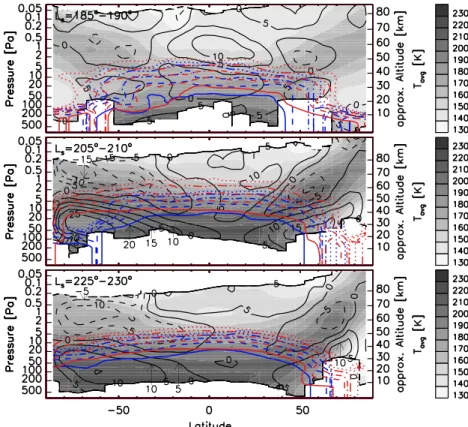
Figure 2. Temperature and dust extinction as observed by MCS during three periods of the MY34 global dust event.
Data have been zonally averaged in bins of 5◦latitude. Gray shades show the average temperature structure derived from daytime and nighttime measurements using(T3pm+T3am)∕2. Black contours show the day/night temperature difference defined as(T3pm−T3am)∕2in intervals of 5 K. Colored contours show isolines of dust extinction at 463 cm−1
for daytime (red) and nighttime (blue) measurements. Contour levels correspond to10−3km−1(solid),3 · 10−4km−1
(dashed),10−4km−1(dash dotted),3 · 10−5km−1(dash multidotted), and10−5km−1(dotted).
global event were observed on 2 June 2018 (Ls= 186◦), with temperature signatures at a pressure level of 50 Pa (∼25 km) being observed the following day (Kass et al., 2019). A significant vertical and latitudinal expansion is evident by 4 June 2018, with dust reaching altitudes greater than 55 km in the equatorial region and spreading out to latitudes between 50◦N and 50◦S at altitudes exceeding 40 km (Shirley et al., 2019). At this point the storm was still contained within the Acidalia corridor. Significant dust spreading in longitude was observed by 7 June 2018. By this time zonal mean daytime temperatures at 50 Pa also started to exceed the 200 K threshold, indicating at least a large-scale regional dust event. Based on MCS observations an early peak in dust column opacity with a visible optical depth of ∼5.7 was reached close to the Acidalia corridor in the Meridiani region on 8 June (Ls= 189.8◦) (Kass et al., 2019).
After the early growth phase a hiatus in dust expansion was observed that lasted for about a week, after which dust expansion accelerated again. The storm became planet encircling by 17 June 2018 (Ls= 194.9◦), which coincides with a peak in optical depth of 8.5 measured from the surface by the Curiosity rover (Guzewich et al., 2019). The GDE reached its mature phase around 23 June 2018 (Ls= 197.9◦) (Kass et al., 2019). The zonal mean peak in the dust column optical depth was observed on 28 June (Ls= 201◦) with a value of 6.8
(visible). At this time dust also reached its maximum altitudes above ∼80 km. Dust column optical depth in the Meridiani region peaked at values of about 9.6 on 1 July (Ls= 203.1◦). The zonal mean peak in
temper-ature was observed on 7 July (Ls= 207◦) (Kass et al., 2019). Dust activity then decayed over several months,
with background dust conditions reached in the second half of October 2018 (Ls = 270–280◦), during the
period when MCS was powered off for spacecraft tests.
Figure 2 provides an overview of the results from MCS temperature and dust profile measurements during the growth, mature, and decay phases of the 2018 GDE. Data are presented as zonal averages of temperature and dust profiles that were binned separately for day and night in latitude bins of 5◦on the same pressure
grid on which the individual profiles are reported. As the pressure-to-altitude conversion depends on tem-perature, the altitude scale provided on the right axes of the panels in Figure 2 is only approximate. Altitudes are provided with reference to the areoid. The top panel of Figure 2 shows data at the very beginning of the GDE (Ls= 185–190◦) (Shirley et al., 2019). The global temperature structure is still very seasonal, with
max-imum temperatures found in the lower atmosphere at equatorial latitudes. Temperatures at both poles are very low in the lower atmosphere and overlaid by warmer temperatures in the middle atmosphere. This is indicative of an equinoctial circulation, with nearly symmetric Hadley cells around the equator leading to dynamical warming in the high-latitude middle atmosphere of both hemispheres (McCleese et al., 2010). Temperature differences between day and night reveal a pattern that is typical for equinoctial conditions (Lee et al., 2009), with temperature deviations showing a nodal pattern consistent with a vertically propagating diurnal tide in the equatorial region, and the pattern changing at ∼30◦latitude in both hemispheres (Smith et al., 2017). Colored lines in Figure 2 show isolines of constant dust extinction for various dust extinction levels. While the dust is not very well mixed zonally in this phase of the storm (Shirley et al., 2019), certain patterns in the change of the dust profiles between day and night are already visible. At all latitudes, dust extends to higher altitudes during the day than at night. The extent of the difference varies with latitude. The center panel of Figure 2 provides the same analysis for the Lsrange of 205–210◦, during the mature phase of the GDE (Kass et al., 2019). Average atmospheric temperatures reach maximum values of 220–230 K in the lower atmosphere of the equatorial region and in the downwelling branch of the overturning atmo-spheric circulation in the northern high-latitude middle atmosphere. The temperature difference field in the center panel of Figure 2 shows that the tidal structure during the peak of the GDE has changed sig-nificantly compared to seasonal conditions. The temperature variation due to the migrating diurnal tide, which the temperature difference field is most sensitive to, is weakened in the tropics and strengthened in the extratropics. The strongest diurnal variations in the atmosphere are observed in the southern high lati-tudes, with amplitudes up to 29 K in the lower atmosphere. At northern mid-latitudes diurnal temperature variations with amplitudes around 15 K are observed. This behavior had been suggested by modeling stud-ies (Wilson & Richardson, 2000) and was also observed during the GDE of 2001 (Guzewich et al., 2014), which had a similar seasonal behavior as the GDE under study (Kass et al., 2019; Montabone et al., 2019). Modeling studies also suggest an increase of the amplitude of the semidiurnal tide at tropical latitudes with increasing dust loading due to solar heating becoming more vertically distributed over an extended part of the atmosphere (Wilson & Richardson, 2000). However, semidiurnal temperature variations are aliased in temperature average and difference fields such as Figure 2 and will not be a focus of this study.
In the northern high latitudes the polar vortex is well established, with temperatures close to the CO2frost
point and very low dust amounts. At virtually all other latitudes significant amounts of dust are found. Dust extinction at middle and low latitudes decreases with pressure. Throughout the middle atmosphere the same dust extinction is found at much lower pressures during the day than at night. The level of 10−5km−1dust
extinction is found around 2 Pa or higher (55- to 60-km altitude) at night, while during the day this level moves to about 1 Pa (65–70 km). We note that these altitudes correspond to zonal averages and that locally significant dust extinction has been observed at altitudes of at least 80 km during the peak phase of the GDE (Kass et al., 2019). Levels of constant dust extinction change between nighttime and daytime whether altitude or pressure is considered as vertical coordinate, suggesting that this change is not simply related to the expansion of the atmosphere due to heating by solar absorption on the dayside. In the southern polar region differences between day and night are even more striking than at middle and low latitudes. While daytime extinctions decrease only slowly toward the south pole, nighttime extinctions decrease significantly poleward of about 50◦S. At polar latitudes, the level of 10−5km−1dust extinction is found at 50 to 60 km
altitude during the day but only around 20 to 30 km altitude at night, corresponding to an altitude difference in the order of 30 km between day and night.
Data for the decay phase of the storm (Ls= 225–230◦) are provided in the bottom panel of Figure 2. The tidal
structure is similar to the one observed at Ls= 205–210◦, but the amplitudes have decreased. The tropical
diurnal tide is still very weak, while the extratropical diurnal tides now reach maximum amplitudes of ∼15 K in the southern high latitudes and of ∼10 K in the northern mid-latitudes. The north polar vortex is still well established. Dust is present at all other latitudes, with dust reaching the highest altitudes at northern low latitudes. A significant day/night difference in the altitudes or pressure levels reached by the dust is still noticeable, although its magnitude has decreased compared to the previous phase of the storm. In particular
Journal of Geophysical Research: Planets
10.1029/2019JE006115
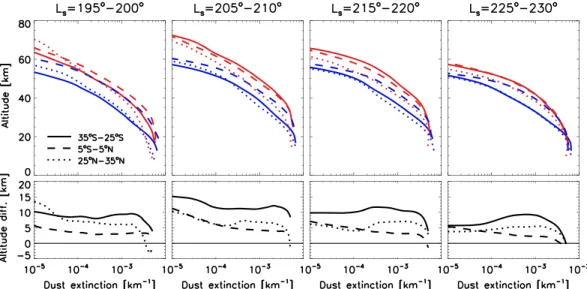
Figure 3. Zonally averaged dust extinction profiles as measured by MCS in various latitude bands at middle and low
latitudes during four periods of the global dust event at 3 p.m. (top, red) and 3 a.m. (top, blue). The bottom panels show the differences in altitude between the daytime and nighttime zonal averages.
in the southern high latitudes the differences between day and night, while still larger than at middle and low latitudes, are not nearly as large as previously.
3.2. Observations of Diurnal Variations of Dust at Middle and Low Latitudes
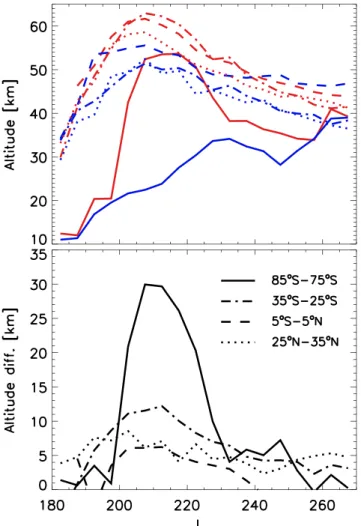
Figure 3 provides a more quantitative look at the diurnal differences in the dust profiles at middle and low latitudes. Profiles are reported on an altitude scale relative to the areoid representative for the latitude bin. Although the intrinsic vertical resolution of the MCS measurement is ∼5 km, the oversampling of the vertical grid used by the retrieval allows the visualization of altitude differences smaller than the intrinsic resolu-tion. During all phases of the dust storm the differences between day and night seem to be more pronounced in the mid-latitudes than at the equator. During the growth and early mature phase of the storm (left panels of Figure 3) the differences in the altitude for an isoline of dust extinction between day and night is about 4 km at the equator. At latitudes around 30◦N the altitude difference between isolines of dust extinction is about 8 km, with slightly higher day/night differences at lower altitudes in southern mid-latitudes. This over-all pattern largely continues throughout the mature and decay phases of the storm although the southern mid-latitudes experience larger differences than the northern mid-latitudes starting with the mature phase. Around 30◦S the same dust amounts are found about 12 km higher on the dayside than on the nightside in the mature and early decay phases of the storm. Later in the decay phase (Ls= 225–230◦) equal amounts of dust are found up to 10 km higher on the dayside for dust levels above 10−4km−1, with the difference
decreasing to about 7 km below. Altitude differences in dust extinction are similar in structure around 30◦N but somewhat lower in magnitude. During the mature and early decay phase of the storm the altitude dif-ferences are of order 7 km, decreasing to about 5 km later during the decay of the storm. In the equatorial region altitude differences in dust extinction are around 5 km during the mature and early decay phases of the storm, decreasing to 2–3 km later in the decay phase. At low latitudes altitude differences tend to be somewhat larger at higher altitude.
The latitudinal behavior of these day/night differences is outlined in more detail in Figure 4 using the 10−4
km−1dust extinction level as an example. During the mature phase of the storm (L
s= 205–210◦) the altitudes
at which this dust level is found exceed 60 km in dayside measurements between about 60◦S and 30◦N. In the early decay phase (Ls= 215–220◦) daytime dust does not reach quite as high in the northern hemisphere,
and the dust extinctions level of 10−4km−1only exceeds 60 km around 40◦S. In nightside measurements the
maximum altitude of the dust extinction level is found in the equatorial region, although during the growth and mature phases of the storm the dust distribution seems to be skewed toward the northern low latitudes, possibly indicating increased dust activity in these regions. Interestingly, the lowest variations of the dust extinction between day and night are found in the equatorial region, with the variability of the 10−4km−1
Figure 4. Altitude of10−4km−1zonally averaged dust extinction during four periods of the global dust event at 3 p.m.
(top, red) and 3 a.m. (top, blue). The bottom panel shows the altitude difference between daytime and nighttime.
the largest differences found in the early phase of the storm. In the southern hemisphere the largest differ-ences tend to occur during the mature and early decay phases. Differdiffer-ences increase steadily between the equator and about 40◦S, where they reach about 12 km between day and night. Further poleward, altitude differences increase rapidly, peaking at 37 km at 65–70◦S during the mature phase of the storm. The latitu-dinal dependence of the altitude differences provides a first clue at the processes that control this behavior. The subsolar point is always located at low southern latitudes during the time period considered in Figure 4. It wanders from 6◦S at Ls= 195◦to about 18◦S at Ls= 230◦. The largest differences tend to be north and
south of this range, suggesting that a simple dependence on solar heating (e.g., as expected in “rocket dust storms”, Spiga et al., 2013) is not sufficient to explain the behavior, and that more complicated dynamical processes must be at work.
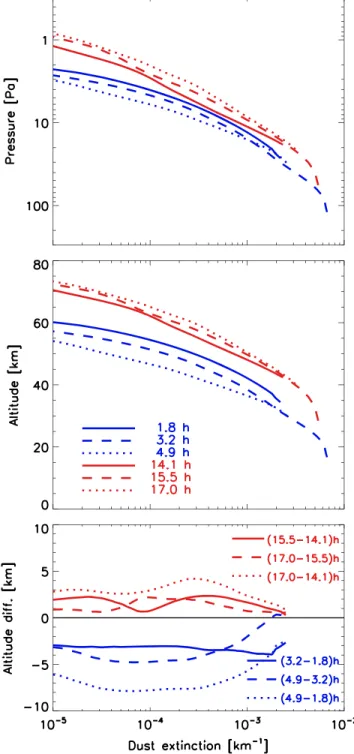
In order to investigate the behavior on a time scale of less than half a sol, we consider cross-track measure-ments by MCS that were performed frequently during the MY34 GDE. During cross-track measuremeasure-ments, MCS slews in azimuth to view the limb perpendicular to the orbit track. This provides profile measurements at about 1.5 hr earlier and later in local time at middle and low latitudes, and at somewhat larger local time offsets at higher latitudes, compared with the standard in-track measurements, which occur roughly at the local times of the MRO orbit track (Kleinböhl et al., 2013). Figure 5 shows the results of such an analysis for the latitude range between 25◦S and 35◦S at Ls= 205–210◦. In this latitude band substantial differences
between daytime and nighttime dust profiles are observed and good coverage with cross-track observations is achieved so that an analysis of local time differences based on these measurements is most conclusive. It is noticeable that dust profiles move up or down with local time whether altitude or pressure is considered as vertical coordinate, reiterating that the movement is not only related to the expansion of the atmosphere
Journal of Geophysical Research: Planets
10.1029/2019JE006115
Figure 5. Zonally averaged dust extinction profiles as measured by MCS between 25◦S and 35◦S at Ls= 205-210◦at
various local times plotted versus pressure (top) and versus altitude (center). The bottom panel shows the differences in altitude between various measurements for pairs of local times at daytime (red) and nighttime (blue).
due solar heating at daytime. On the dayside the dust reaches the highest altitudes or lowest pressures at the latest local time sampled, around 17 hr. The lowest dayside altitudes are exhibited by the earliest profile around 14.1 hr local time. The in-track profile at 15.5 hr local time is found in between. Changes in altitude are around 2 km between 14.1 and 15.5 hr as well as between 15.5 and 17 hr, leading to a total altitude dif-ference of about 4 km between the early and the late afternoon. On the nightside the lowest-altitude dust profile is the one with the latest local time at around 4.9 hr. Earlier dust profiles are found at higher alti-tudes, with 3 km altitude decrease from 1.8 to 3.2 hr and 4 to 5 km altitude decrease from 3.2 to 4.9 hr local
Figure 6. Seasonal evolution of the altitude of10−4km−1zonally averaged dust extinction for four latitude bands
during the global dust event at daytime (top, red) and nighttime (top, blue). The bottom panel shows the altitude difference between daytime and nighttime.
time. The final profile at 4.9 hr is located about 7–8 km lower in the atmosphere than the profile around 1.8 hr local time.
Figure 6 illustrates the seasonal development of the altitudes of the 10−4km−1dust extinction level and
the differences between daytime and nighttime. Maximum daytime altitudes of over 60 km are reached around Ls= 200–220◦in equatorial and southern extratropical latitudes. However, the day/night differences
in altitude are much smaller in the equatorial region than at midlatitudes throughout the duration of the dust storm. The onset and increase in the day/night difference at the beginning of the storm is comparable in both northern and southern mid-latitudes. During the mature and early decay phases of the storm, diurnal variations are somewhat larger around 30◦S (10–12 km) than around 30◦N (6–8 km). This behavior reverses around Ls= 250◦, after which the diurnal variations in northern mid-latitudes are larger than at southern mid-latitudes. By Ls= 260◦this difference has grown significantly, reaching about 5 km around 30◦N in comparison to 3 km around 30◦S.
3.3. Observations of Diurnal Variations of Dust at Southern High Latitudes
As discussed in the overview section, dust extinctions in southern high latitudes reveal significant differ-ences between day and night during the dust storm (Figure 2). Figure 6 shows this development over the duration of the storm in more detail. Before the storm dust levels were low in the decaying south polar vortex and no variability between day and night was discernible. With the onset of the storm dust in the southern polar region increases and day/night differences in the altitude at which the 10−4km−1extinction level is
Journal of Geophysical Research: Planets
10.1029/2019JE006115
Figure 7. Temperature, dust, and water extinction as observed by MCS in the southern polar region during the MY34 global dust event. The left part of each
panel shows measurements from the nightside part of the orbit, while the right part of each panel shows measurements form the dayside part of the orbit. Data have been zonally averaged in bins of 5◦latitude. Gray shades show the temperature structure. Red contours show isolines of dust extinction at 463 cm−1, while
blue contours show isolines of water ice extinction at 843 cm−1. Contour levels correspond to10−3km−1(solid),10−4km−1(dashed), and10−5km−1(dotted).
altitude on the nightside only rises moderately. This leads to a strong increase in the day/night difference of the altitude of this dust extinction level, which peaks around Ls= 210◦with an altitude difference of over 30 km (see also Figure 4). After this peak the altitude difference decreases quite rapidly again, however, a significant difference is observed during most of the dust storm period. The day/night differences in the alti-tude of this dust extinction level only vanish shortly before Ls= 260◦. We note that the altitudes of the 10−4
km−1dust extinction both on the dayside and the nightside part of the orbit increase until after L s= 260◦.
This is coincident with the onset of the “B” dust event, an annually recurring set of regional storms close to the edge of the southern polar cap (Kass et al., 2016).
Figure 7 shows zonal averages of temperature, dust extinction, and water ice extinction across the south polar region at various periods of Lsduring the GDE. Averages are separate for the dayside and nightside
parts of the MRO orbit, with the nightside data shown on the left-hand side and the dayside data shown on the right-hand side of each panel The panel covering Ls= 185–190◦shows a largely unperturbed southern
polar region typical for the season. The polar vortex is centered at the south pole with temperatures below 150 K. The structure of the polar warming due to the descending branch of the Hadley cell in the middle atmosphere is nearly symmetric around the pole. Coincident with the cold pole of the polar vortex is a nearly
Figure 8. Zonally averaged dust extinction profiles as measured by MCS in various latitude bands at southern high latitudes during four periods of the global
dust event in the daytime (top, red) and nighttime (top, blue) parts of the MRO orbit. The bottom panels show the differences in altitude between the daytime and nighttime zonal averages.
dust-free zone, in which dust extinctions are below 10−5km−1. Water ice is widespread in the southern polar
region and extends to mid-latitudes predominantly on the nightside.
With the onset of the global dust storm, this picture has already changed significantly only 10◦of Lslater.
Dust reaches higher altitudes in the dayside mid-latitudes and extends further into the polar region than on the nightside. The cold pole has warmed by about 10 K and has moved off the geographic pole. It is now centered around 80◦S on the nightside. There are still significant amounts of ice found in the south polar region but they are now largely co-located with the temperature minima on the nightside. Another 10◦of Ls later dust on the dayside has pushed further into the polar region and exhibits now a steep decrease near the south pole while being nearly flat north of 80◦S. The cold pole has moved nearly entirely onto the nightside. Water ice in the lower atmosphere is now exclusively found on the nightside, co-located with the coldest temperatures.
By Ls = 215–220◦the cold pole has warmed sufficiently to sublimate all the water ice that was present 10◦of Lsearlier. However, temperatures are still significantly lower than in its surroundings, and there is still a minimum in dust associated with the temperature minimum that stretches from the south pole to about 60◦S on the nightside. This strongly suggests that the nightside dust minimum observed in the polar region since the beginning of the storm is neither caused by scavenging of dust particles by water ice nor by a misrepresentation of dust as ice due to uncertainties it the aerosol spectroscopic parameters, but is of a dynamical nature. The observed temperature and aerosol pattern implies that with the onset of the dust storm the polar vortex is pushed off the south pole toward the nightside of the planet but stays largely intact over several tens of degrees of Lswhile slowly warming. This dynamical pattern maintains a dust minimum
in the southern polar region on the nightside of the planet. The right column of panels of Figure 7 shows the slow dissipation of this pattern. Between Ls= 225◦and Ls= 250◦a temperature minimum and a co-located dust minimum are clearly discernible off the south pole on the nightside part of the planet. It takes until
Ls= 255–260◦until this pattern has completely dissipated and the dust distribution is essentially flat across
the south polar region.
Figure 8 shows altitude profiles of the zonally averaged dust extinctions from Figure 7 at selected latitudes and the day/night altitude differences between them. At Ls= 195–200◦shortly after the onset of the storm the vortex is offset to the nightside but the highest latitudes still correspond to vortex air both on the dayside and the nightside where dust barely rises above 20 km altitude and exhibits hardly any differences between day and night. At lower latitudes (65◦S to 45◦S) significant differences in the order of 20 km in the altitude reached by the dust on the dayside compared to the nightside are found. By Ls= 205–210◦the vortex is
Journal of Geophysical Research: Planets
10.1029/2019JE006115
Figure 9. Zonal averages of temperature (left) and dust opacity (right) at several Lsintervals in the southern polar
region, mapped vs. latitude and local time at a pressure level of 18 Pa (∼30 km altitude at the beginning,∼37 km altitude during the peak of the storm). Local midnight is located at the top and local noon on the bottom of each map. Dust extinctions below10−5km−1are marked with black open circles.
and nightside up to about 15 km altitude, and only start deviating above. The nighttime profile is still compa-rable to the high-latitude profiles 10◦of Lsearlier. The lower part of the daytime profile also shows the dust
corresponding to the high-latitude air mass but the upper part corresponds more to the dust distribution found at dayside lower latitudes, with the same dust levels found 30 km higher than on the nightside. This is corroborating evidence pointing to the day/night asymmetry being a dynamical event, where the dusty air mass from the dayside pushes the polar air toward the nightside at higher altitudes. In these conditions dust acts as a tracer that points to the origin of an air mass, at least at timescales shorter than the sedimentation time. The cold polar air mass observed here has the characteristics of a remnant of the polar vortex that stays physically intact and circulates around the pole every sol, creating a Wave 1 pattern that is tied to a fixed local time. At Ls= 215–220◦the overall dust distribution is still similar to the one 10◦of Lsearlier, although
some differences in the high-latitude dust profiles are now found also at low altitudes. Day/night altitude differences at corresponding dust levels still reach 30 km at 80–75◦S and 25 km at 65–60◦S. Around 45◦S the day/night difference largely resembles the pattern at lower latitudes, with altitude differences of 10–15 km. By Ls= 225–230◦the dust distributions at the various latitudes look much more similar. While dust still
reaches higher altitudes at lower latitudes the overall altitude difference between daytime and nighttime dust profiles is fairly consistent and in the order of 10 km.
In order to further constrain the local time of the observed southern polar temperature and dust mini-mum, we turn to MCS measurements performed in cross-track and off-track geometries. At high latitudes this enables measurements that are offset by several hours from the nominal local time of the MRO orbit (Kleinböhl et al., 2013). Figure 9 shows zonal averages of temperature and dust opacity for several inter-vals of Lsat a pressure level of 18 Pa. This level was selected because it cuts through the temperature and dust minima shown in Figure 7, while being high enough in the atmosphere to provide good coverage with cross-track and off-track profiles, which often do not reach as low into the atmosphere as standard in-track profiles. The latitudinal dimension in the individual maps in Figure 9 corresponds to the actual latitudes of the zonal averages, while the longitudinal dimension corresponds to the average local time in the mea-surement bin. Tracks that extend diagonally from ∼3 a.m. to ∼3 p.m. across the maps correspond to in-track measurements. Tracks that reach ∼1 or ∼5 hr local time at the edge of each map correspond to cross-track measurements where MCS views the limb perpendicular to the orbit track. Tracks in between are off-track measurements, where the instrument is pointed at an azimuth angle that is not parallel or perpendicular to the orbit track.
At the onset of the storm, at Ls= 185–190◦, minima in temperature and dust are fairly centered around the
south pole. This changes rapidly at Ls= 190–195◦, when temperatures at mid-latitudes increase and the polar
temperature and dust minima are shifted toward the nightside. Temperatures below 170 K are found on the nightside between the pole and about 60◦S in the in-track measurements and the cross-track measurements at 5–6 hr local time. They are correlated with dust values around or below 10−5km−1. The cross-track
mea-surements at 0–1 hr show higher temperatures and dust extinctions than the two other tracks. This behavior intensifies during the peak period of the storm (Ls= 205–220◦). Temperatures above 215 K on the dayside
reach all the way to the south pole. Lower temperatures are found on the nightside in the 3 a.m. track and at 5–6 hr local time. Temperatures around 0–1 hr are above 207 K and closer to the daytime temperatures than the temperatures of the other nighttime tracks. The dust exhibits a similar pattern. While there are still measurements with extinctions below 10−5km−1, they are now all found on the nightside in the 3 a.m. track.
Low dust amounts are also found at 5–6 hr local time, in particular poleward of 60◦S. In stark contrast, dust extictions at 0–1 hr local time exceed 5 · 10−4km−1and are closer to typical dayside values. This suggests that
the temperature and dust minima on the nightside are not centered around midnight but shifted toward 3–6 a.m. local time. Even during the decay phase of the storm (Ls= 235–240◦), although the differences
in temperature and dust are diminishing, the pattern still persists. Only around Ls= 255–260◦the pattern
essentially disappears and gives way to a rather homogeneous temperature field and dust distribution across the high southern latitudes.
4. Comparisons With Climate Model Simulations
In order to interpret the observations by MCS, we use simulations performed with the Laboratoire de Météorologie Dynamique [LMD] Global Climate Model [GCM] (Forget et al., 1999) using the semi-interactive dust transport scheme described in Madeleine et al. (2011) and the water ice cloud schemes of Madeleine et al. (2012) and Navarro et al. (2014) for cloud radiative effects and scavenging, respectively.
Journal of Geophysical Research: Planets
10.1029/2019JE006115
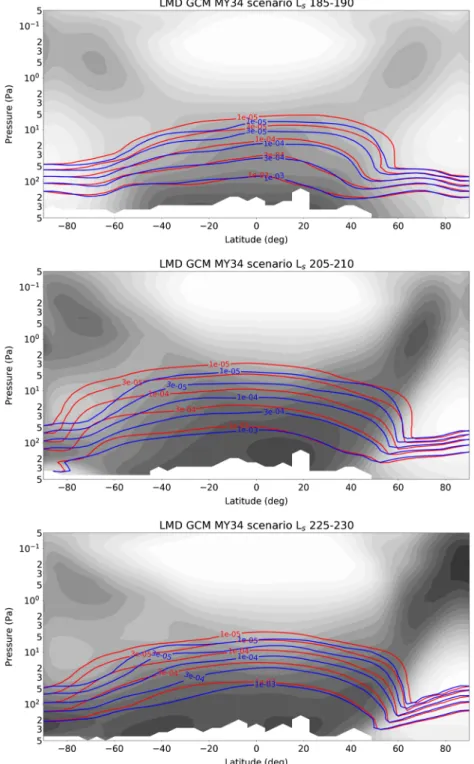
Figure 10. Temperature and dust extinction as simulated by the LMD GCM during three periods of the MY34 global
dust event. Both the quantities shown and the graphical standards follow Figure 2 for comparison. To mimic the procedure followed for the MCS data, all LMD GCM fields are remapped to the same local times globally (3 a.m. and 3 p.m.) before zonal averaging is performed.
These simulations are identical to those also discussed in Montabone et al. (2019). The parameterization for dusty deep convection (“rocket dust storms”, Spiga et al., 2013) described in Wang et al. (2018) is not activated in the version of the model used here.
The semi-interactive dust transport scheme works as follows. In the LMD GCM simulations, we use the dust climatology v2.5 described in Montabone et al. (2019) built for Martian Year 34 by aggregating MCS observations and using a kriging technique. The value of total column dust opacity is updated in the model
Figure 11. Dust mass mixing ratio simulated in the LMD GCM with (left) and without (right) the normalization by the MCS-observed dust column opacity.
Both cases start with the same dust field at Ls= 210◦.
each sol—the employed climatology is thus devoid of any prescribed diurnal cycle of column opacity. In the LMD GCM, the interactive transport of dust particles is carried out by the resolved dynamics; it is based on a two-moment scheme comprising mass mixing ratio and dust number density, assuming a lognormal distribution for particle sizes (Madeleine et al., 2011). Since only the total column dust opacity is normalized at each time step by the value prescribed from the MY34 dust scenario based on MCS, the vertical distribution of dust particles in the LMD GCM simulation is a prediction from the model that is independent of the MCS observations.
Figure 10 shows the LMD GCM predictions of the MCS diagnostics shown in Figure 2. Both the diurnal contrast in the dust distribution with altitude and the variability thereof are reproduced in the LMD GCM simulation. In the beginning of the MY34 GDE (Ls= 185–190◦), there is a tendency for the vertical dust distribution at middle and low latitudes to be higher in the daytime than in the nighttime. In the mature phase of the MY34 GDE (Ls= 205–210◦), this tendency is also present although the diurnal changes in the MCS measurements are more pronounced than in the model results. The most remarkable difference with the early phase of the storm is the reinforcement of the diurnal differences in the southern high latitudes. There, the LMD GCM reproduces well the diurnal contrasts observed by MCS, showing a vertical distribu-tion of dust that is more than a scale height higher in the daytime than in the nighttime. This spectacular contrast is not seen anymore in the decaying phase of the MY34 GDE (Ls= 225–230◦), although the global
diurnal cycle of vertical dust distribution seen from the beginning of the event still prevails in the decaying phase. We also note that the diurnal contrasts of temperature in all regions of Mars and all phases of the MY34 GDE are similar in the GCM and in the MCS observations. This is also true for the strongest diurnal variations observed in the southern high latitudes, with amplitudes exceeding 25 K in the lower atmosphere, and associated with the enhanced extratropical diurnal tide.
Since the dust column optical depth is updated only once every sol, the prescription of the column dust from the observed value is not supposed to create a diurnal cycle of the dust distribution in the LMD GCM. In order to corroborate this, we restarted a LMD GCM simulation at Ls= 210◦(during the mature phase of the GDE)
with this normalization being switched off (in the following called freedust run because the evolution of the dust mixing ratio is fully predicted by the model without any link to the MCS observations). We consider this simulation reliable only for the first 5◦of Ls—at longer timescales the column opacity starts to depart
too much from the observed climatology. Figure 11 shows that either simulation setting—that is, the MY34 dust scenario or the freedust run—yields a similar vertical and meridional distribution of dust particles, with the diurnal contrast being clear in equatorial latitudes and particularly prominent in the southern polar regions. This strengthens the confidence that the diurnal variability in dust distribution observed by MCS is reproduced by the LMD GCM for valid, physical reasons.
We note that the freedust run has also been used by Montabone et al. (2019) to investigate how the observed diurnal variations in the dust profile relate to variations in column dust opacities. The freedust run produces significant diurnal variations in the column dust opacity, which is particularly apparent in the southern high latitudes. This suggests that these variations, which are at least partially driven by horizontal transport due to diurnal changes in the large-scale circulation, also have a significant impact on the dust column (Section 4 of Montabone et al., 2019).
Journal of Geophysical Research: Planets
10.1029/2019JE006115
Figure 12. Dust extinction profiles modeled by the LMD GCM with MY34 dust scenario between 30◦W and 30◦E longitude and between 25◦S and 35◦S latitude at Ls=210◦for distinct local times spanning a full day.
The results from the LMD GCM can be used to complement the MCS diagnostics about the diurnal vari-ability in the dust distribution obtained by cross-track viewing geometries (Figure 5). Figure 12 shows the diurnal variation of the modeled dust profile at low southern latitudes in intervals of 3 hr local time. The results are given for a longitude interval around the prime meridian, but the same overall behavior is also observed at other longitudes. While the dust in the model does not quite reach the same low pressures as observed in the data, the model results largely reproduce the diurnal variation observed by MCS, showing a minimum altitude for the top of the dust layer in the late night (the GCM indicates this minimum occurs around 6 a.m.) and a maximum altitude for the top of the dust layer in late afternoon (in the model close to 6 p.m.). As a complement to the MCS profiles that are only acquired at 3 a.m./p.m. ±1.5 hrs, the model shows that the profiles at noon and midnight are almost identical. An instrument on board an orbiting spacecraft operating at those two local times would not see any diurnal contrast in dust distribution. The local times at which MCS operates, albeit not fully optimal, are appropriate to capture the diurnal variability of the dust distribution.
The good reproduction by the LMD GCM of the diurnal contrasts in dust vertical distribution observed by MCS allows us to use the model as a basis for understanding the cause of this variability. We first investigate its drivers based on the mean meridional circulation that is primarily defined in a zonally and diurnally averaged sense. The top panel of Figure 13 shows the zonal mean mass stream functions in the mature phase of the MY34 GDE (Ls= 210◦). They exhibit a two-cell structure with and a common ascending branch around 30◦S and descending branches centered at 40◦N and 60◦S that is comparable with published GCM results during the equinoctial GDE of Martian Year 25 (Montabone et al., 2005, their Figure 7). The intensity of this mean meridional circulation and its vertical extent are stronger during the MY34 GDE than before the onset of the event (Montabone et al., 2019) or at the same season in Martian Years devoid of GDEs. The diurnally averaged point of view does not reveal, however, the diurnal complexity that leads to this zonal mean pattern. In the other panels of Figure 13 the diurnal variations of the meridional circulation are computed by recasting the GCM predictions to globally constant local times in intervals of 3 hr. We note that this corresponds to idealized circulations in the sense that they do not occur globally at any given time on the planet. However, they illustrate variations in the meridional circulation with local time while averaging out longitudinal influences, for example, due to topography. The LMD GCM predicts that during the day (∼9 a.m. to 3 p.m.) the meridional circulation has a rising branch located over the equator, with two upper branches around 10 Pa directed toward the polar latitudes where descending branches are located. This causes net upward transport of dust particles at the equator and poleward transport between 10 and 100 Pa. It provides a plausible explanation for the daytime dust to be located at higher altitudes in the atmosphere
Figure 13. (top) Zonally averaged mass stream functions at Ls= 210◦, calculated for output from LMD GCM
integrations on a diurnally averaged basis. (other panels) Zonally averaged mass stream functions at the same Lsfrom LMD GCM output, recast to be at the same local times over the whole planet (local times 3, 6, 9, 12, 15, 18, 21, and 24 hr are included). Blue regions showing negative values for stream functions correspond to counterclockwise movement. Red regions showing positive values correspond to clockwise movement. Note that the top plot (diurnal average) has a different color coding than the other plots. In the top plot, contour lines are 109kg/s apart while in the
Journal of Geophysical Research: Planets
10.1029/2019JE006115
and to extend farther poleward (cf. to Figure 2 center) than its nighttime counterpart. Conversely, the situa-tion during the night (∼9 p.m. to 3 a.m.) is reversed with the descending branch of the meridional circulasitua-tion being located close to the equator and the circulation cell in the southern hemisphere showing clockwise movement and being much stronger than in the northern hemisphere. Figure 13 also shows that around 6 a.m. and 6 p.m. the meridional circulation weakens as one circulation pattern transitions to the other. No other substantial transitions are evident in the time series, suggesting that the meridional circulation exhibits a diurnal tide. We note that this nighttime diagnostic might seem at odds with the southern meso-spheric polar warming evidenced in both the observations and the model; yet the diurnal average shown in Figure 13 (top) is in agreement with this well-known polar warming signature. This suggests that the vari-ability in the meridional transport due to the diurnal tide accounts for a large part of the diurnal varivari-ability seen in the vertical distribution of dust by MCS.While the LMD GCM qualitatively reproduces the diurnal variations of dust observed by MCS, we note that the magnitude of the altitude change in the dust profiles is smaller than in the observations. We speculate that, in addition to the role the diurnal variation of the mean meridional circulation plays in producing this effect, vertical transport exerted by dusty deep convection (rocket dust storms, Spiga et al., 2013) may con-tribute to this effect. Such transport can significantly alter the vertical distribution of dust, as evidenced by Wang et al. (2018), by combining the LMD GCM with a parameterization of the injection of dust particles by rocket dust storms. The modeling work presented here indicates that to first order the diurnal variability of the vertical distribution of dust observed by MCS is well reproduced by a GCM not including a param-eterization for dusty deep convection. The latter is expected to be more important in regions that may be more prone to vertical transport due to dusty deep convection, such as the Tharsis volcanoes (Rafkin, 2002; Heavens et al., 2015).
The analysis of MCS observations developed in section 3.3 points toward a dynamical origin for the night-side dust minimum observed in the polar region, rather than the scavenging of dust particles by water ice clouds or a spectroscopic bias in the data analysis. The dynamics resolved by the LMD GCM supports this interpretation. A useful method to assess the meteorological evolution of the southern polar regions during the MY34 GDE is to map potential vorticity (PV) on isentropic surfaces (i.e., equal potential temperature), which under favorable, nondissipative conditions, acts as a material tracer for the atmospheric flow. Figure 14 shows that a persistent air mass of high (negative) PV depleted in dust is consistently found on the nightside of the planet, revolving around the pole with the diurnal cycle. The compact area of high PV and its correlation with the low dust region are indicative of a coherent, isolated air mass that is not mixing with the surrounding atmosphere. Through its evolution, this is clearly the displaced remnant of the southern winter polar vortex. This interpretation is also supported by the lack of a reservoir of nondusty air that could be transported to create the low dust region. All horizontally adjacent regions are dustier and thus not the source of the low dust atmosphere. While there is relatively dust-free air above the vortex remnant, Figure 13 indicates that there is primarily upward transport in the region at night. The high-PV air mass evidenced in Figure 14 lasts between 30 and 40 sols, before seasonal changes in the southern hemisphere disturb this behavior. This suggests that PV is a largely conserved quantity that acts like a material tracer over significant time spans in the polar region.
The wind fields shown in Figure 14 illustrate that the motions of the atmospheric fluid are largely parallel to the PV contours. Winds tend to be weak within the vortex region, especially toward the northern edge of the remnant. The strongest winds are found on the dayside near the edge of the vortex remnant. Wind speeds can be as high as 150 m/s. There is a strong southward meridional flow east of the low dust region in Figure 14 (corresponding to local times later than 6 a.m.) and a strong northward meridional flow west of the low dust region (corresponding to local times earlier than 6 a.m.). The fixed local time of ∼6 a.m., at which the vortex feature is found, is controlled by the phasing of this wind field, which exhibits the structure of a diurnal tide. This is also consistent with the diurnal variations of the meridional circulation shown in Figure 13, where southern middle and high latitudes experience poleward motions in the daytime and equatorward motions in the nighttime at pressure levels of 10–100 Pa.
The diurnal tide transports dust particles meridionally and around the high-PV area in the south polar region, which subsequently remains depleted of dust. The tide induces a Wavenumber 1 disturbance that revolves around the pole with the diurnal cycle, which is consistent with the MCS observations presented in section 3.3, in that the observed air mass is a remnant of the polar vortex, the center of which is no longer
Figure 14. (left) Shaded contours show Ertel's potential vorticity projected on a 520 K isentrope (equal potential temperature surface) in a stereographic
projection. This corresponds roughly to pressure levels of 10 to 20 Pa in the polar regions. Contour lines show the base-10 logarithm of dust mass mixing ratio (kg/kg) projected on the 520 K isentrope. Latitude intervals are 5◦. (right) The same dust mass mixing ratio (kg/kg) is shown with shaded contours on a cylindrical projection for the southern hemisphere. Horizontal wind vectors projected on the same isentrope are superimposed. The local times given for each panel from top to bottom are 00, 06, 12, and 18 hr and correspond to the local times at longitude 0◦. The considered Lsis 210◦(mature phase of the MY34 GDE).
Journal of Geophysical Research: Planets
10.1029/2019JE006115
located at the south pole but displaced toward the north, following the nightside of the planet during the mature phase of the MY34 GDE. The local time at which this effect is the strongest is around 6 a.m., which is also consistent with the MCS diagnostics shown in Figure 9. Structures of this kind have been observed in atmospheric chemical tracers on Earth during polar stratospheric warmings, where the winter polar vortex is pushed off the pole and distorted in Wave 1 and Wave 2 events (Kleinböhl et al., 2005; Manney et al., 1994). However, the disturbance due to the diurnal tide enhanced by the dust activity observed here is more vigorous than disturbances of polar air masses typically observed in Earth's stratosphere.5. Conclusions
MCS observed distinctive diurnal variations in temperature and the vertical distribution of dust during the Mars Year 34 GDE. The temperature field shows weak diurnal tidal activity at equatorial latitudes but a strong diurnal tide in middle to high latitudes. Variations in the top altitude of the dust are observed through-out the middle and low latitudes and are particularly strong at the sthrough-outhern high latitudes. The observed variations are well represented by model simulations with the LMD GCM.
At middle and low latitudes the observations indicate that on the dayside comparable dust amounts are found about 5–10 km higher in the atmosphere than on the nightside. The maximum altitude difference occurs during the peak phase of the GDE and decreases during the decay phase. The diurnal variations in the dust are largely driven by the meridional circulation exhibiting diurnal tidal variations.
The southern high latitudes are characterized by a strong diurnal tide in the temperature field with an ampli-tude of up to 29 K and variations in the vertical distribution of dust of ∼30 km. This pattern is caused by a dynamical effect, in which a compact remnant of the southern polar vortex, characterized by low temper-atures and low dust amounts, is pushed across the pole toward the nightside of the planet. This remnant stays compact for most of the duration of the GDE and only dissipates completely in the late decay phase of the storm. The core of the vortex remnant is not centered around midnight but toward 3–6 a.m. local time. The air mass remains physically intact and circulates around the pole every sol at its fixed local time. This effect is related to the strong diurnal tide in the south polar lower atmosphere that was also observed during the Mars Year 25 GDE (Guzewich et al., 2014).
The conclusions drawn in this study about the diurnal variability of the distribution of dust particles in the Martian atmosphere calls for a more systematic exploration of the complete diurnal cycle of temperature, winds, and tracer species by a future generation of orbiting spacecraft around Mars.
References
Cantor, B. A. (2007). MOC observations of the 2001 Mars planet-encircling dust storm. Icarus, 186, 60–96.
Clancy, R. T., Wolff, M. J., Whitney, B. A., Cantor, B. A., Smith, M. D., & McConnochie, T. H. (2010). Extension of atmospheric dust loading to high altitudes during the 2001 Mars dust storm: MGS TES limb observations. Icarus, 207, 98–109.
Conrath, B. J. (1975). Thermal structure of the Martian atmosphere during the dissipation of the dust storm of 1971. Icarus, 24, 36–46. Forget, F., Hourdin, F., Fournier, R., Hourdin, C., Talagrand, O., Collins, M., et al. (1999). Improved general circulation models of the
Martian atmosphere from the surface to above 80 km. Journal of Geophysical Research, 104, 24,155–24,175.
Guzewich, S. D., Lemmon, M., Smith, C. L., Martinez, G., de Vicente-Retortillo, A., Newman, C. E., et al. (2019). Mars Science Laboratory observations of the 2018/Mars Year 34 Global Dust Storm. Geophysical Research Letters, 46, 71–79.
Guzewich, S. D., Wilson, R. J., McConnochie, T. H., Toigo, A. D., Banfield, D. J., & Smith, M. D. (2014). Thermal tides during the 2001 Martian global-scale dust storm. Journal of Geophysical Research, 119, 506–519. https://doi.org/10.1002/jgre.20076
Heavens, N. G., Cantor, B. A., Hayne, P. O., Kass, D. M., Kleinböhl, A., McCleese, D. J., et al. (2015). Extreme detached dust layers near Martian volcanoes: Evidence for dust transport by mesoscale circulations forced by high topography. Geophysical Research Letters, 42, 3730–3738.
Kahre, M. A., Murphy, J. R., Newman, C. E., Wilson, R. J., Cantor, B. A., Lemmon, M. T., & Wolff, M. J. (2017). The Mars dust cycle. In R. M. Haberle, R. T. Clancy, F. Forget, M. D. Smith, & R. W. Zurek (Eds.), The atmosphere and climate of Mars. Cambridge, MA: Cambridge Univ. Press.
Kass, D. M., Kleinböhl, A., McCleese, D. J., Schofield, J. T., & Smith, M. D. (2016). Interannual similarity in the Martian atmosphere during the dust storm season. Geophysical Research Letters, 43, 6111–6118.
Kass, D. M., Schofield, J. T., Kleinböhl, A., McCleese, D. J., Heavens, N. G., Shirley, J. H., & Steele, L. J. (2019). Mars Climate Sounder observation of Mars' 2018 global dust storm. Geophysical Research Letters. https://doi.org/10.1029/2019GL083931
Kleinböhl, A., Chen, L., & Schofield, J. T. (2017). Far infrared spectroscopic parameters of Mars atmospheric aerosols and their application to MCS retrievals in high aerosol conditions. In Sixth International Workshop on the Atmosphere of Mars. Granada, Spain.
Kleinböhl, A., Friedson, A. J., & Schofield, J. T. (2017). Two-dimensional radiative transfer for the retrieval of limb emission measurements in the Martian atmosphere. Journal of Quantitative Spectroscopy and Radiation Transfer, 187, 511–522.
Kleinböhl, A., Kass, D. M., Schofield, J. T., & McCleese, D. J. (2014). Temperature and dust profiles during the Martian planet-encircling dust storm in 2007 from Mars Climate Sounder measurements. In Eighth International Conference on Mars, 1144. Pasadena, CA.
Acknowledgments
We are grateful to Shigeru Suzuki, Jason Matthews, and Tina Tillmans for their tremendous support in operating the MCS instrument and processing the MCS data. We thank the MRO operations team for keeping the MRO spacecraft healthy and enabling its science operations. Data underlying key figures of this article are available as supporting information. MCS data are publicly available as Engineering Data Records (EDR, raw data), Reduced Data Records (RDR, calibrated and areolocated radiances), and Derived Data Records (DDR, retrieved profile and surface quantities) on the atmospheres node of NASA's Planetary Data System (https://atmos.nmsu.edu/data_and_ services/atmospheres_data/MARS/ mcs.html). Work by A. K. is supported by NASA's Mars Data Analysis program (NNN13D465T). Work by L. M. is partly supported by the NASA PDART program (NNX15AN06G). Work by A. S., E. M., F. F., and L. M. is supported by CNES and ESA. Work at the Jet Propulsion Laboratory, California Institute of Technology, is performed under contract with NASA. (c) 2019 California Institute of Technology. Government sponsorship acknowledged.