HAL Id: hal-00547719
https://hal.archives-ouvertes.fr/hal-00547719
Submitted on 17 Dec 2010
HAL is a multi-disciplinary open access archive for the deposit and dissemination of sci-entific research documents, whether they are pub-lished or not. The documents may come from teaching and research institutions in France or abroad, or from public or private research centers.
L’archive ouverte pluridisciplinaire HAL, est destinée au dépôt et à la diffusion de documents scientifiques de niveau recherche, publiés ou non, émanant des établissements d’enseignement et de recherche français ou étrangers, des laboratoires publics ou privés.
To cite this version:
Michel Legrand, Isabelle Chiapello, Philippe François, Mohamed T. Nakes. The Infrared Differ-ence Dust Index: Past, Present and Future. LES SATELLITES GRAND CHAMP pour le suivi de l’environnement, des ressources naturelles et des risques, Clermont-Ferrand : France (2010), Jan 2010, Clermont-Ferrand, France. �hal-00547719�
The Infrared Difference Dust Index: Past, Present and Future
Michel Legrand1, Isabelle Chiapello1, Philippe François1, Mohamed T. Nakes21. Laboratoire d’Optique Atmosphérique, Université de Lille 1, 59655 Villeneuve d’Ascq, France 2. University of Kasdi Merbeh, 30000 Ouargla, Algeria
Email: [email protected]
ABSTRACT Introduction
The Infrared Difference Dust Index (IDDI) [Legrand et al, 2001] is a Meteosat-derived thermal-infrared (TIR) index dedicated to remote sensing of desert aerosol over land (based on the former Meteosat First Generation (MFG) series). The IDDI product proves to be effective in studies of dust source location and seasonal activity [Brooks and Legrand, 2000; Léon and Legrand, 2003; Deepshikha et al, 2003a; b], in the physics of dust emission with respect to the surface properties [Chomette et al, 1999; Marticorena et al, 1997; 1999; 2004], for description of dust transport [Petit et al, 2005], of dust mineral composition [Caquineau et al, 2002] and for dust (meteorological) forecasting [Hu et al, 2008].
An improved algorithm and a new cloud masking technique applied to full resolution MFG IR images has given rise to an upgraded dust index. These improvements are described in the next section and resulting IDDI images are displayed and compared with images of the UV Aerosol Index (AI) from the Ozone Monitoring Instrument (OMI) aboard EOS-AURA. They are part of a database (to be completed), over the period 1981-2006 covered by MFG. Obviously, the 1-channel IDDI cannot match with the multi-channel data provided by the new spatial instruments (such as MSG/SEVIRI), but it has the advantage of covering a quarter century (1981-2006) and thus it is relevant for climate studies over this period (including the severe Sahelian drought of the 80s) as well as for investigating on the nature of the link between dust occurrence and epidemics of meningococcal meningitis in West Africa, throughout the 25 past years [Martiny et al, 2007].
In the last section of this abstract, the physical bases of dust remote sensing in the TIR during daylight are briefly presented. They allow to understand the fundamental differences with the more usual detection using channels in the solar spectrum (VIS and NIR) and they bear on the favorable or adverse conditions to produce a dust index of quality. Lastly, it is possible from such results to outline an approach for the determination of the TIR dust optical depth (or a dust index closely related to it), using the TIR channels IR8.7, IR10.8 and IR 12.0 of MSG/SEVIRI, as well as its median infrared (MIR) channel IR3.9.
Upgraded IDDI with MFG data
The original IR images of Meteosat, are processed according to an algorithm based on the simple assumptions for the Earth-atmosphere system of an unchanging ground surface, in the presence of an atmosphere varying with respect to cloudiness and dust. The presence of clouds or/and dust plumes is accompanied by a decrease of radiance outgoing to space, during the daytime, maximum around midday. The processing is performed daily at a fixed time (12 UTC), to avoid the effect of the diurnal cycle. The technique consists of separating in these images, the contribution of the unchanging surface, from the variable atmospheric contribution. The surface contribution is approximated by the maximum radiance of every pixel during a 15-day period long enough to ensure the occurrence of at least one reasonably cloudless and dustless day for each pixel. Hence a clear-and-clean (hot ) composite reference image (RI) is
created with the collection of these hottest pixel values. Then, a difference image (DI) is created by subtracting every original image from its corresponding RI. The information content of the DI relates to clouds and dust. The last step consists of identifying and masking clouds in the DIs. After elimination of the permanent surface pattern in the DIs, clouds are observed over continental regions as over a smooth ocean-like background - so they are more conveniently identified in DIs than in original images.
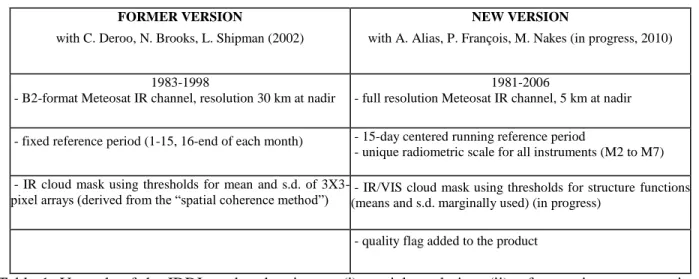
The differences between the new IDDI processing and the former one are summarized in Table 1. The main change is the new cloud mask obtained through cloud identification analysing both MFG IR and VIS DIs using a structure function [Holben et al, 1992]. This change results in an improved discrimination between clouds and dust (less clouds confused with dust, less dust confused with clouds).
FORMER VERSION
with C. Deroo, N. Brooks, L. Shipman (2002)
NEW VERSION
with A. Alias, P. François, M. Nakes (in progress, 2010)
1983-1998
- B2-format Meteosat IR channel, resolution 30 km at nadir
1981-2006
- full resolution Meteosat IR channel, 5 km at nadir
- fixed reference period (1-15, 16-end of each month) - 15-day centered running reference period
- unique radiometric scale for all instruments (M2 to M7) - IR cloud mask using thresholds for mean and s.d. of
3X3-pixel arrays (derived from the “spatial coherence method”) - IR/VIS cloud mask using thresholds for structure functions (means and s.d. marginally used) (in progress) - quality flag added to the product
Table 1. Upgrade of the IDDI product bearing on (i) spatial resolution, (ii) reference image processing, (iii) a single radiometric scale for the Meteosat series, (iv) cloud mask processing and (v) quality flag.
Figure 1. Comparison between AI OMI (left) and IDDI Meteosat (right) of a strong dust outbreak on 2006/03/07 during Sahelian dry season. Resolution is 5 km at nadir for IDDI and 0.25° for AI. Grids are 10°X10° for both images. AI color scale [0-5], IDDI color scale [0-36K] in brightness temperature deficit. IDDI/AOD equivalence: 8±4 K for a unit VIS AOD at 0.5µm (5 K near Niamey). AI/AOD equivalence during March : 440= 1.1.AI -1.3.
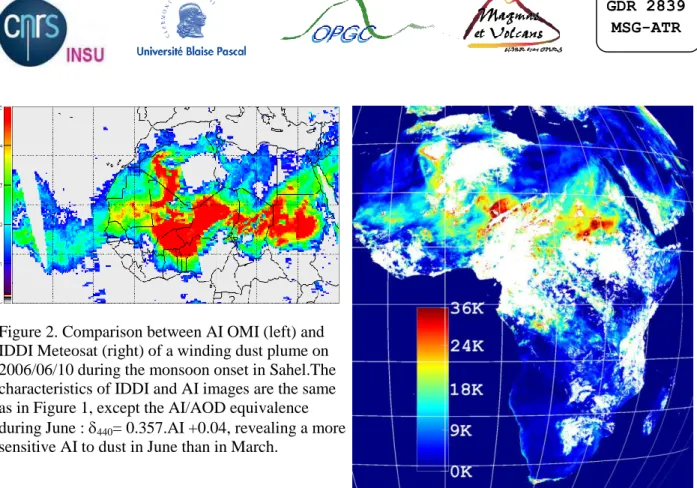
Figure 2. Comparison between AI OMI (left) and IDDI Meteosat (right) of a winding dust plume on 2006/06/10 during the monsoon onset in Sahel.The characteristics of IDDI and AI images are the same as in Figure 1, except the AI/AOD equivalence during June : 440= 0.357.AI +0.04, revealing a more
sensitive AI to dust in June than in March.
The dust AI is derived from the deficit of the UV radiance backscattered to space in the presence of (absorbing) dust. The downwelling UV radiance decreases rapidly when penetrating into the atmosphere, so that the UV radiance deficit is stronger for dust being in altitude than close to the surface. As dust is at higher levels in June than in March (this can be verified from the profiles of the space lidar CALIPSO/CALIOP, e.g. in ICARE archive www.icare.univ-lille1.fr/calipso/browse/), it is more efficient in backscattering the UV, which explains the difference between the AI/AOD equivalence in March and in June (see equations in Figs 1 and 2 captions). This explains the difference of intensity (color) in the AI images in Figs 1 and 2 (the equations show that the AODs are not so different between both cases).
Both presented cases show a general agreement between IDDI and OMI dust distributions (the grids can help to locate the dust plumes). Note that there is no AI cloud mask so that the presence of clouds appears generally as the absence of dust (however in Figure 2 the IDDI image shows an extensive cloudiness and the AI shows clearly a significant presence of dust over clouds). The compared differences of AI to IDDI intensities for the various plumes which can be identified both in AI and IDDI images are mainly explained according to the dust altitude. So in Figure 1, the Bodele dust plume, north of the Chad Lake is certainly lifted in altitude, while on the contrary the dust plume centered (18°N, 5°E) is certainly quite low. Another feature is that the shape and structure of the corresponding AI and IDDI dust plumes are different (IDDI is more structured), due to (i) the difference between spatial resolutions and (ii) the fact that the AI dust pattern describes more dust in altitude while the IDDI dust pattern can be strong for example in case of dust emission, due to a maximum atmospheric dust loading confined near the surface.
Physical bases of dust detection in the TIR
Remote sensing of desert dust in the TIR over the continent is a thermal contrast method [King et al]. During daylight, Earth’s surface absorbs Sun radiation so that it is hotter than the overlaying atmosphere. If this atmosphere is dusty, it can be detected because it is colder than the surface. The main source of TIR radiation is the hot surface which emits radiation to space. If dust is present, it partly absorbs the radiation from the ground, then it emits its own radiation to space, but there is a radiation deficit because it is colder than surface. This process can be expressed by a simple equation provided the
following simplistic assumptions are applied: (i) absorbing gases are not considered, (ii) surface is assumed black at temperature Ts, (iii) dust is assumed non scattering and in an isothermal layer at
temperature Td with transmittance Tr (at the satellite wavelength). The quantitative result is expected to be
realistic (but with a non negligible bias). The radiance ongoing to space is then: Lsat = Tr.B(TS)+(1-Tr).B(Td)
with B the blackbody function of the channel. The dust impact measured from space (i.e. the IDDI) is: ∆Lsat= (1-Tr).[B(Td)-B(TS)]
For an arid surface, a large amount of solar energy is absorbed during daylight and mostly confined within a thin layer containing the surface. This enhances the skin surface temperature TS and creates a
strong superadiabatic lapse rate in the first meters over the surface of up to 60°C/m interpreted as a temperature discontinuity of 15-20°C at the surface, from measurements near Niamey [Frangi et al, 1992]. The layer transmittance is related to the TIR AOD IR according to Tr = exp(-IR). It is related with
the “visible” photometric AOD according to IR = k.VIS, k being a parameter depending on the dust
model, defined from the particle size distribution and mineral composition. From AERONET results near Niamey, a typical value is k = 0.36 (for AOD at 0.5µm and 11.5µm) which means Tr = 0.70 with a unit AOD value at 0.5µm. The value of ∆Lsat which can be derived from these numerical values is in good
agreement with the empirical linear relation between photometric AOD and IDDI near Niamey [Vergé-Dépré et al, 2006], confirming the validity of this simple approach.
A conclusion is that the dust impact (and the IDDI) will be high where the surface discontinuity of temperature is strong, i.e. over the dry bare grounds of the arid and semi-arid regions (Sahara, Namibian desert, Arabian peninsula, as well as Sahel, Somalia and Kalahari desert during the dry season). On the contrary, wet vegetated surfaces and water bodies will experience little or no discontinuity, resulting in a weak sensitivity to dust. A second point is that only mineral dust, characterized by large particles and a significant absorption in the TIR, is able to involve a large impact on the TIR radiance ongoing to space, at the exclusion of all other aerosol species. Last but not least, this simple analytical approach lets imagine a method for deriving the dust TIR AOD from measurements of the MSG/SEVIRI channels considered in introduction, through intermediate determinations of surface temperature TS and dust temperature Td.
REFERENCES
Legrand M., Plana-Fattori, A., and N’doumé, C. (2001), J. Geophys. Res., 106, 18251-18274.
Brooks N.P.J. & Legrand, M. (2000), in Linking climate change to landsurface change, Ch. 1, 1-25, Kluwer Academic Publishers. Léon J.F. and Legrand, M. (2003), Geophys. Res. Lett.; 30(6), doi 10.1029/2002GL016690.
Deepshikha S., Satheesh, S.K. and Srinivasan, J. (2003), Ann. Geophys., 24, 37-61. Deepshikha S., Satheesh, S.K. & Srinivasan, J.(2003), Ann. Geophys., 24, 63-79.
Chomette O., Legrand, M. & Marticorena, B. (1999), J. Geophys. Res.; 104, 31207-31215.
Marticorena B., Bergametti, G., Aumont, B., Callot, Y., N’doumé, C. & Legrand, M. (1997), J. Geophys. Res., 102, 4387-4404. Marticorena B., Bergametti, G. & Legrand, M. (1999), Contr. Atmos. Phys., 72, 151-160.
Marticorena B., Chazette, P., Bergametti, G., Dulac, F. & Legrand, M.(2004), Int. J. Remote Sensing, 25, 603-626.
Petit R.H., Legrand, M., Jankowiak, I., Molinié, J., Mansot, J.L., Marion, G. & Asselin de Beauville, C. (2005), J. Geophys. Res.,
110, doi 10.1029/2004JD004748 (2005).
Caquineau S., Gaudichet, A., Gomes, L. & Legrand, M. (2002), J. Geophys. Res., 107, doi 10.1029/2000JD000247. Hu X.Q., Lu, N.M., Niu, T & Zhang, P. (2008), Atmos. Chem. Phys., 8, 1649-1659.
Thomas N. (2008), Rapport de stage de Master, 64 pp.
Holben, B.N., Vermote, E., Kaufman, Y.J., Tanré, D. & Kalb, V. (1992), IEEE Trans. Geosc. Remote Sensing, 30, 212-222. King M.D., Kaufman Y.J., Tanré D., and Nakajima T. (1999), Bull. of the Am. Met. Soc., 80, 2229-2259.
Frangi J.P., Druilhet A., Durand P., Ide H., Pages J.P. and Tinga A. (1992), Ann. Geophys. 10, 25-33. Vergé-Dépré G., Legrand M., Moulin C., Alias A., and François P. (2006), Ann. Geophys., 24, 1-9.