©byR.Oldenbourg Verlag,
-0044-3336/87
Modern EPR-Related Methods
in
Surface Science and
Heterogeneous
Catalysis*
By
M.Heming
Physikalisch-Chemisches
Institut derUniversität,Winterthurerstrasse190,CH-8057Zürich,Switzerland (Received July22,1986)
Electron
spin
resonance/
Electron nuclear doubleresonance\
Muon
spin
rotation/ Surfaces
Materials of interest in
heterogeneous catalysis
arealmostexclusively
inapolycrystalline
oramorphousstate. In EPRspectroscopy,orientationalaveraging, inhomogeneousline broadeningandoverlapofspectraoften leadtoadrastic loss of resolution. Thismight preclude detailed information about the observed species and its interaction with the surroundings.Theapplicationof various modern ENDOR andpulseEPR
techniques
in ordertoimprovethe resolution is discussed. In addition, thecloselyrelated method ofMuon
Spin
RotationO^SR)is considered in view of itspossiblecontributionstothestudy
ofMuonium,the
light isotope
ofhydrogen,
and muonium-labeledorganicfree radicalsonsurfaces.
Katalytischinteressante Materialienliegen
häufig
nurinpolykristallineroderamorpherFormvor. Dementsprechendsind diezugehörigen EPR-Spektrenin derRegelalsFolge
der räumlichen Mittelung sowie einer starken inhomogenen Linienverbreiterung und eventuell einer
Überlagerung
verschiedenerSpektrennurschlechtaufgelöst.DieAnwen-dung verschiedener ENDOR- und EPR-Puls-Methoden zur
Verbesserung
desAuflö-sungsvermögens wird diskutiert. Zusätzlich wird die
Myonen-Spin-Rotations-^SR)-Technik diskutiert. Mittels dieser Methode können Myonium (das leichte Isotop des
Wasserstoffatoms)undMyonium-substituierteRadikale auf Oberflächen untersucht
wer-den.
1. Introduction
Withinthe last30 years EPR hasbecomea
powerful
andindispensible
tool for thestudy
ofparamagnetic species
inheterogeneous catalysis
and surface science[1
—
5].
In
principle
EPR iscapable
ofdelivering
informationconcerning
the nature ofparamagnetic species,
their electronic and* Presented as a
Plenary
Lecture atthe IV. InternationalSymposium
onMagnetic
Resonance in Colloid and InterfaceScience, Münster, FRG,July21—25,1986.
geometrical
structure,theirinteraction with thesurroundings,
theirreactivi-ty
and kinetics. Anaccuratecharacterizationofaparamagnetic species
andof the interaction with its
surroundings
isa formidable task. Itrequires
thedetermination ofasmanyas
possible Spin-Hamilton
parameters,
including
the orientation of the
principle
axes of the various tensors. In addition acareful
analysis
of thelineshape
isnecessary toelucidatedynamical
aspects
[6,
7],
and kinetic studies may involve time-resolved EPRtechniques
on various levels ofsophistication.
An idealEPRexperiment
thereforerequires
a well-defined
system,
e.g. asingle-crystal
surface.Although
very fewexperiments
have been carriedouton suchsystems
(e.g. [8]) demonstrating
the
capacities
ofEPRspectroscopy,
theoverwhelming
majority
of materials inheterogeneous catalysis
isinapolycrystalline
or,evenworse,amorphous
state.Therefore,
the determination of the orientation of theprincipal
axesof the various tensors is a
priori
notpossible.
Orientationalaveraging
of theanisotropie
interactions,
distribution ofSpin-Hamilton
parameters
rather thanwell-definedvalues,
andinhomogeneous
linebroadening
as a consequenceof weakdipolar
interactions often resultin apoorly
resolvedEPR
spectrum
andmakeameaningful quantitative
analysis
difficult,
ifnotimpossible.
Additionalcomplications
mayarisethrough
extensiveoverlap
ofspectra
ofdifferentspecies.
Inthecaseof
inhomogeneous
linebroadening
aconsiderable resolutionenhancement can be achieved
by
applying techniques,
which arecapable
of
directly measuring
NMR transitionfrequencies
inparamagnetic
systems.
It is the purpose of this paper to discuss with thisrespect
thepossible
applications
ofmoreadvanced EPRtechniques,
like the various forms ofElectron Nuclear Double Resonance
(ENDOR)
spectroscopy
[9
—
11]
and Electron
Spin
Echo(ESE)
spectroscopy
[12, 13],
thepulse
variant ofcwEPR. In
addition,
theclosely
relatedmethod of MuonSpin
Rotation(pSR)
[14]
will be discussed in view ofitspotential
contributions to thestudy
ofMuonium,
thelight isotope
ofhydrogen,
and muonium-labeledorganic
radicals on surfaces.2. Electron nuclear double
resonanceIn an ENDOR
experiment
onesimultaneously performs
an EPR and aNMR
experiment by observing
the effect of astrong
radiofrequency
(rf)
field on apartially
saturated EPRabsorption.
Thetechnique
and itsapplications
havebeenextensively
covered in recentmonographs
[9
—11].
ENDORonmaterialsinadisorderedstatemay
give
riseto twodifferenttypes
ofspectra
[9, 15]: (1) anisotropie
ENDOR,
i.e.frequencies
do occurdisplaced
from the free nuclearprecession frequency,
and(2)
MatrixENDOR,
which often constitutes ofa more or less structuredsignal
cen-teredat thenuclear Larmor
frequency.
362.1.
Anisotropie
ENDORThe
shape
of thespectrum
depends
characteristically
on thepart
of the EPRspectrum
which issaturated,
on thedegree
and kind ofanisotropy
and on the dominant relaxation
pathways.
It is the latterfact,
which maycomplicate
asimulation of thelineshape considerably.
Rist and
Hyde [16,17]
firstpointed
outthepossibility
toobtain ENDORspectra
whichcorrespond only
to a limited set oforientations,
if the ENDOR effect is observed at theturning
points
of an EPRspectrum.
Specifically, they
noted that it ispossible
to obtainsingle-crystal
type
spectra
forsystems
where(1)
onemagnetic
interaction(hyperfine anisotropy,
zero-fieldsplitting
or
g-anisotropy)
dominatesthe EPRspectrum
or(2)
twomagnetic
interactions haveacomparable degree
ofanisotropy,
but theaxesof
largest anisotropy
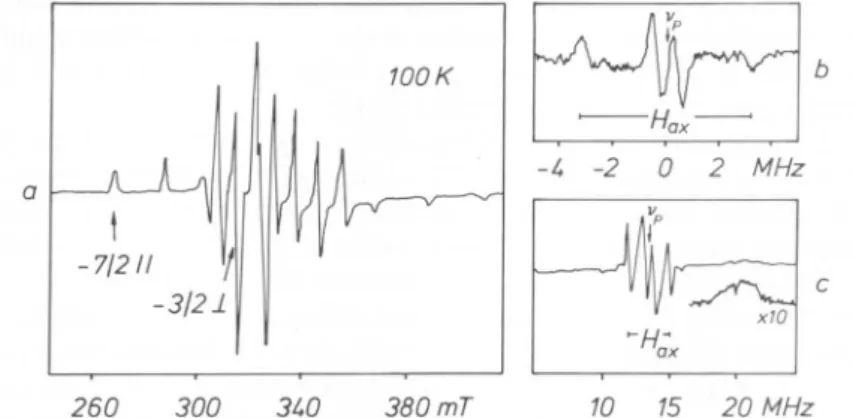
coincide.Asan
example
of(2),
the EPR and ENDORspectra
ofVO2
+ adsorbed onNaY[18]
areshown inFig.
1a,b. The zeolite is inafully hydrated
state.In the EPR
spectrum
nohyperfine coupling
withneighbouring
nuclei isobserved. With the
magnetic
field set at the mx =— ß\\
transition,
only
orientations
along
the common z-axes of the g- and theV02
+-hyperfine
tensorare selected. The ENDORspectrum
isreadily
identified to be dueto
VO(H20)2+
by comparison
with the frozen solutionspectrum.
Thefrequencies
correspond
to thehyperfine
tensorcomponents
ofthe "axial" and"equatorial"
protons
along
the V=0 bond direction. On the otherhand,
aquasi
two-dimensionalspectrum
is obtained withthemagnetic
fieldset at the
Mj
=—
3/2x
transition,
as shown in
Fig.
lc. In addition to260 300 3W 380mT 10 15 20MHz
Fig. 1.(a)EPRspectrumof the
VO(H20)5+-complex
infully
hydrated NaY. Asingle-crystal
like ENDOR spectrum (b) is observed with themagnetic field set attherti\ =—
7/2ytransition.Forthe
magnetic
fieldset atthem¡=—
3/2±transitiona
predominantly
two-dimensional ENDORspectrum(c)is obtained.
Signals
duetoprotonsin the axialwatermoleculearedenotedas Hax.vp markes the free nuclear
precession frequency.
No Matrix-line is observed.Redrawn from Ref.[18]withpermissionof the author.the
perpendicular (relative
to the V=O bonddirection) hyperfine
tensorcomponents
of the axialprotons,
thespectrum
reveals theparallel
(very
weak)
andperpendicular
components
of theequatorial
protons.
Evacu-ation atroomtemperature
leadstoa loss of theproton
signals,
which hasbeen
interpreted
intermsofbinding
ofV02+
tofour oxygens of the zeolitenetwork and loss of the axial watermolecule.
Inordertoobtainthe true
principal
values of thehyperfine
tensoritisnecessary to record the ENDOR
spectrum
overthe entire EPRspectrum
[19,
20].
Atheory
ofpolycrystalline
ENDORpatterns
for dominantg-anisotropy
[19]
revealsthat it is notonly possible
to extract theprincipal
values of thehyperfine
tensor,but that in addition the relative orientations of theg-and -tensors may be deduced fromextradivergences
and maximainthe ENDOR
spectrum
atintermediate fieldsettings.
Alternatively,
some of theprincipal
values of thehyperfine
tensorand the orientations of theirprincipal
axes may be obtained from ENDOR-induced EPRspectra
[21].
The idea is to measure thechanges
of theamplitude
ofan ENDORfrequency
= vn + as a function of themagnetic
field. Forasingle
coded(frequency
modulationonly)
ENDORline the EPR
spectrum
isreadily
obtained in the form of anabsorption
spectrum.
For =1/2
^max(m¡n),
asingle-crystal
type
EPRspectrum
isobtained. Since the
frequency
is fielddependent
one has toadjust
the rf-fieldwhilstscanning
themagnetic
field.In contrast to the orientation selected ENDOR
spectra,
powder
type
spectra
are obtained forarbitrary
magnetic
fieldsettings
or whenever conditions(1)
and(2)
are not fullfilled. Ingeneral,
the ENDORintensity
will be the better the lower thehyperfine anisotropy
is.Thus,
j?-couplings
oforganic
free radicalsareusually quite
wellresolvedsincetheiranisotropy
constitutes often
only
asmall fractionof theisotropie hyperfine coupling.
In contrast,signals
due to-protons
are often smeared out over alarge
frequency
range and difficultto detect[9, 15].
Indeed,
theease with which it ispossible
to measuresmallß-couplings
accurately
has enabled Clarkson[22]
to show that the^-couplings
of theperylene
cation radical adsorbed on metal oxide surfaces can be used tomonitor the interaction
strength
ofthe radical with the acidicadsorption
sites. The^-couplings
werenotresolved in the EPRspectra.
So
far,
weimplicitly
assumed thecrossrelaxationrate(T~l)
to be slowcompared
to the electron and nuclearspin-lattice
relaxation rates(T[el,
Tfn1).
If,
however, Tx
<Tle, Tln
atruepowder
pattern
isobtained,
i.e. allpossible
orientations contributeirrespective
of whichpart
of the EPRspectrum
is saturated. Thiscase has been treatedby
Dalton and Kwiram[23].
Under this condition ENDOR-induced EPRmaybe usedtoseparate
overlapping
EPRspectra.
In the last few years
Schweiger
and coworkersintroduced a number ofspectra.
Among
them,
ENDORutilizing
acircular-polarized (CP-ENDOR)
[24]
or apolarization-modulated (PM-ENDOR) [25]
rf-field should turn outtobe useful for theinterpretation
ofanisotropie
spectra
too.In CP-ENDOR one takes
advantage
of thefact,
that the transitionprobability
inducedby
the left hand(Lh.)
orright
hand(r.h.) rotating
rf-field
component
depends
ontherelativemagnitude
of theexternalmagnetic
fieldB0
(I)
and the internalmagnetic
fieldBe
(\).
IfB¡.
outweights
B0
than the direction of the effectivemagnetic
fieldBefi
(|") changes
itssign
withFor this
simplified
example
ofisotropie couplings
(a,
g„ >0)
only
r.h.(Lh.)
rotating
fieldcomponents
induce transitions forms =+1/2
(—1/2).
On the other
hand,
in PM-ENDORarotating
rf-fieldcauses amodula-tion of the transimodula-tion
amplitude.
The modulationdepth
decreases with thehyperfine
interaction.Thus,
PM-ENDOR is atechnique
suitable tosuppress the Matrix-line. 2.2. Matrix-ENDOR
Besides the
anisotropie
linesa commonfeature in thespectra
of disorderedmaterials is the so-called Matrix-line
[26] occurring
at the free nuclearprecession
frequency.
This line is duetoweakly coupled
nuclei,
themain interactionbeing
the electron-nucleardipolar
interaction. As anexample,
the Matrix-line
originating
from the interaction between theKgH
surface defectcentreintheMgO (111)
crystal
face andphysisorbed
H2
at4.2 is shown inFig.
2[27].
Anaverage interaction distance of<r>
= 0.52nmhasbeen inferred from the line-width.
A
quantitative analysis
ofthelineshape following
the ideas ofHyde
and coworkers[26, 28]
is,
ingeneral,
tedious and does notalways provide
aunique
set ofparameters
[15].
Thelineshape
isparticularly
sensitive tothe nuclear relaxation mechanism. Given aS =
1/2,
/ =1/2 spin
systemaPake doublett would be
expected
foranisotropie
nuclear relaxation rateTi„.
However,
assuming
that the nuclear relaxation occursprimary
through
the modulation of the electron-nucleardipolar
interaction via therelaxing
electronspin,
^1
becomes orientationdependent
and the doublettmergesintoa
singulett
[26].
Withinthelast few years it turnedoutthat theanalysis
of the modulation effectin ESEspectroscopy
is better suited toobtain structuralinformationsfromvery
weakly coupled
nuclei[12, 13].
3. Electron
spin
echo
(ESE)
spectroscopy
InanESE
experiment
onemonitorsthespontaneous
outburstof microwave energyas afunctionof thetiming
oftwoor moreshortresonantmicrowave-1-
13 15 17 MHz
Fig.2. ENDORsignalofthe K§HsurfacecentreinMgOafteradsorptionofH2at4.2 .
Redrawn from Ref. [27]withpermissionof the author.
Fig.3. Schematic of the 2
pulse
ElectronSpin
EchoModulationexperiment.
pulses.
In atwo-pulse
experiment,
the initial/2
pulse
prepares thespin
system
in a coherent state.Subsequently,
thespin
packets,
each characterizedby
itsownLarmorprecession frequency
a>¡,starttodephase.
A second
-pulse
at timeeffectively
reverses the time evolution of thespin
packet
magnetizations,
i.e. thespin packets
start torephase,
and anemission of microwave energy
(the
primary echo)
occurs at time2 . Theecho
amplitude
as a function of constitutes the ESEspectrum
(Fig. 3).
40Relaxation processesleadto anirreversible loss of
phase
correlation,
thusthe
amplitude decays
withacharacteristic timeT™,
thephase
memorytime.Fortunately,
thedecay
is oftenaccompanied
by
amodulation of the echoamplitude. Analysis
of themodulationfrequencies
andamplitudes
forms the basis of the ElectronSpin
Echo Modulation(ESEM)
spectroscopy.
The modulation effect is a consequence of the violation of thehigh
fieldapproximation.
Non-diagonal
elements due toanisotropie hyperfine
andquadrupole
interactionscausemixing
of nuclear levels. This inturnallows the simultaneous excitation of allowed and forbiddentransitions,
if the microwavemagnetic
field isstrong
enough.
Thebranching
oftransitionscauses
interferences,
which manifest themselves as a modulation of theecho
amplitude.
A convenientexpression
intermsoftheeigenfunctions
andeigenvalues
ofaspin
systemundertheassumption
ofcomplete
excitation ofthe EPR
spectrum
has beengiven
by
Mims[29, 30].
Fora S=1/2,
/=1/2
system
the modulationfunctioncan be written as[29]
:Vmod(2 )
= 1 —k/4[2
— 2cosovr — 2cosco^r(la)
+cos(cox
—(Op)T
+cos(a>a
+ß) ]
k =/ ß
, =ggjßn(3
sin0cos0)//zr3
(1
b)
^ß are the ENDOR
frequencies,
iui is the nuclear Zeemanfrequency,
theangle
between themagnetic
fieldB0
and theelectron-nuclear axis. All othersymbols
have theirusualmeaning
inmagnetic
resonance.Inderiving
Eq.
(1)
thevalidity
of thepoint-dipole approximation
and anisotropie
g-factor have been assumed.
The
frequency
spectrum
contains notonly
the ENDORfrequencies,
but inaddition their sumsand differences. Forweakly
coupled nuclei,
ß= , and
only
twofrequencies
are observed. In the presence ofin-teracting
nuclei the total modulation function issimply
theproduct
ofthe individualmodulation functions[29, 30]
:Vmod Hi
mod
·(2)
From
Eqs. (1)
and(2)
it is evident that the modulationdepth
increasesstrongly
with the number ofinteracting
nuclei and adecreasing
electron-nuclear distance. In
addition,
the modulationdepth
also increases with the nuclearspin
/[29].
However,
it has to be recalled that close and thereforestrongly interacting
nucleiareESE-silent. Indisordered matricesa simula-tion of the ESEspectrum
requires,
inprinciple,
ageometrical
model forthe mutual
arrangement
of theinteracting
nuclei. On the other hand it is the aimoftheexperiment
toestablish suchamodel.Consequently,
Kevan etal.[31] argued
to base the dataanalysis
on aspherically
uncorrelated distributionmodel,
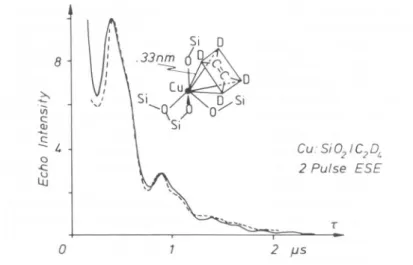
i.e.Cu:Si02IC2DL
2 Pulse ESE
O 2 µ5
Fig.4. Calculated (-) and experimental (-) 2
pulse
ESEM spectra for impregnatedCu:Si02activatedat1000 andwithadsorbedC2D4.Theproposedmodel for theCu2+—
C2D4interaction is showntoo. Redrawn from Ref.[33] with
permission
from L. Kevan.
where r is an effective shell distance. This model is now
widely
accepted
[32].
A fit reveals threeparameters,
the number ofinteracting
nuclei,
their effective distance and the Fermicontact interaction.Asan
example
thetwo-pulse
ESE spectrum forimpregnated
Cu2+ in a silicagel
activated at 1000 withsubsequently
adsorbed deuteratedethylene
is shown inFig.
4[33].
Theanalysis
indicates four deuterons atr = 0.33 nm and with űiso = 0.15 MHz. At this distance a direct bond
between
Cu2+
andethylene
isclearly
excluded.Together
with the informa-tion derived from theg-factors,
the authorswereabletoproposeadetailedgeometrical
model,
which is shown in thesamefigure.
Inessence,the Cu —04
tetrahedra distortuponadsorption
ofethylene
towardseitheratrigonal-bipyramidal
or asquare-pyramidal
geometry.
Instead of
stepping
fromexperiment
toexperiment
the full informa-tioncanbe obtained in asingle
step
by
replacing
the initial/2-pulse
witha low-level extended-time
excitation,
e.g. a cw-microwavemagnetic
fieldwithconstant
amplitude
andappropriate frequency
[34].
However,
onehasto takesome
sensitivity
lossinto account.The mainlimitationofthe
two-pulse
experiment originates
fromphase
relaxation processes. If becomestoo short the instrumental deadtime,
typically
about 150ns, maycover asubstantialpart
of the ESEspectrum.
Further,
multiple frequencies complicate
thespectrum.
Bothproblems
maybe overcome
by
observing
the stimulated echo in athree-pulse
sequence.Dividing
the secondpulse
of thetwo-pulse experiment
into two/2
pulses
essentially
storesthemagnetization
inthe—
direction.The echocannow be followed over a time of the order of
magnitude
7\
>T™.
With theseparation
between thefirstand the secondpulse
denotedas and theone between the second and thirdas T,the stimulatedecho,
occurring
at2 +,
is monitored in the-space.
The modulationfunctioncanbecalculatedfrom
Eq. (1) [30]:
^
=1/2^,70+^,70].
(4)
Incontrastto the
two-pulse
modulation function the sumsanddifferences of the ENDORfrequencies
are now eliminated. Maximummodulation-occurs for
weakly
interacting
nuclei for =(2
+1) ,
whereas for( \ = 2 the modulation
amplitude
vanishes. Ingeneral,
thethree-pulse experiment
issuperior
tothetwo-pulse experiment.
However,
severalexperiments
with differentsettings
have to beperformed
to make sure thatnofrequencies
areoverlooked.Alternatively,
the properselection ofmaysuppress unwanted
frequencies
andsimplify
theanalysis.
Fig.
5 shows thethree-pulse
ESEspectrum
ofPd+
inPd17-NaX
formed after methanoladsorption [35]. Selectively
deuterated methanol was used inordertodetermine the orientationof theadsórbatewithrespect
toPd+.
interaction withonemethanol molecule andamolecular
dipole
orientation.Pd+
isprobably
locatedatSII'or SII sites in the sodalite cages.Several
glitches
in thespectrum
areapparent
anddisturbing. They
originate
fromtwo-pulse
echoes(at
times =0 and= )
and from arefocussing
echo withopposite phase
attime2 .Recently,
Fauthetal.[36]
demonstrated aphase-cycling
excitationmethod,
which eliminates theseunwantedechoes.
The full
potential
of ESEM spectroscopy has been demonstratedby
Kevan and coworkers[37, 38]
in acontinuing
series ofinvestigations,
concerning
thelocation,
migration
and coordination of transition metal ionsonmetal oxide surfaces.Besides the
study
of modulationeffects,
ESE canbe useful to sort outoverlapping
EPRspectra
and for thestudy
of slow motional processes. For theseparation
ofoverlapping
EPRspectra
onetakesadvantage
of thetime-domain nature of ESE.
Keeping
in atwo-pulse experiment
fixed andsweeping
B0
produces
anESE-induced EPRspectrum
aslong
asthephase
memory time is field
independent.
The induced EPRspectrum
isdisplayed
as anabsorption
spectrum.
Bx
has to be reducedcompared
to ESEM toallowa
good
resolution of theEPRspectrum
andtoavoidanymodulations.Overlapping
EPRspectra
mayeasily
beseparated,
if the two(or more)
paramagnetic
species
exhibitsufficiently
differentphase-memory
times,
by
properselection of . On the other
hand,
significantly
slower motionscanbe studied
by
ESE,
since thephase
memory time canbe several orders ofmagnitude higher
than?,
the inverse of theinhomogeneously
broadenedEPR line. In
addition,
thespin packet
line-width can be monitored overthe entire EPR
spectrum
in atwo-dimensionalexperiment providing
verydetailed information about motionalprocesses
[39].
4. Muon
spin
rotation
Although
chemists haveappreciated
foralong
time the role ofelementary
particles,
such as theelectron,
theproton
or the neutron, in studiescon-cerning
the structure anddynamics
of matter, otherelementary particles
arestill
regarded
asbeing
to some extent"exotic".To
begin
with,
it thereforeseemsappropriate
tointroduce in brief thepositive
muon and toemphasize
its usefullness as aspin probe
from thepoint
of view ofachemist[40].
The
positive
muonisproduced
in theparity-violating decay
ofapositive
pion
into amuon anda neutrino:+
-> µ+ + µ .Like the
proton
it is aspin
1¡2 particle.
However,
its associatedmagnetic
momentis3.18 times
larger
thantheproton
magnetic
moment,whereas itsmass is smaller
by
a factor of9. It isa short-livedparticle
(i1/2
= 1.5µß)
and
decays
intoapositron
and twoneutrinos. Whenamuon isstopped
inmatteritthermalizeswithinlessthan1 ps.
During
this timeitcanassociatewithanelectron.
Thus,
Mu(sii
+e~)is
formed,
which shouldberegarded
as the
light
isotope
ofhydrogen
(=p+e~).
Indeed,
the Bohrradius,
thereducedmassand theionizationenergycoincidewithin less than 0.5%. As
an
isotope
ofH,
Mu behaveschemically
(besides
asometimeshughe
isotope
effect)
very much alike. Mucanundergo
avariety
ofreactions,
including
theadditionto anunsaturated bond:
Thereby
amuonatedradicalisformed.Muoniumandmuonatedradicalshavebeen
mainly
studiedby
the time-domaintechnique
ofMuonSpin
Rotation^SR).
Thistechnique
has beenvery
successfully exploited
for[41]:
(1)
Studies of the kinetics of Mu reactions in the gasphase
and theliquid
phase.
Especially,
thegasphase
studies haveprovided
avery criticaltesting
ground
for reactionrate theories.(2)
Thedetermination ofabsoluterate constantsoffastorganic
radical reactionsin theliquid
phase.
Inthiscasethemuon is usedas apassive spin
probe.
The
µSR-technique
is outlined inFig.
6.Spin-polarized
muons arestopped
inaprobe,
whichitselfisplaced
inamagnetic
fieldtransversewithrespect
to thespin polarization
of theincoming
muons. The muonspin
then starts to precess with a
frequency depending characteristically
onthe
locally experienced magnetic
field. The evolution of the muonspin
polarization
in time andspaceis monitoredby
measuring
thetime,
which the muonspends
in theprobe
until itdecays,
and the direction of the emittedpositron.
The latter ispreferably
emittedalong
the instantaneous direction of themuonspin.
Thetechnique requires
thatonly
one muonatatime ispresentin the
probe. Summing
upevents(typically
afewmillion)
for a
given
directionyields
radioactivemuondecay
curves, modulatedby
muonspin
precession frequencies.
Analysis
ofthesecurves inthe Fourierspace
[42],
reveals thesefrequencies (hyperfine
couplings),
theiramplitudes
(yields),
theirphases
(information
about the formationhistory)
and their relaxation rates(incl.
chemical reactionrates).
Essentially,
thetechnique
parallels
anidealFT-NMRexperiment,
whereonewould monitor the FID afteraninfinitely
strong
90°-pulse.
Like
EPR,
/zSR
is nota surfacespecific technique.
The main obstacleis,
ofcourse, to thermalize sufficient muons outside the bulk material. Ithas been
firmly
establishedthat,
by
using
a 7nm diameter non-poroussilica
powder
as aprobe,
the muons almostexclusively
thermalize as Mu inthe voidregions
between thepowder grains [43].
Anegative
work func-tionmayberesponsible
for thisobservation[44]. Fig.
7shows the relaxation rate for Mu on a silica surface as a function oftemperature
[45].
BelowFig.6.Schematic of the time-differentialpSR experiment. S: sample, a,b,
c,f¡,f2,
Pi, p2:scintillation counters,D:degrader. :magneticfield.Reproducedfrom Ref. [41]withpermission
of the author.20 10 5
Fig.7. Mu relaxationrateon asilica surface inatransverse
magnetic
field of 7.3 10" •: Si02evacuatedat383K;permission
of the author. Si02evacuatedat873 K. Redrawn from Ref.[45]with
8
K,
Muis localizedonthesurface,
the relaxationratebeing mainly
causedby dipolar
interactions with the surfacehydroxyls.
Above 8K,
Mustarts to move on the surface and motionalnarrowing
decreases the relaxationrate,untilMu becomes localized in
deeper
traps
at25 K. Fromlongitudinal
1-1-1-1-;-1-1-1-1-1-1-1-
200 220 240 260 280 300 32C
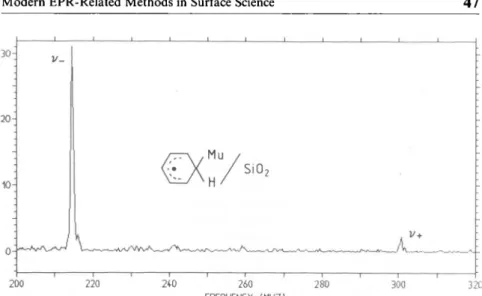
FREQUENCY (MHZ!
Fig.8. Fourier power spectrum of the muonated cyclohexadienyl radical on a fully
hydroxylatedSi02 surfaceatroomtemperatureinamagneticfield of0.238 T.
impurities (about
6ppm).
At stillhigher
temperatures
detrapping
andeventually desorption
ofMuoccurs.In addition to the reaction kinetics of Mu with
ethylene
on a silicasurface
[46],
the reaction of Mu with aplatinum-loaded
silica surface hasbeen studied. The
Pt-crystallites
werecoveredby
oxygenandasteep
increaseofthe relaxation ratearound40—60 has been
interpreted
in termsofa chemical reaction[47, 48]:
Mu +
O(ads)
-» OMu·
Recently,
we succeeded to observe a muonated radical on a surface[49].
Using
ahydroxylated
silicasurface,
which was coveredby
appr. amonolayer
ofbenzene,
we wereableto detect thecyclohexadienyl
radical.The Fourier powerspectrumis shown in
Fig.
8. Like in ENDORspectro-scopy, two
frequencies
areobserved,
and their sumequals
thehyperfme
coupling
constantµ.
Alarge
difference in theamplitudes
of the twofrequencies
is evident. Due to the finite lifetime of the Mu precursor(compared
to the Muprecession frequency),
the muons do not enter theproduct
state(the
radical)
coherently.
Theresulting
depolarization depends
on themuonprecession frequencies
in the precursor, in theproduct
stateandontheformationrate
[50].
Thesimplicity
of thespectrum
is remarkableand itshould be
possible
tostudy
the behaviour of muonated radicals on surfaces. In order to measure the other nuclearhyperfme couplings
one hasto resort totherecently proposed [51]
anddeveloped
[52, 53] technique
ofAvoided LevelCrossing
/tSR
inlongitudinal magnetic
fields.Although
thepossibilities
of//SR
in surface science arequite
limitedtoday,
this situation willcertainly improve
in the nearfuture,
when nearthermal µ+
-or Mu-beams become available. There is now considerable
effortatthe
major
mesonfactories to constructsuch beam lines.5.
Comparison
Although
all threetechniques directly
measureNMRtransitionfrequencies
in
paramagnetic
systems,
several distinct differencesareapparent.
In disordered
systems
alineshape analysis
is,
of course, mosteasily
performed
in t/SR. No instrumentalperturbations
(e.g electromagnetic
fields,
modulation effectsetc.)
arepresent,
and,
inaddition all orientations of theparamagnetic
species
contributeto thelineshape.
This is incontrast to the orientationselectivity
in ENDOR and ESEM due to the finite excitation of the EPRspectrum.
InENDOR orientationdependent
transi-tionprobabilities
arise via the rf-enhancement effect and orientationde-pendent
relaxationpathways.
In ESEM it is the modulation effect itself which isstrongly
orientationdependent. E.g. neglecting
quadrupole
inter-actions,
the modulation effect vanishes in apoint-dipole
model forB0
parallel
orperpendicular
to the electron-nuclear axis.Thus,
forweakly
interacting
nuclei oftenonly
abell-shaped signal
is observed[54, 55].
It is
important
to note,that thetechniques
monitor differentregions
of thespin density
distribution. ESEMmainly
operates
inthe lowfrequency
region.
Thebranching
of transitions condition and thefinitetiming
resolu-tionimposes
an upper limit of appr. 30 MHz. On the otherhand,
it isdifficult to obtain an ENDOR response from
weakly interacting
nucleiwith low
gyromagnetic
ratios due to difficulties insaturating
the NMR transitions. Likewise it is difficult to measure weak nuclearhyperfine
frequencies
in/¿SR [53].
However,
thetiming
resolutionis much better than in ESEM andmuonhyperfine frequencies
of> 4GHz have been measured[56].
Compared
toENDOR theadvantages
of ESEMare:(1)
the normalizedmodulation
amplitude
issolely
determinedby Spin-Hamilton
parameters,
including
the numberofinteracting
nuclei.(2)
ESEM isnotnecessarily
less sensitive thanEPR,
an ENDOR responseiscommonly
one to two ordersof
magnitude
weaker than the EPRsignal
and(3)
ESEM doesnotdepend
on adelicate balance ofrelaxation mechanismsas ENDOR does.
Although
both,
ESEM and//SR,
aretime-domaintechniques, only ßSR
itself is
already
a kinetic method. Theparamagnetic
species
are createdduring
theexperiment
and their fate is followed for the first few micro-seconds after their birth. UnlikeESEM,
does not suffer from in-strumental deadtimeproblems.
The
versatility
ofpSR
is,
ofcourse, restrictedtothestudy
ofmuonatedspecies.
Finally,
itmight
be worthwhile tomention,
that whereasand ENDOR-measurements often
require
lowtemperatures,
this isnotthecasefor
µ8 .
Acknowledgements
ThanksareduetoProf. H. Fischer and Prof. G. Lehmann for their
continu-ous interest and
support.
Preprints
from Prof. L. Kevan and Drs. D. R.Harshman,
R. F.Kiefland E.Rodunerprior
topublication
areappreciated.
I also wish to thank Dr. E.
Roduner,
who introduced me to the field ofµ$ ,
forvaluable discussions.References
1. D. E.O'Reilly,Adv. Catal. 12(1960)31. 2. J.H.Lundsford,Adv. Catal.22(1972)265.
3. B.D.Flockhart,in:SurfaceandDefect Properties
of
Solids,Chem. Soc.Spec.Period.Rep.2(1973)69.
4. M.Ché,NATO ASI Ser. C61(1980)79.
5. R. F.Howe,Adv. Colloid Interface Sci. 18(1982)1.
6. E.G. Derouane and J. C.Védrine,Ind. Chim.Belg.38(1973)375. 7. J. H.Freed,ACSSymp.Ser. 34(1976)1.
8. C.C. Chao andJ. H.Lundsford,J.Chem. Phys.59(1973)3920.
9. L. Kevanand L. D. Kispert, ElectronSpinDoubleResonanceSpectroscopy (Wiley,
NewYork1976).
10. M. M. Dorio and J. H. Freed, eds., Multiple Electron Resonance
Spectroscopy
(Plenum,NewYork1979).
11. A. Schweiger,Struct.Bonding51(1982)1.
12. W. .Mims,in: ElectronParamagnetic Resonance,S.Geschwind,ed.(Plenum,New
York
1972)chapt.
4.13. L. KevanandR. N. Schwartz, eds., Time DomaineElectronSpinResonance(Wiley,
New York1979).
14. B.Webster,Ann. Rep. Prog.Chem. Sect. C81(1984)3.
15. L. KevanandP. A.Narayana,in:MultipleElectronResonanceSpectroscopy,M. M.
Dorioand J. H.Freed,eds.(Plenum,NewYork1979)
chapt.
6.16. J. S. Hyde, in: Magnetic Resonance in Biological Systems, . Ehrenberg, . G.
Malmström and T.Vänngard,eds. (Pergamon,Oxford1967)p.81.
17. G.H.Rist and J. S.Hyde,J. Chem.Phys.52(1970)4633.
18. H.vanWillingenand T. K.Chandrasekhar,J. Am.Chem.Soc. 105(1983)4232.
19. B. M.Hoffman,J.Martinsen and R.A.Venters,J. Magn.Reson.59(1984) 110. 20. N.D.Yordanov,M.Zdravkova andD.Shopov,Chem.Phys.Lett. 124(1986) 191. 21. A.Schweiger, M.Rudin andJ.Forrer,Chem. Phys.Lett. 80(1981)376.
22. R. B.Clarkson,NATO ASI Ser. C61(1980)425.
23. L. R.Dalton andA. L.Kwiram,J. Chem.
Phys.
57(1972)1132. 24. A.Schweigerand Hs. H.Giinthard,Mol.Phys.42(1981)283. 25. A.Schweiger
and Hs. H. Giinthard,J.Magn. Reson. 57(1984)65.26. J. S.
Hyde,
G.H.Rist and L.E. G.Eriksson,J.Phys.
Chem. 72(1968)4269. 27. E. G. Derouane,Chem.Phys.
Lett. 20(1973)269.28. J.C.Védrine,J.S.Hydeand D. S.Leniart,J.
Phys.
Chem. 76(1972)2087. 29. W. B. Mims,Phys.
Rev. B5(1972)2049.30. W. B.Mims,Phys.Rev.B6(1972)3543.
31. L. Kevan, M. K. Bowman,P. A. Narayana, R. K. Boekman,V. F. Yudanov and
32. W. B.Mims,J. Peisach and J. L.Davies,J. Chem.Phys.66(1977) 5536.
33. M. Narayana,R. Y.Zhan and L.Kevan,J. Phys.Chem.88(1984) 3990.
34. A. Schweiger, L.Braunschweiler,J.-M. Fauth and R. R. Ernst,
Phys.
Rev.Lett. 54 (1985) 1241.35. J. Michalik,M. Hemingand L.Kevan,J.Phys.Chem. 90(1986)2132.
36. J.-M. Fauth,A.Schweiger,L. Braunschweilerand R. R.Ernst,J. Magn. Reson.66
(1986)74.
37. L. KevanandM. Narayana,ACSSymp.Ser.218(1983)283.
38. L. Kevan,tobepublishedinAcc.Chem.Res.,privatecommunication. 39. G.L. Millhauser andJ. H.Freed,J. Chem.Phys.81(1984)37.
40. D.C.Walker,Muonandmuoniumchemistry
(University
Press,Cambridge
1983).41. E. Roduner,Prog. React. Kinet.14(1986)1.
42. P. Burkhard,E. Roduner,J. Hochmann and H. Fischer, J.
Phys.
Chem. 88(1984) 773.43. R. F.Kiefl,J.B.Warren,C. J.Oram,B. M.Marshall,J.H.Brewer,D.R. Harshman andC.W.Clawson,Phys.Rev. 26(1982)2432.
44. R. F. Kiefl,Hyp. Inter. 8(1981)359.
45. D. R.Harshman,R.Keitel, M.Senba,R. F. Kiefl,E.J.Ansaldo andJ. H.Brewer,
Phys.Lett. 104A(1984)472.
46. R.Keitel,M. SenbaandD. R.Harshman,acceptedforpublicationinHyp. Inter.
47. R. F. Marzke, W. S. Glausinger, D. R. Harshman, E. J. Ansaldo, R. Keitel, M.
Senba,D. R.Noakes,D. P.SpencerandJ. H. Brewer,Chem.Phys. Lett. 120(1985) 6.
48. R. F.Marzke,D. R. Harshman,E.J.Ansaldo, R.Keitel,M. Senba,D. R.Noakes and J. H. Brewer,acceptedforpublicationin
Ultramicroscopy.
49. M.Heming, E.Roduner andB. D. Patterson,unpublishedresults. 50. P. W.Percival andH.Fischer,Chem.Phys.16(1976)89.
51. A.
Abragam,
C.R.Acad. Sci. Ser.II,299(1984)95.52. R. F. Kiefl,S. Kreitzman, M. Celio, R. Keitel, G. M. Luke, J. H. Brewer, D. R. Noakes, P. W. Percival, T. Matsuzaki and K. Nishiyama,Phys. Rev. A34(1986)
100.
53. M. Heming,E.Roduner,B. D.Patterson,W.Odermatt,J.Schneider, Hp.Baumeler,
H. Keller and I.M. Savie,Chem.
Phys.
Lett. 128(1986)100.54. A. V.Astashkin,S.A.Dikanov andYu. D.Tsvetkov,Chem.Phys. Lett. 122(1985) 259.
55. A.deGroot,R.Evelo andA. J. Hoff,J.Magn. Reson.66(1986)331. 56. E. Holzschuh,Phys. Rev. 27B(1983) 102.