This content has been downloaded from IOPscience. Please scroll down to see the full text.
Download details:
IP Address: 134.21.47.136
This content was downloaded on 01/05/2014 at 09:49
Please note that terms and conditions apply.
Herbicide and fertilizers promote analogous phylogenetic responses but opposite functional
responses in plant communities
View the table of contents for this issue, or go to the journal homepage for more 2014 Environ. Res. Lett. 9 024016
(http://iopscience.iop.org/1748-9326/9/2/024016)
Environ. Res. Lett.9 (2014) 024016 (9pp) doi:10.1088/1748-9326/9/2/024016
Herbicide and fertilizers promote analogous
phylogenetic responses but opposite
functional responses in plant communities
Loïc Pellissier
1, Mary S Wisz
2, Beate Strandberg
2,3and
Christian Damgaard
2,31University of Fribourg, Unit of Ecology and Evolution, Ch. du Musée 10, CH-1700 Fribourg,
Switzerland
2Department of Bioscience, Aarhus University, Aarhus, Denmark
E-mail:[email protected]
Received 12 September 2013, revised 6 January 2014 Accepted for publication 16 January 2014
Published 26 February 2014 Abstract
Throughout the world, herbicides and fertilizers change species composition in agricultural communities, but how do the cumulative effects of these chemicals impact the functional and phylogenetic structure of non-targeted communities when they drift into adjacent semi-natural habitats? Based on long-term experiment we show that fertilizer and herbicides (glyphosate) have contrasting effects on functional structure, but can increase phylogenetic diversity in semi-natural plant communities. We found that an increase in nitrogen promoted an increase in the average specific leaf area and canopy height at the community level, but an increase in glyphosate promoted a decrease in those traits. Phylogenetic diversity of plant communities increased when herbicide and fertilizer were applied together, likely because functional traits facilitating plant success in those conditions were not phylogenetically conserved. Species richness also decreased with increasing levels of nitrogen and glyphosate. Our results suggest that predicting the cumulative effects of agrochemicals is more complex than anticipated due to their distinct selection of traits that may or may not be conserved phylogenetically. Precautionary efforts to mitigate drift of agricultural chemicals into semi-natural habitats are warranted to prevent unforeseeable biodiversity shifts.
Keywords: agrochemicals drift, environmental filtering, long-term experiment, semi-natural grasslands, trait conservatism, community phylogenetics
S Online supplementary data available fromstacks.iop.org/ERL/9/024016/mmedia
1. Introduction
Throughout the world, modern agricultural practices of inten-sive crop production have promoted the application of her-bicide and fertilizers to deterministically increase crop yield and control unwanted species in agricultural fields (Boutin and 3Co-last authors.
Content from this work may be used under the terms of theCreative Commons Attribution 3.0 licence. Any further distribution of this work must maintain attribution to the author(s) and the title of the work, journal citation and DOI.
Jobin1998). Herbicides achieve this by excluding unwanted species to prevent inter-specific interactions such as compe-tition with crops, but have been shown to drift into adjacent habitats (Boutin and Jobin1998). Although it is well known that herbicides and fertilizers each independently decrease biodiversity Clark and Tilman (2008), Isbell et al (2013), it is unknown how drift from compound agrochemicals will im-pact natural plant communities. Anthropogenic habitat mod-ifications have been shown to shift natural communities in non-random directions (Knapp et al 2008, Dinnage 2009) by decreasing functional (Flynn et al2009) and phylogenetic
Environ. Res. Lett.9 (2014) 024016 L Pellissier et al diversity (Helmus et al2010). Consequently, drift of herbicides
and fertilizers into natural habitats has potential implications for biodiversity conservation because this could lead to select some clades or functional groups that are more tolerant of anthropogenic modifications than others.
Repeated application of fertilizers and herbicides are among the factors thought to explain the decline of biodiversity within agricultural areas (Fuller et al1995, Chamberlain et al 2000, Benton et al2002, Storkey et al2012). Long-term ob-servations suggest that fertilizers drifting into natural habitats at the margins of croplands has led to significant modifica-tions of species composition and richness in communities (Kleijn and Snoeijing1997, Gove et al2007) and experimental studies of nitrogen deposition confirmed those trends (Clark and Tilman 2008). Other studies have also highlighted the role of herbicide drift into adjacent semi-natural habitats as a major factor affecting plant composition and richness of grasslands (Aude et al2003). Jensen et al (2007) demonstrated that low dosages of herbicides have the potential to affect plant success significantly, and in turn reduce the number of species and affect the species composition (Damgaard et al 2008). Although field monitoring can track changes in community composition following exposure to multiple drift agents (Boutin and Jobin1998), only field experiments can distinguish between individual and cumulative effects. Observational studies are unable to distinguish between the effects of individual factors and so far experimental studies have generally focused on isolated effects. Multi-factorial experiments are thus essential to assess the cumulative effect of chemicals drifting from agriculture.
Environmental conditions including those shaped by nearby agricultural practices can serve as a filter on plant assemblages in semi-natural habitats mediated by functional traits (Keddy1992, de Bello et al2012). For instance, only species with the adequate functional traits are expected to tolerate increased levels of herbicide drifting from adjacent fields. In addition, plant species differ in the way they allocate biomass to tissues and this impacts their competitive ability in relation to environmental conditions (Lavorel and Garnier 2002). The composition of plant communities depend, among other things, on inter-specific competitive relationships (Wei-her et al1998, Gotelli and McCabe2002) and it is expected that the sub-lethal levels of herbicides and fertilizer affect plant community composition through altered inter-specific compet-itive interactions. Nitrogen availability tends to intensify com-petition, and to favour species that can transfer resources into biomass more quickly than other species (Grime2006, Clark and Tilman2008). Due to the differential costs of tissue pro-duction in low- and high-resource environments, the optimal strategy along resource gradients is a trade-off between growth rate and nutrient conservation via for instance secondary de-fences (Coley et al1985, Pellissier et al2012). Under particular conditions of resource availability, species survival and domi-nance is driven by hierarchical differences in species’ competi-tive abilities, leading to competicompeti-tive exclusion of inferior com-petitors (Chesson2000). For instance, at the community level, nitrogen excess is hypothesized to favour species that have high specific leaf areas (SLA) values, because these can rapidly
convert captured resources to the construction of new leaves, enhancing their competitive ability to capture light (Clark and Tilman2008). Another hypothesis about the role of competi-tion in community assembly posits that closely related species are expected to be functionally more similar and compete more intensely than their distantly related counterparts (Webb et al2002, Cavender-Bares et al2009). Phylogenetic distance among members of communities may therefore provide infor-mation on how communities assemble under environmental conditions modified by chemical drift from agricultural fields. Here, using an 11-year experiment on semi-natural plant communities, we evaluate the effects of controlled levels of fertilizers and herbicide on semi-natural plant communities. By combining a plant species phylogeny, with two plant traits reflecting competitive abilities (specific leaf area [SLA], canopy height [CH]), we quantify how species richness, plant trait and phylogenetic diversity are influenced by drift-level amount of fertilizers and herbicide. Because the species tolerance to anthropogenic perturbations is expected to exhibit structured phylogenetic patterns (Helmus et al2010, Wiens et al2010), we predict that with the application of herbicide we will find phylogenetic underdispersion, whereby only a few taxa that can tolerate the application of these compounds can dominate plots. However, because herbicide and fertilizers directly impact resource acquisition traits that may not always be phylogenetically conserved, functional structure should also be associated with anthropogenic changes, regardless of the phylogenetic conservatism of those traits.
2. Methods
2.1. Experimental design
The experiment was established in 2001 on a former agricul-tural field on dry, nutrient poor sandy soil (Bruus Pedersen et al 2004). The field was left fallow for two years prior to the start of the experiment. The field is quadrangular and surrounded by small parts of forest on two sides (south and west) and separated from the neighbouring fields by five metre broad hedgerows on the other sides. In spring 2001, the area was deep ploughed down to 60 cm to minimize establishment from the soil seed bank and prepared for the experiment by harrowing and rolling. Thirty-one grassland species were sown in April 2001. Plant species composition and abundance have not been controlled following the initial seeding except for woody species (trees and bushes) that are removed manually and individually every year prior to herbicide application in order to keep the area as grassland.
The experimental manipulations were set up as a random-ized block design with 10 replicates of each of the twelve treatments figure S1 (available atstacks.iop.org/ERL/9/02401 6/mmedia). The treatments included 4 glyphosate treatments (0; 14.4; 72 and 360 g a.i. ha−1 equal to 0, 1, 5 and 25% of label rate of 1440 g glyphosate ha−1). For application of glyphosate (Roundup Bio) over crops, the label rate varies between 720 to 2160 g a.i. ha−1. For most crops the counselled label rate is 1440 g a.i. ha−1 (Jensen et al 2013) and here we considered drift levels as three dilutions of this rate. Our 2
Environ. Res. Lett. L Pellissier et al experiment also included three nitrogen treatments (0, 25 and
100 kg N ha−1). In addition, all plots received phosphorus (53 kg ha−1), potassium (141 kg ha−1), sulfur (50 kg ha−1and
copper (0.7 kg ha−1) every year. The RoundupBio R
formula-tion of glyphosate was used for the experiment. Each plot is seven by seven metres with a buffer zone of 1.5 m surrounding the plot. A buffer zone of 10 m separates the experiment from the surrounding vegetation. Spraying equipment for experi-mental applications was used for the herbicide applications. The beam is three metres with 0.5 m between the nozzles that are Lurmark Lo-drift LD 015 Green nozzles with a pressure of 2.0 bars. The wind speed on the days selected for spraying was very low (0–2 m s−1) and there was no rain, neither was rain expected during the days following the day of spraying. Fertilizers were spread by hand. The plots were treated by glyphosate for the first time on 24 August 2001 and since then, it has been treated with herbicide and fertilizer once every year in spring (mid-ultimo May). For more detailed information on the experimental design see Damgaard et al (2011).
Sampling was performed in six randomly selected 0.75 m × 0.75 quadrates in each plot in mid-June about two weeks after the yearly herbicide application. The pin-point method, providing estimates of plant cover, was used for the sampling. Within each quadrate, plant cover was estimated using a horizontal frame with a 5 × 5 grid with 25 intersections at a distance of 10 cm. While all plots were sampled in 2012, only a subset of plots were sampled in 2005–2007 including the following treatments N = 100 kg ha−1and G = 0 g a.i. ha−1; N = 25 kg ha−1and G = 360 g a.i. ha−1; N = 100 kg ha−1 and G = 360 g a.i. ha−1.
2.2. Phylogenetic inferences
Phylogenetic relationships of the 65 (including both sown species and species having colonized from the regional species pool) plant species recorded at the plots across all years were inferred using DNA sequences extracted GenBank and com-prised rbcL and matK markers (GenBank accession numbers are provided in appendix S7 (available atstacks.iop.org/ERL /9/024016/mmedia)). Models of sequence evolution for each region were calculated using MrModeltest 1.0. The best AIC score for all partitions was the GTR model that accounted for a gamma distribution in considering rate heterogeneity among sites and allowed for a proportion of invariable sites. Two inde-pendent metropolis-coupled Markov chains (MCMC) starting at different random trees were run in MrBayes (Ronquist and Huelsenbeck 2003) for 10 million generations, sampling one tree every 1000 generations. After checking convergence, the consensus tree was checked against the Angiosperm Phy-logeny Group tree for accepted relationships among plant or-ders and families. In community phylogenetics, the phylogeny is used as a proxy of unknown traits that may structure com-munities differentially in contrasted environmental conditions (Webb et al2002). As a corollary, the main assumption of com-munity phylogenetic analyses is that this unknown trait is phy-logenetically conserved and structured along the phylogeny. A phylogram is more appropriate when the traits of interest evolve at a rate proportional to the rate of molecular evolution.
Because the correlation between trait and molecular rates of evolution has been documented in several cases (Bromham 2009, Smith and Donoghue2008), here, we used a phylogram, expected to be more informative of trait evolution compared to a time-calibrated phylogeny. However, because there is no guarantee that the unmeasured traits of interest all vary in exactly the same way with regard to molecular evolution, we also provide in appendix (available atstacks.iop.org/ERL/9/0 24016/mmedia) the phylogenetic analyses using the published time-calibrated phylogeny of Durka and Michalski (2012).
2.3. Trait data collection
Specific leaf area (SLA) is correlated with growth rate and canopy height with light acquisition (Lambers and Porter 1992). We collected two functional traits, specific leaf area (SLA) and canopy height (CH) for each of the species from the LEDA database (Kleyer et al2008) and completed those values from our own measurements. Between 4 and 20 individuals per plant species were measured. Canopy height (H) was measured in the field as the distance between the top of the photosynthetic tissue and the ground. For each individual plant, a fully developed leaf was sampled, immediately weighed, and scanned using Image J software (http://rsbweb.nih.gov/ij/) to quantify its area. The leaves were then dried at 40◦C for one night to obtain dry mass, and SLA was then calculated as the ratio of leaf surface to dry mass, expressed in mm2mg−1. Phylogenetic signal of the traits was assessed following Blomberg et al (2003) K statistic using the ‘Kcalc’ function in the R package ‘picante’ (Kembel et al 2010). We also collected the CSR scores for each of the plant species.
2.4. Phylogenetic and functional diversity
The phylogenetic diversity of monitored plots was calculated using the net relatedness index (NRI = -SES.MPD, Webb et al2002) using the function ‘ses.mpd’ in the R package ‘picante’ (Kembel et al2010). The NRI is a standardized effect size of the observed mean pairwise phylogenetic distance of all species in a community. We built null distributions by randomly reshuffling the tip labels on the phylogeny. Positive NRI values indicate that coexisting taxa are more related to each other than expected by chance and inversely. We also computed community weighted mean (CWM) of SLA and CH accounting for species abundance using the ‘dbFD’ function in the ‘FD’ R package (Lalibert´e and Shipley2013). Using the 2012 data, we compared NRI and CWM values between treatments using a linear model associated with slope tests. We also investigated temporal trends in NRI and CWM, for years when data were recorded (2005, 2006, 2007, 2012) using linear models associated with a slope test.
3. Results
We found comparable effects of nitrogen and glyphosate on NRI but divergent ones on functional CWM. NRI decreased with nitrogen and glyphosate treatments with stronger effect
Environ. Res. Lett.9 (2014) 024016 L Pellissier et al
Table 1. Results of the linear regressions with estimated slope and associated slope-tests between species richness, net relatedness index (NRI) and community weighted mean of SLA and LDMC.
Estimate t p
(a) Species richness
Glyphosate −0.14759 −5.02 <0.0001 Nitrogen −0.05349 −8.49 <0.0001 Interaction 0.00330 6.68 <0.0001 (b) NRI Glyphosate −0.06455 −5.93 <0.0001 Nitrogen −0.00767 −3.33 0.001 Interaction 0.00055 3.06 0.003 (c) CWM SLA Glyphosate −0.15104 −5.71 <0.0001 Nitrogen 0.04723 8.32 <0.0001 Interaction −0.00044 −0.99 0.325 (d) CWM CH Glyphosate −6.58 × 10⁻³ −3.2 0.0018 Nitrogen 6.74 × 10⁻³ 15.29 <0.0001 Interaction −1.27 × 10⁻⁴ −3.686 0.00035
from glyphosate than from nitrogen (table 1, figures 1(B) and (C)). This indicates that the two treatments increase the phylogenetic diversity of plant communities by increasing the cover of several distinct lineages (figure1(A)). The significant interaction term indicates that the individual factors have a different effect when combined (table1). Indeed, combining the two treatments tend to reduce the effect suggesting that glyphosate and nitrogen treatments do not promote exactly the same lineages (figure1(A)). Results were highly similar when NRI was computed using the time-calibrated phylogeny of Durka and Michalski (2012) appendix S5 (available atstac ks.iop.org/ERL/9/024016/mmedia).
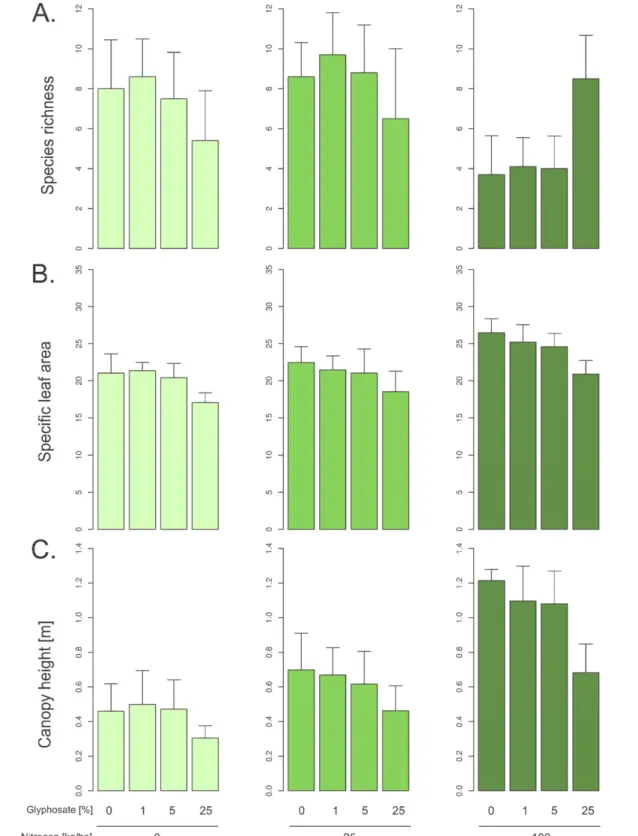
In contrast, we found opposite effects of nitrogen and herbicides on the community weighted mean of SLA and CH (table1, figure2). An increase in nitrogen promoted an increase in the average SLA and CH at the community level, but an increase in glyphosate promoted a decrease in those traits (table1, figure2). Regarding species richness, we found that an increase in nitrogen and glyphosate had a negative effect on plant species richness. However, the significant interaction term indicated that once combined, the two treatments allowed a species richness that was comparable to the control plots. Furthermore, we found a significant effect of treatments on the CSR scores of communities appendix S6 (available atsta cks.iop.org/ERL/9/024016/mmedia).
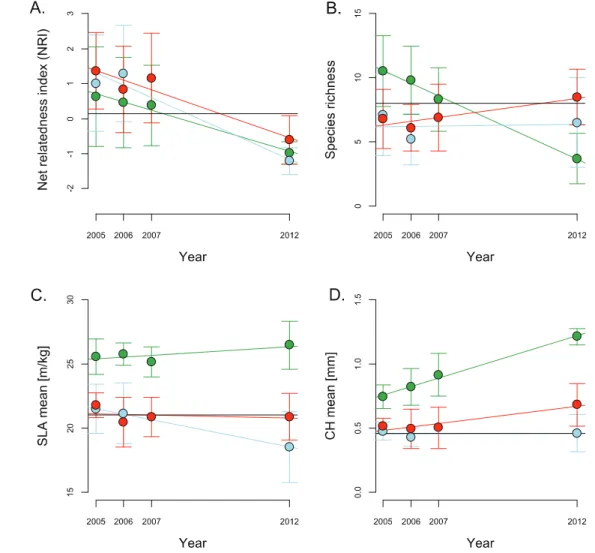
Temporal trends further indicated that the effect of ni-trogen and glyphosate on NRI and CWM occur at different speeds (figure3, table2). For instance, the effect of nitrogen on CWM of SLA is almost immediate, while the effect of glyphosate is gradual with a decrease after a longer time to exposure. The Blomberg’s K values for SLA (K = 0.12) and CH (K = 0.10) were low and indicate that those traits were not conserved along lineages of the plant phylogeny.
Table 2. Temporal trend of the three treatment investigated (N = 100 kg ha−1and G = 0 g a.i. ha−1; N = 25 kg ha−1and G = 360 g a.i. ha−1; N = 100 kg ha−1and G = 360 g a.i. ha−1).
Species richness, net relatedness index (NRI) and community weighted mean of SLA and CH were related to year of sampling using a linear model.
Estimate t p (a) Species richness
N100, G0 −0.981 −6.89 <0.0001 N25, G360 0.028 0.15 0.88 N100, G360 0.298 2.30 0.03 (b) NRI N100, G0 −0.236 −3.47 0.001 N25, G360 −0.354 −4.93 <0.0001 N100, G360 −0.275 −4.28 0.0001 (c) CWM SLA N100, G0 0.135 1.67 0.10 N25, G360 −0.430 −3.07 0.005 N100, G360 −0.053 −0.55 0.59 (d) CWM CH N100, G0 0.066 9.29 <0.0001 N25, G360 0.001 0.14 0.89 N100, G360 0.027 3.27 0.002 4. Discussion
Sound predictions of how communities and ecosystems will respond to global changes are needed to inform management of ecosystem services (Tilman1999, Carpenter et al 2009). Global change is the sum of many different factors that individ-ually or synergistically coerce changes in natural communities, and experimental approaches are needed to disentangle the complex myriad of effects on communities. Here, we demon-strated in an 11-year experiment that two global change factors, fertilizers and herbicide drifting into semi-natural habitats can have comparable effects on some community properties while divergent effect on others. Moreover, in contrast to previous studies (Helmus et al 2010, Wiens et al 2010), we show that those treatments increased the phylogenetic diversity of communities. Our study suggests that the task of predicting what will happen when plant communities are exposed to a complex cocktail of agrochemicals is perhaps even more complex than anticipated, because of the multiple synergetic and antagonistic effects that work in concert to shape communities Mitigating drift of agrochemicals into natural habitats is therefore a necessary precaution to preserve current biodiversity in communities and prevent shifts in unexpected directions.
Many agricultural crops depend on services provided by natural communities in proximity including pollination by insects that live nearby, or biocontrol agents, such as parasitic and predatory insects that decrease outbreaks of agricultural pests (Tilman1999). Recently, the ecosystem service concept has been applied to help derive specific protection goals for environmental risk assessment of agrochemicals (Nienstedt 4
Environ. Res. Lett. L Pellissier et al
Figure 1. (A) Phylogeny of the plant species at the experimental site and average cover of each of the plant taxonomic order comparing the control to the N = 100 kg ha−1treatment and to the G = 360 g a.i. ha−1(25%) treatment. In both cases, the treatment increases the cover diversity of taxonomic order and thus the phylogenetic diversity (i.e. corresponding to a decrease in NRI). Points colours correspond to the colours in the phylogeny. (B) Boxplots of the net relatedness index in relation to the three nitrogen and glyphosate treatments.
et al 2012). Our results, based on an 11-year experimental study, show that drift-level nitrogen and glyphosate promote directional changes in plant communities with a decrease of species richness in communities, an increase in phylogenetic diversity and shifts in functional structure of communities. In addition, we found a significant interaction term between treatments and this illustrates the complex antagonistic or synergistic response of communities to a cocktail of agrochem-ical. The maintenance of the plant communities providing ecosystem services at their current state may be challenged by agrochemical drift into adjacent natural habitats.
Increasing the intensity of environmental filtering through, e.g., the application of agrochemicals, is often expected to lead to a decrease in phylogenetic diversity of communities (Wiens et al 2010). In contrast to previous findings e.g. on zooplankton communities in north-temperate lakes (Helmus et al 2010), our results indicate that increased treatment levels increased the phylogenetic diversity of communities (figure 1). The influence of competitive exclusion and en-vironmental filtering on patterns of relatedness depends on the phylogenetic signal of traits contributing to niche and
competitive ability differences (Cavender-Bares et al2009). Here, both traits considered were influenced by fertilizers and herbicide but those traits were not specific to any particular lineage and showed low phylogenetic signal. Therefore, by selecting for phylogenetically labile traits that are distributed across the plant phylogenetic tree (i.e. convergent traits), the treatments likely indirectly increased the diversity of lineages in communities. Our results illustrate that the information obtained from community phylogenetic is depending on niche conservatism and taxonomic depth, where analyses at broad taxonomic scale may not provide expected lineage filtering under varying treatments (Swenson 2013). In addition, it is also expected that competitive exclusion for resources (e.g. under fertilization treatment) may lead to phylogenetic overdispersion as observed in our study depending on the degree of niche and competitive ability conservatism along the phylogeny (Mayfield and Levine 2010, Ndiribe et al 2013). However, even if clear expectations of phylogenetic dispersion in plant communities remain unclear, phylogenetic information may at least complementary results than those derived from a handful of traits (Swenson2013).
Environ. Res. Lett.9 (2014) 024016 L Pellissier et al
Figure 2. Boxplot of the species richness (A) as well as community weighted mean of SLA (B) and CH (C) in relation to the nitrogen and glyphosate treatments for the totality of plots collected in 2012. The treatments show opposite effects on the functional structure of plant communities.
Nitrogen fertilization promotes competitive species that exclude other species by increasing their cover, and thus lower species richness (Clark and Tilman2008). We found increased average SLA and CH in communities with nitrogen addition. At higher nitrogen levels slower growing species with lower
SLA were outcompeted by faster growing species, character-ized by high SLA (Wright et al2004), and by species that are able to place their leaves higher in the canopy. The shift in average values found in our plant community after application of the treatments might be due to competitive sorting the 6
Environ. Res. Lett. L Pellissier et al
Figure 3. Yearly trends in plant community properties measured with (A) the net relatedness index (NRI), (B) species richness and (C) SLA (specific leaf area) and (D) CH (canopy height) community weighted mean. The green dots represent the nitrate(N) = 100 kg ha−1and glyphosate(G) = 0 g a.i. ha−1treatment, the blue dots represent the N = 25 kg ha−1and G = 360 g a.i. ha−1treatment and the red dots represent the N = 100 kg ha−1and G = 360 g a.i. ha−1. The black line represents the average values for the control monitored in 2012. Summary statistics are found in table2. Because all plots were monitored only in 2012, while in 2005–2007, plant composition was monitored only in a subset of the plots, we investigated trends only for three treatments (N = 100 kg ha−1and G = 0 g a.i. ha−1; N = 25 kg ha−1and G = 360 g a.i. ha−1; N = 100 kg ha−1and G = 360 g a.i. ha−1).
species more able to use increased level of resources (Kunstler et al2012). Supporting this view, we found that an increase in nitrogen favoured species with high ‘competitive’ score (Grime1977, appendix S6 (available at stacks.iop.org/ERL/ 9/024016/mmedia)). Species survival and dominance may be driven by hierarchical differences in species’ competitive abili-ties correlated to species traits, so that competitive exclusion of inferior competitors promote the dominance of species sharing particular functional attributes (Chesson2000). While nitrogen increase promoted a shift in average SLA in communities toward high values, we found that taxa with leaves exhibiting higher values of SLA and CH were underrepresented in plots treated with glyphosate. This result suggests that plant species with large, thin and more palatable leaves as well as a higher canopy are more susceptible to glyphosate. Grime scoring indicated that those species were also more stress tolerant (Grime 1977). We speculate that this effect may be due to larger exposure and potentially greater uptake in those leaves,
while coriaceous leaves with a wax cover may have reduced uptake as glyphosate is readily soluble in water.
Our results reveal that fertilizers and herbicide drifting into natural communities have analogous effects on phyloge-netic diversity while opposite effects on functional structure. An increase in nitrogen promoted an increase in the average SLA and CH at the community level, but an increase in glyphosate promoted a decrease in those traits. In addition, investigated functional traits were not phylogenetically con-served, and when herbicide and fertilizer were applied to-gether, phylogenetic diversity of plant communities increased. The degree to which anthropogenic perturbations will shift the phylogenetic diversity of communities will ultimately depend on the phylogenetic conservatism or lability of plant traits conferring resistance to anthropogenic perturbations. Mitigat-ing drift of agrochemicals into natural habitats is therefore a necessary precaution to preserve current biodiversity in semi-natural communities at the border of agricultural fields
Environ. Res. Lett.9 (2014) 024016 L Pellissier et al and prevent shifts in unexpected directions thus impacting the
ecosystem services that are provided.
Author contributions: LP, BS and CD designed the re-search; LP, BS and CD collected the data; LP conducted the analyses; LP, MSW, BS, CD wrote the paper.
Acknowledgments
LP was supported by the Danish Council for Independent Research grant no 12-126430 and the grant ‘Felix Bonjour’ 2013 by the Soci´et´e Acad´emique Vaudoise. BS and CD were supported by The Danish Pesticide Research. This work originated in connection with a workshop for the TFI Networks ‘Effect Studies and Adaptation to Climate Change’ under Norforsk intiative (2011–2014).
References
Aude E, Tybirk K and Pedersen M B 2003 Vegetation diversity of conventional and organic hedgerows in Denmark Agricult. Ecosys. & Environ.99 135–47
Benton T G, Bryant D M, Cole L and Crick H Q P 2002 Linking agricultural practice to insect and bird populations: a historical study over three decades J. Appl. Ecol.39 673–87
Blomberg S P, Garland T and Ives A R 2003 Testing for phylogenetic signal in comparative data: behavioral traits are more labile Evolution 57 717–45
Boutin C and Jobin B 1998 Intensity of agricultural practices and effects on adjacent habitats Ecol. Appl.8 544–57
Bromham L 2009 Why do species vary in their rate of molecular evolution? Biol. Lett.5 401–4
Bruus Pedersen M, Aude E and Tybirk K 2004 Adskillelse af effekter af herbicider og kvælstof p˚a vegetation og leddyr i hegn og græslands vegetation Bekæmpelsesmiddelforskning fra Miljøstyrelsened Miljøstyrelsen, pp 103
Carpenter S R et al 2009 Science for managing ecosystem services: beyond the millennium ecosystem assessment Proc. Natl Acad. Sci. USA106 1305–12
Cavender-Bares J, Kozak K H, Fine P V A and Kembel S W 2009 The merging of community ecology and phylogenetic biology Ecol. Lett.12 693–715
Chamberlain D E, Fuller R J, Bunce R G H, Duckworth J C and Shrubb M 2000 Changes in the abundance of farmland birds in relation to the timing of agricultural intensification in England and Wales J. Appl. Ecol.37 771–88
Chesson P 2000 Mechanisms of maintenance of species diversity Ann. Rev. Ecol. Evol. Systematics31 343–66
Clark C M and Tilman D 2008 Loss of plant species after chronic low-level nitrogen deposition to prairie grasslands Nature
451 712–5
Coley P D, Bryant J P and Chapin F S 1985 Resource availability and plant antiherbivore defense Science230 895–9
Damgaard C, Solvejg K M and Per K 2008 Modeling effects of herbicide drift on the competitive interactions between weeds Environ. Toxicol. Chem.27 1302–8
Damgaard C, Strandberg B, Mathiassen S K and Kudsk P 2011 The combined effect of nitrogen and glyphosate on the competitive growth, survival and establishment of festuca ovina and agrostis capillaris Agricult. Ecosyst. Environ.142 374–81 de Bello F et al 2012 Functional species pool framework to test for
biotic effects on community assembly Ecology93 2263–73
Dinnage R 2009 Disturbance alters the phylogenetic composition and structure of plant communities in an old field system PLoS ONE4 e7071
Durka W and Michalski S G 2012 Daphne: a dated phylogeny of a large European flora for phylogenetically informed ecological analyses: ecological Archives E093-214 Ecology93 2297 Flynn D F B, Gogol-Prokurat M, Nogeire T, Molinari N,
Richers B T, Lin B B, Simpson N, Mayfield M M and DeClerck F 2009 Loss of functional diversity under land use intensification across multiple taxa Ecol. Lett.12 22–33 Fuller R J, Gregory R D, Gibbons D W, Marchant J H, Wilson J D,
Baillie S R and Carter N 1995 Population declines and range contractions among lowland farmland birds in Britain Conservation Biol.9 1425–41
Gotelli N and McCabe D J 2002 Species co-occurrence: a meta-analysis of J M Diamonds’s assembly rules model Ecology83 2091–6
Grime J P 1977 Evidence for the existence of three primary strategies in plants and its relevance to ecological and evolutionary theory Am. Naturalist111 1169–94 Grime J P 2006 Trait convergence and trait divergence in
herbaceous plant communities: mechanisms and consequences J. Vegetation Sci.17 255
Gove B, Power S A, Buckley G P and Ghazoul J 2007 Effects of herbicide spray drift and fertilizer overspread on selected species of woodland ground flora: comparison between short-term and long-term impact assessments and field surveys J. Appl. Ecol.
44 374–84
Helmus M R, Keller W, Paterson M J, Yan N D, Cannon C H and Rusak J A 2010 Communities contain closely related species during ecosystem disturbance Ecol. Lett.13 162–74
Isbell F, Tilman D, Polasky S, Binder S and Hawthorne P 2013 Low biodiversity state persists two decades after cessation of nutrient enrichment Ecol. Lett.16 454–60
Jensen A R, Spliid N H and Svensmark B 2007 Determination of volatilization (dissipation) and secondary deposition of pesticides in a field study using passive dosimeters Int. J. Environ. Anal. Chem.87 913–26
Jensen J E, Jensen P K, Nistrup Jørgensen L, Cordsen Nielsen G, Nielsen S F and Paaske K 2013 Vejledning I planteværn 2013 (Aarhus, Denmark: Landbrugsforlaget)
Keddy P 1992 Assembly and response rules: two goals for predictive community ecology J. Vegetation Sci.3 157–64 Kembel S W et al 2010 Picante: R tools for integrating phylogenies
and ecology Bioinformatics26 1463–4
Kleijn D and Snoeijing G I J 1997 Field boundary vegetation and the effects of agrochemical drift: botanical change caused by low levels of herbicide and fertilizer J. Appl. Ecol.34 1413–25 Kleyer M et al 2008 The LEDA Traitbase: a database of life-history
traits of the Northwest European flora J. Ecol.96 1266–74 Knapp S, K¨uhn I, Schweiger O and Klotz S 2008 Challenging urban
species diversity: contrasting phylogenetic patterns across plant functional groups in Germany Ecol. Lett.11 1054–64
Kunstler G, Lavergne S, Courbaud B, Thuiller W, Vieilledent G, Zimmermann N E, Kattge J and Coomes D A 2012 Competitive interactions between forest trees are driven by species’ trait hierarchy, not phylogenetic or functional similarity: implications for forest community assembly Ecol. Lett.15 831–40
Lalibert´e E and Shipley B 2013 Package ‘FD’, measuring functional diversity (FD) from multiple traits, and other tools for functional ecology
Environ. Res. Lett. L Pellissier et al Lambers H and Porter H 1992 Inherent variation in growth rate
between higher plants: a search for physiological causes and ecological consequences Adv. Ecol. Res. 23 188–261 Lavorel S and Garnier E 2002 Predicting changes in community
composition and ecosystem functioning from plant traits: revisiting the Holy Grail Funct. Ecol.16 545–56 Mayfield M M and Levine J M 2010 Opposing effects of
competitive exclusion on the phylogenetic structure of communities Ecol. Lett.13 1085–93
Nienstedt K M et al 2012 Development of a framework based on an ecosystem services approach for deriving specific protection goals for environmental risk assessment of pesticides Sci. Total Environ.415 31–8
Ndiribe C, Pellissier L, Antonelli S, Dubuis A, Pottier J, Vittoz P, Guisan A and Salamin N 2013 Phylogenetic plant community structure along elevation is lineage specific Ecol. Evol.3 4925–39 Pellissier L, Fiedler K, Ndribe C, Dubuis A, Pradervand J N,
Guisan A and Rasmann S 2012 Shifts in species richness, herbivore specialization, and plant resistance along elevation gradients Ecol. Evol.2 1818–25
Ronquist F and Huelsenbeck J P 2003 MRBAYES 3: Bayesian phylogenetic inference under mixed models Bioinformatics
19 1572–4
Smith S A and Donoghue M J 2008 Rates of molecular evolution are linked to life history in flowering plants Science322 86–9
Snoo G D and Poll R V 1999 Effect of herbicide drift on adjacent boundary vegetation Agricult. Ecosyst. Environ.73 1–6
Stevens C J, Dise N B, Mountford J O and Gowing D J 2004 Impact of nitrogen deposition on the species richness of grasslands Science303 1876–9
Storkey J, Meyer S, Still K S and Leuschner C 2012 The impact of agricultural intensification and land-use change on the European arable flora Proc. R. Soc. B279 1421–9
Swenson N G 2013 The assembly of tropical tree communities—the advances and shortcomings of phylogenetic and functional trait analyses Ecography36 264–76
Tilman D 1999 Global environmental impacts of agricultural expansion: the need for sustainable and efficient practices Proc. Natl Acad. Sci. USA96 5995–6000
Webb C O, Ackerly D D, McPeek M A and Donoghue M 2002 Phylogenies and community ecology Annu. Rev. Ecol. Evol. Syst.
33 475–505
Weiher E, Clarke G P and Keddy P A 1998 Community assembly rules, morphological dispersion, and the coexistence of plant species Oikos81 309–22
Wiens J J et al 2010 Niche conservatism as an emerging principle in ecology and conservation biology Ecol. Lett.13 1310–24 Wright I J et al 2004 The worldwide leaf economics spectrum