HAL Id: inserm-02771945
https://www.hal.inserm.fr/inserm-02771945
Submitted on 4 Jun 2020
HAL is a multi-disciplinary open access
archive for the deposit and dissemination of
sci-entific research documents, whether they are
pub-lished or not. The documents may come from
teaching and research institutions in France or
abroad, or from public or private research centers.
L’archive ouverte pluridisciplinaire HAL, est
destinée au dépôt et à la diffusion de documents
scientifiques de niveau recherche, publiés ou non,
émanant des établissements d’enseignement et de
recherche français ou étrangers, des laboratoires
publics ou privés.
The mechanisms shaping CA2 pyramidal neuron action
potential bursting induced by muscarinic acetylcholine
receptor activation
Vincent Robert, Ludivine Therreau, M. Felicia Davatolhagh, F. Javier
Bernardo-Garcia, Katie Clements, Vivien Chevaleyre, Rebecca Piskorowski
To cite this version:
Vincent Robert, Ludivine Therreau, M. Felicia Davatolhagh, F. Javier Bernardo-Garcia, Katie
Clements, et al.. The mechanisms shaping CA2 pyramidal neuron action potential bursting induced
by muscarinic acetylcholine receptor activation. Journal of General Physiology, Rockefeller University
Press, 2020, 152 (4), pp.e201912462. �10.1085/jgp.201912462�. �inserm-02771945�
ARTICLE
The mechanisms shaping CA2 pyramidal neuron
action potential bursting induced by muscarinic
acetylcholine receptor activation
Vincent Robert1, Ludivine Therreau1, M. Felicia Davatolhagh2, F. Javier Bernardo-Garcia3, Katie N. Clements4, Vivien Chevaleyre1, and
Rebecca A. Piskorowski1
Recent studies have revealed that hippocampal area CA2 plays an important role in hippocampal network function. Disruption
of this region has been implicated in neuropsychiatric disorders. It is well appreciated that cholinergic input to the hippocampus
plays an important role in learning and memory. While the effect of elevated cholinergic tone has been well studied in areas
CA1 and CA3, it remains unclear how changes in cholinergic tone impact synaptic transmission and the intrinsic properties of
neurons in area CA2. In this study, we applied the cholinergic agonist carbachol and performed on-cell, whole-cell, and
extracellular recordings in area CA2. We observed that under conditions of high cholinergic tone, CA2 pyramidal neurons
depolarized and rhythmically fired bursts of action potentials. This depolarization depended on the activation of M1 and M3
cholinergic receptors. Furthermore, we examined how the intrinsic properties and action-potential firing were altered in CA2
pyramidal neurons treated with 10 µM carbachol. While this intrinsic burst firing persisted in the absence of synaptic
transmission, bursts were shaped by synaptic inputs in the intact network. We found that both excitatory and inhibitory
synaptic transmission were reduced upon carbachol treatment. Finally, we examined the contribution of different channels to
the cholinergic-induced changes in neuronal properties. We found that a conductance from K
v7 channels partially
contributed to carbachol-induced changes in resting membrane potential and membrane resistance. We also found that
D-type potassium currents contributed to controlling several properties of the bursts, including firing rate and burst kinetics.
Furthermore, we determined that T-type calcium channels and small conductance calcium-activated potassium channels play
a role in regulating bursting activity.
Introduction
While hippocampal area CA2 was first described by Lorente de Nó >70 yr ago (de Nó, 1934), relatively little is known about the cellular properties of the neurons in this region. Recent studies using in vivo recording methods have revealed that neurons in area CA2 play potentially important roles in hippocampal net-work activity, including initiation of sharp wave ripples (Oliva et al., 2016) and spatial encoding during immobility (Kay et al., 2016). Lesion studies have found that synaptic transmission from area CA2 is required for social recognition memory (Hitti and Siegelbaum, 2014;Stevenson and Caldwell, 2014). Furthermore, there is mounting evidence that this area undergoes detrimental changes during schizophrenia (Benes et al., 1998;Piskorowski et al., 2016), Alzheimer’s disease (Ransmayr et al., 1989), Par-kinson’s disease (Liu et al., 2019), and other neuropsychiatric and neurodegenerative diseases (Chevaleyre and Piskorowski, 2016).
To understand the cellular mechanisms underlying these phenomena, the physiological properties of CA2 py-ramidal neurons (PNs) require further examination. There is mounting evidence indicating that these neurons have nu-merous physiological properties that are markedly different from neighboring CA1 and CA3. The calcium buffering and G protein–signaling cascades in these neurons have been shown to actively prevent the expression of stereotypical postsyn-aptic NMDA-mediated long-term potentiation (Simons et al., 2009;Vellano et al., 2011;Zhao et al., 2007). Additionally, CA2 PNs have been shown to have a very different composition of ion channels and dendritic excitability than neighboring re-gions (Palacio et al., 2017;Srinivas et al., 2017;Sun et al., 2014;
Dudek et al., 2016). CA2 PNs have also been shown to be modulated in the hippocampus by several neuromodulators,
...
1Universit´e Paris Descartes, Inserm UMR1266, Institute of Psychiatry and Neuroscience of Paris, Team Synaptic Plasticity and Neural Networks, Paris, France; 2Department of Neuroscience, Perelman School of Medicine, University of Pennsylvania, Philadelphia, PA; 3Department of Biochemistry and Biophysics, University of California San Francisco, San Francisco, CA; 4Department of Biology, East Carolina University, Greenville, NC.
Correspondence to Rebecca A. Piskorowski:rebecca.piskorowski@inserm.fr.
© 2020 Robert et al. This article is distributed under the terms of an Attribution–Noncommercial–Share Alike–No Mirror Sites license for the first six months after the publication date (seehttp://www.rupress.org/terms/). After six months it is available under a Creative Commons License (Attribution–Noncommercial–Share Alike 4.0 International license, as described athttps://creativecommons.org/licenses/by-nc-sa/4.0/).
including oxytocin (Tirko et al., 2018) and vasopressin (Pagani et al., 2015).
The septo-hippocampal cholinergic projection plays a critical role in hippocampal memory formation. Acetylcholine released from septal fibers acts as both a neurotransmitter and a modu-lator of cellular excitability and synaptic transmission in the hippocampus, thus having wide-ranging effects on hippocampal oscillatory dynamics and synaptic plasticity. In this study, we examined how intrinsic excitability and synaptic transmission are modulated in CA2 PNs under conditions of increased mus-carinic tone. We found that under conditions that approximately correspond to awake exploration in vivo (McIntyre et al., 2003;
Yamamura et al., 1974), CA2 PNs depolarize and rhythmically fire bursts of action potentials (APs). Activation of M1 and M3 muscarinic receptors is required for the depolarization. We found that excitatory and inhibitory synaptic inputs contributed to the shape and timing of these AP bursts. We observed that burst firing persisted when all synaptic transmission was blocked, indicating that activation of muscarinic acetylcholine receptors altered currents that underlie this phenomenon. To investigate this further, we identified the contribution of KV7
potassium channels, T-type calcium channels, D-type potassium channels and SK channels to the depolarization and bursting activity of CA2 PNs.
Materials and methods
All procedures involving animals were performed in accordance with institutional regulations.
Slice preparation
Transverse hippocampal slices were prepared from 6–9-wk-old Swiss mice. Animals were anaesthetized with ketamine (100 mg/kg), xylazine (7 mg/kg), and isofluorane and perfused transcardially with an NMDG-based cutting solution containing the following (in mM): NMDG 93, KCl 2.5, NaH2PO4 1.25,
NaHCO330, HEPES 20, glucose 25, thiourea 2, Na-ascorbate 5,
Na-Pyruvate 3, CaCl20.5, and MgCl210. Brains were then rapidly
removed, hippocampi were dissected and placed upright into an agar mold and cut into 400-µm-thick transverse slices (Leica VT1200S) in the same cutting solution at 4°C. Slices were transferred to an immersed-type chamber and maintained in artificial cerebral spinal fluid (ACSF) containing the following (in mM): NaCl 125, KCl 2.5, NaH2PO41.25, NaHCO326, glucose 10,
Na-pyruvate 2, CaCl22, and MgCl21. Slices were incubated at
32°C for∼20 min and maintained at room temperature for ≥45 min. Before recording, slices were transferred to a recording chamber allowing dual-sided perfusion with ACSF at 5 ml/min at 30°C.
Electrophysiological recordings
All on-cell and whole-cell recordings of CA2 PNs were per-formed blind. Area CA2 has extremely dense extracellular ma-trix, making visually guided recordings very challenging. A recording pipette with positive pressure was inserted deeply into the pyramidal cell layer parallel to the stratum so that the tip of the recording pipette was even with the end of the mossy
fibers. The pipette was then stepped deeper into the slice while a voltage step was delivered through the pipette. The current was monitored and used to determine when the pipette was close to a neuron; at that point, positive pressure was released, and a giga-ohm seal formed. Cell-attached recordings of CA2 PNs were obtained with ACSF in the recording pipette that had resistances between 2 and 5 MΩ. Whole-cell recordings were performed with potassium- or cesium-based intracellular solutions con-taining the following (in mM): K- or Cs-methyl sulfonate 135, KCl 5, EGTA-KOH 0.1, HEPES 10, NaCl 2, MgATP 5, Na2GTP 0.4,
Na2-phosphocreatine 10, and biocytin (4 mg/ml). Series
resis-tance was <20 MΩ and was monitored throughout the record-ings. Data were discarded if the series resistance changed >10% during the experiment. For synaptic response measurements in voltage-clamp mode, no compensation was applied. In current-clamp mode, the bridge balance was measured every 20 s, compensated with internal circuitry, and monitored throughout experiments as well as before and after gap-free recordings. The liquid junction potential was not corrected for. Data were ob-tained using a Multiclamp 700B amplifier and digitized using a Digidata 1550 ADDA board. Data were sampled at 10 kHz. pClamp10 software was used for data acquisition.
On-cell and whole-cell current clamp recordings of sponta-neous activity were acquired in gap-free mode in sweeps of 10 min. For measurements of intrinsic properties in current clamp mode, direct current (DC) was injected and monitored as necessary to maintain an initial membrane potential (VM) of−70
mV. AP firing properties were measured with a series of 1-s-long depolarizing current steps.
For voltage-clamp experiments examining evoked and spontaneous synaptic transmission, cesium internal solution was used. Stimulating pipettes filled with ACSF were placed in stratum radiatum of CA1 to antidromically excite CA3-CA2 synapses and in stratum lacunosum moleculare (SLM) to stim-ulate distal dendritic inputs in area CA2. Synaptic currents were evoked with a constant voltage stimulating unit (Digitimer) set at 0.1 ms at a voltage range of 5–30 V. For minimal stimulation experiments, synaptic responses were evoked by a patch pipette filled with ACSF placed at the same depth as the recording pi-pette in close proximity to the apical dendrite of the CA2 PN. The stimulus strength (2–10 V, 0.1 ms) was adjusted to elicit small-amplitude excitatory postsynaptic currents (EPSCs; <20 pA) with >10% failure. Extracellular field potentials were recorded with patch pipettes filled with 1 M NaCl placed in CA2 stratum radi-atum and SLM for detecting fEPSPs, or in the CA2 pyramidal layer for monitoring spontaneous activity. Pharmacological agents were added to the ACSF at the following concentrations (inμM): 10 carbamoylcholine chloride (CCh) to activate cho-linergic receptors; 10 2,3-dihydroxy-6-nitro-7-sulfamoyl-benzo [f]quinoxaline (NBQX) and 50 D-2-amino-5-phosphonovalerate (APV) to blockα-amino-3-hydroxy-5-methyl-4-isoxazolepropionic acid (AMPA), NMDA, and kainic acid receptors; 1 SR95531 and 2 CGP55845A to blockγ-aminobutyric acid (GABAAand GABAB)
receptors; 10 XE-991 (10,10-bis[4-Pyridinylmethyl]-9[10H]-an-thracenone dihydrochloride) to block the M current; 2 TTA-A2 ([R]-2-[4-cyclopropylphenyl]-N-[1-[5-[2,2,2-trifluoroethoxy] pyridin-2-yl]ethyl] acetamide) to block T-type voltage-gated
calcium channels; 100 4-aminopyridine (4-AP) to block voltage-activated potassium currents; 0.1 α-dendrotoxin (⍺-DTX) to block D-type potassium currents; 0.1 apamin to block small-conductance calcium-activated potassium (SK) channels; 10 pirenzepine to block M1 muscarinic receptors; 10 AF-DX 116 to block M2 muscarinic receptors; 1 1,1-dimethyl-4-diphenylace-toxypiperidinium iodide (4-DAMP) to block M3 muscarinic receptors; 10 mecamylamine to block nicotinic acetylcholine receptors (nAChRs); and 0.1 tetrodotoxin (TTX) to block voltage-activated sodium channels. Voltage clamp recordings of miniature excitatory postsynaptic currents (mEPSCs) were performed with 100 nM TTX and 4 mM CaCl2in ACSF.
Immunochemistry and cell identification
Post hoc confirmation of all cells was performed by reconstruction of neuronal morphology. Following overnight incubation in 4% paraformaldehyde in PBS, slices were permeabilized with 0.2% Triton X-100 in PBS and blocked for 48 h with 3% goat serum in PBS with 0.2% Triton X-100. Alexa Fluor 546–conjugated strep-tavidin (Life Technologies, dilution 1:300) incubation was per-formed in block solution for 4 h at room temperature. Slices were mounted in prolong diamond mounting medium, resulting in a partial clarification of tissue following incubation at room tem-perature for 24 h. Images were collected with a Zeiss 710 laser-scanning confocal microscope.
Data analysis
Electrophysiological recordings were analyzed using custom-written macros with IGORpro (Wavemetrics) and Axograph software. APs were detected automatically by threshold crossing with IGOR TaroTools, followed by visual inspection to define AP bursts. In all whole-cell recordings, bursts were defined by clear depolarization and repolarization of the VMflanking AP firing.
For analysis of cell-attached data, bursts were defined based on the shortest bursts with lowest interburst interval seen in whole-cell recordings. This was defined as groups of ≥2 APs occurring <1 s apart from one another and separated from other groups of APs by≥1 s. While this definition is broad, we used it to avoid constraining the analysis of cell-attached data. Kinetics of VMvariations were measured by linear fits of the VMtrace as it
changed during the initial depolarization following CCh appli-cation, and from interburst-VMplus 5 mV to burst-VMminus 5
mV. Membrane resistance (RM) measurements were calculated
from linear fits of the voltage responses to current step in-jections. AP firing properties were measured on a positive cur-rent step 1.5 times over rheobase causing similar VM
depolarization for each cell and condition, typically 200 pA over rheobase. The threshold was measured at the first AP at rheobase. The AP full-width at half-maximal amplitude (AP width) and af-terhyperpolarizing potential (AHP) amplitude were measured for the first AP at threshold. The latency of the first AP and number of APs was measured with increasing current steps over rheobase. The instantaneous firing frequency and amplitude of the first six APs were measured at current injection steps 1.5 times over rheobase. The amplitude of the after-depolarization (ADP) was measured 125 ms after step termi-nation of a current 1.5 times over rheobase. Sag potentials
were measured with a protocol injecting current as necessary to maintain a VMof−70 mV with a 1-s-long negative current
step resulting in a membrane hyperpolarization of−100 mV. The sag was calculated as the difference between the peak and steady-state voltage during the 1-s hyperpolarization. Statistics
Results are reported as means ± SEM. Statistical significance of linear variables was assessed using paired or unpaired Student’s t test, one-sample t test, Mann–Whitney U test, Wil-coxon signed-rank test, Kruskal–Wallis test, one-way ANOVA, repeated-measures ANOVA, or Friedman ANOVA where ap-propriate. Normality was tested with the Jarque–Bera test, and homoscedasticity was tested using Barlett’s test to choose be-tween parametric and nonparametric statistical analysis. The marks *, **, and *** denote P values <0.05, <0.01, and <0.001, respectively.
Results
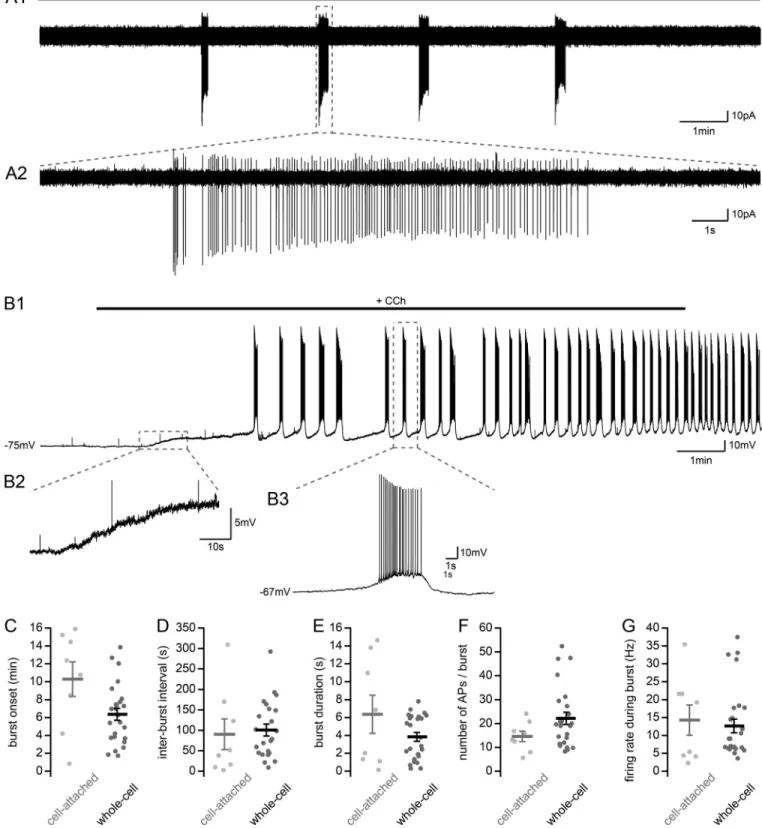
Carbachol induces depolarization and AP bursting in CA2 PNs Modulation of hippocampal neuronal activity by cholinergic agonists has been extensively described for PNs in areas CA3 and CA1. However, little is known about how activity in area CA2 is affected by increased muscarinic tone. To answer this question, we performed on-cell electrophysiological recordings in CA2 PNs in acute hippocampal slices from adult mice and monitored how the activity of the cells changed upon the ap-plication of 10 µM carbachol (CCh). This compound is the car-bamate analogue of acetylcholine, allowing it to resist hydrolysis by acetylcholinesterase, and is a nonselective agonist for mus-carinic acetylcholine receptors and a weaker nonselective agonist for nAChRs in the brain. We found that before CCh ap-plication, only 1 of 15 cells spontaneously fired APs. Following application of 10 µM CCh, 8 of 15 cells displayed regularly re-peating bursts of APs (Fig. 1, A1 and A2). Within each burst, the cells fired 14.6 ± 2.2 APs at a frequency of 14.3 ± 4.2 Hz. Each burst lasted 6.4 ± 2.1 s, with an interburst interval of 90 ± 38 s. The spontaneous rhythmic firing of bursts of APs that we observed in area CA2 are similar to previous reports of CA3 PNs following application of CCh (MacVicar and Tse, 1989;Williams and Kauer, 1997;Cobb et al., 1999;Cobb and Davies, 2005). We postulated that high muscarinic tone may be causing a change in the resting VMin CA2 PNs, as has previously been reported in
area CA3 (Dodd and Kelly, 1981; Cobb et al., 1999;Cobb and Davies, 2005) and in CA2 pyramidal cells in slice cultures (Fischer, 2004). To answer this question, we performed whole-cell current clamp recordings before and after bath-application of 10 µM CCh. Upon CCh application, we observed a depolari-zation of CA2 PN VMfrom rest at−75 ± 1.1 mV to −65 ± 1.0 mV
(Fig. 1, B1–B3; n = 29; paired t test, P < 0.001). CCh application caused VMdepolarization at a rate of 6.0 ± 0.7 mV/min (n = 29)
before reaching a steady-state level. This depolarization was followed by rhythmic bursts of AP firing in 25 of 29 cells, with properties similar to those we observed in cell-attached re-cordings. We restricted the analysis of our whole-cell data to 15 min following CCh application because the on-cell data from
Figure 1. Carbachol application induces VMdepolarization and burst firing in CA2 PNs. (A1) Sample trace of AP bursts recorded in cell-attached con-figuration from a putative CA2 PN following application of 10 µM CCh in acute hippocampal slice. (A2) Expanded view of a single burst of APs. (B) Sample trace of bursts recorded in whole-cell current-clamp configuration from a CA2 PN upon application of 10 µM CCh in acute hippocampal slice (B1) and expanded views of the VMinitial depolarization (B2) and a burst of APs (B3). (C–G) Summary graphs of burst properties recorded in cell-attached (gray, n = 8) and whole-cell current-clamp (black, n = 25) configuration from CA2 PNs with application of 10 µM CCh (individual cells shown as dots; population averages shown as thick lines; error bars represent SEM). (C) Bursting onset attached, 10.3 ± 1.9 min; whole-cell, 6.4 ± 0.7 min; t test, P = 0.088). (D) Interburst interval (cell-attached, 90 ± 38 s; whole-cell, 100 ± 14.7 s; t test, P = 0.80). (E) Burst duration (cell-(cell-attached, 6.4 ± 2.1 s; whole-cell, 3.8 ± 0.5 s; Mann–Whitney U test, P = 0.48). (F) Number of APs per burst (cell-attached, 14.6 ± 2.2; whole-cell, 22 ± 2.5; Mann–Whitney U test, P = 0.17). (G) Firing rate during burst (cell-attached, 14.3 ± 4.2 Hz; whole-cell, 12.6 ± 1.9 Hz; Mann–Whitney U test, P = 0.71).
bursting cells showed that cells would burst during this time window. Furthermore, we wanted to avoid variation of cellular properties due to dialysis of the cytoplasm from whole-cell re-cording conditions. The fraction of bursting cells recorded in cell-attached (n = 8/15) and whole-cell (n = 25/29) configurations were not statistically different (chi-square test, P = 0.127). Bursting occurred 10.3 ± 1.9 min (n = 8) after CCh application in cell-attached mode and after 6.4 ± 0.7 min (n = 25) in whole-cell recordings (Fig. 1 C). Bursts occurred with an interburst interval of 100 ± 14.7 s (Fig. 1 D) and lasted 3.8 ± 0.5 s (Fig. 1 E). During these bursts, CA2 PNs fired 22 ± 2.5 APs paced at 12.6 ± 1.9 Hz (Fig. 1, F–G). Importantly, none of the measurements reported above differed between cell-attached and whole-cell conditions, thus validating our approach. Following each burst of AP-firing, the VMreturned to an interburst potential that was significantly
more depolarized than before CCh application of−62.3 ± 0.8 mV (paired t test, P < 0.001).
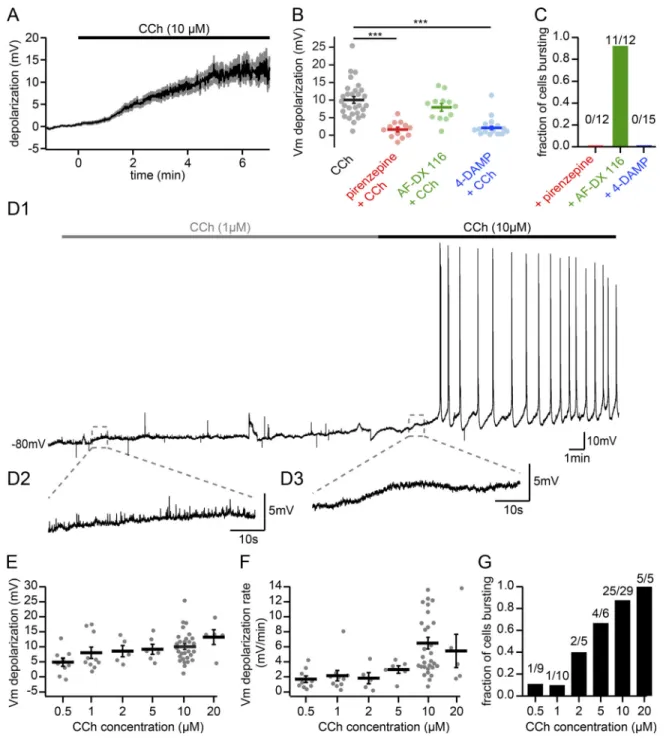
We further studied the CCh-induced initial depolarization seen in whole-cell recordings before bursting. 10 µM CCh de-polarized CA2 PN VMwithin minutes of application (Fig. 2 A, n =
25 cells that subsequently fired bursts of APs;Fig. 2 B, n = 29 cells recorded in 10 µM CCh). This depolarization of the VMfollowing
application of 10 µM CCh is likely acting via mAChRs, G-protein coupled metabotropic receptors that are expressed in the soma, dendrites, and axonal terminals of hippocampal PNs (Pitler and Alger, 1990;Levey et al., 1995). We found that with prior ap-plication of 10 µM pirenzepine, which will preferentially act on M1 receptors with partial antagonism of M3 receptors, CCh application resulted in a minor membrane depolarization of 1.6 ± 0.7 mV that was significantly lower than the 10.0 ± 0.9 mV depolarization observed in CCh alone (Fig. 2 B). Further, appli-cation of 10 µM AF-DX 116, an M2 receptor antagonist, had no significant effect on the CCh-induced depolarization (Fig. 2 B; 7.7 ± 1.1 mV). Application of 1 µM 4-DAMP, which should primarily act on M3 mAChRs but also a fraction of M1 mAChRs, also effectively prevented CCh-induced depolarization, resulting in a small de-polarization (Fig. 2 B; 2.1 ± 0.5 mV). Consequently, CCh-induced AP bursting of CA2 PNs was blocked by pirenzepine and 4-DAMP but not by AF-DX 116 (Fig. 2 C). These results were consistent with the Gq/11-coupled action of M1 and M3 receptors, which is known
to inhibit potassium permeability, leading to membrane depo-larization (Brown and Adams, 1980).
Next, we explored the dose-dependent effects of CCh on CA2 PNs and performed experiments with CCh concentrations ranging from 0.5 to 20 µM (Fig. 2, D1–D3). These experiments showed that, although application of 10 µM CCh robustly de-polarized CA2 PNs, CCh concentrations as little as 0.5 µM sig-nificantly depolarized CA2 PNs (Fig. 2, E and F). However, AP bursts were observed consistently with CCh concentrations of≥10 µM (Fig. 2 G). While burst firing was observed with lower concentrations, these occurred in only a fraction of ex-periments. Measurements of acetylcholine that have been performed in the hippocampus in vivo indicate that the con-centration of acetylcholine during awake exploration is in the range of 0.5–1 µM (10–20 pmol acetylcholine/20 µl CSF;
McIntyre et al., 2003). Because CCh affinity for mAChRs is 10-fold lower than that of acetylcholine (Yamamura et al., 1974),
and because 10 µM CCh falls within this physiological range and consistently provokes bursts of AP firing, we used this concentration for the rest of the study.
To better understand how CA2 PN intrinsic properties and AP firing are altered by muscarinic tone, we performed whole-cell current clamp experiments. Current step injections before and after 10 µM CCh application revealed that many aspects of CA2 PN intrinsic properties and AP firing behavior were mod-ified by CCh (Fig. 3, A1–A4). For these experiments, we took care
to inject DC as necessary to maintain an initial VMof−70 mV.
First, we found that CCh application significantly increased CA2 PN RMfrom 42 ± 2.8 to 90 ± 8.0 MOhm (Fig. 3 B). We examined
several aspects of AP firing. We observed an increased AP threshold, from−47.0 ± 0.9 to −44.0 ± 0.8 mV (Fig. 3 C). Fur-thermore, we saw a decreased AP width, from 1.13 ± 0.04 to 1.02 ± 0.04 ms (Fig. 3 D), and an increased AHP from 6.2 ± 0.6 to 8.3 ± 0.4 mV (Fig. 3 E). In addition, the latency of first AP firing during a step was increased following CCh application, from 83 ± 11 to 156 ± 15 ms. The latency was compared at a current injection step 200 pA over rheobase (Fig. 3 F). At the same current injection, the number of APs per step also increased from 5.0 ± 0.5 to 11.9 ± 1.1 (Fig. 3 G). This increase is consistent with a decrease in AP duration and increase in AHP. CCh application also resulted in increased instantaneous AP frequency, which was measured from the first and second AP, from 15.9 ± 1.8 to 19.6 ± 2.1 Hz (Fig. 3 H). With this, we noticed that CCh prevented adaptation of AP firing frequency with increasing current injection steps. We measured a decreased AP amplitude, from 77.5 ± 1.4 to 71.1 ± 2.4 mV, following CCh application (Fig. 3 I). Following the ter-mination of current steps eliciting AP firing, we observed an increased ADP of 7.0 ± 0.9 mV in CCh compared with 1.6 ± 0.3 mV in ACSF (Fig. 3, J and K). Finally, we observed that the sag potential measured following a hyperpolarizing step to−100 mV in CA2 PNs was increased by CCh application from 1.6 ± 0.1 mV to 4.5 ± 0.5 mV (Fig. 3, L and M). These results suggest that several conductances are modulated by CCh in CA2 PNs. CA2 PN AP bursts are shaped by synaptic inputs
Muscarinic AChR activation has been shown to alter both syn-aptic transmission and ionic conductances that regulate intrinsic excitability in PNs and interneurons (Cobb and Davies, 2005;
McQuiston, 2014). In area CA3, many of the properties of rhythmic burst-firing have been shown to be shaped by changes in the local inhibitory and recurrent excitatory network (Williams and Kauer, 1997;McMahon et al., 1998). For area CA2, the effect of CCh on both the local network activity and intrinsic properties has never been examined. To better understand the CCh-induced spontaneous activity in area CA2, we set out to evaluate the contribution of synaptic input to several properties of spontaneous AP bursting (Fig. 4 A). First, we assessed the contribution of excitatory transmission in CA2 PN bursting by blocking fast glutamatergic transmission with 10 µM NBQX and 50 µM APV. We saw that under these conditions, CA2 PNs continued to burst (Fig. 4, A2). We observed a significantly shorter interburst interval (Fig. 4 BandTable 1) and postulate that this is due to the significantly more depolarized VMbetween
bursts (Fig. 4 Gand Table 1). Furthermore, with the block of
Figure 2. Depolarization of CA2 PN resting VMby CCh. (A) Time course of the initial VMdepolarization leading to bursting onset following 10 µM CCh application (n = 25; population average shown as black line; gray region represents SEM). (B) Summary graph of VMdepolarization before and after application of 10 µM CCh in control conditions or with muscarinic acetylcholine receptors M1, M2, or M3 blocked by 10 µM pirenzepine, 10 µM AF-DX 116, or 1 µM 4-DAMP, respectively. The depolarization induced by CCh (black, n = 29) was significantly reduced by pirenzepine (red, Mann–Whitney U test, p < 0.001, n = 12) and 4-DAMP (blue, Mann–Whitney U test, P < 0.001, n = 15) but not by AF-DX 116 (green, Mann–Whitney U test, P = 0.185, n = 12; individual cells shown as dots; population averages shown as thick lines; error bars represent SEM). ***, P < 0.001. (C) Fraction of cells that burst following application of 10 µM CCh and in the presence of pirenzepine, AF-DX 116, or 4-DAMP (chi-squared test, P < 0.001). (D) Sample trace recorded in whole-cell current-clamp configuration from a CA2 PN (D1) and expanded view showing a small VMdepolarization without bursts during application of 1 µM CCh followed by further depolarization (D2) and AP bursts upon subsequent increased CCh concentration to 10 µM in acute hippocampal slice (D3). (E–G) Summary graphs of the initial VM de-polarization and subsequent bursting as a function of increasing CCh concentrations (0.5 µM, n = 9; 1 µM, n = 10; 2 µM, n = 5; 5 µM, n = 6; 10 µM, n = 29; 20 µM, n = 5; individual cells shown as dots; population averages shown as thick lines; error bars represent SEM). (E) Initial VMdepolarization induced by CCh (one-sample t tests: 0.5 µM, P = 0.0079; 1 µM, P = 0.0022; 2 µM, P = 0.010; 5 µM, P = 0.0026; 10 µM, P < 0.001; 20 µM, P = 0.0056). (F) Initial VMdepolarization rate during CCh application. (G) Fraction of cells bursting during CCh application (chi-square test, P = 0.002).
excitatory transmission, we observed a significant decrease in the number of APs per burst (Fig. 4 DandTable 1), indicating that synaptic input from CA2 and CA3 PNs plays a significant role in the spontaneous activity. A possible consequence of blocking excitatory transmission is that less sustained AP firing during bursts would cause a decrease in activation of hyper-polarizing conductances, potentially leading to reduced repo-larization of CA2 PN VMfollowing bursts.
Area CA2 has been shown to have a very high density of interneurons with unique morphologies and axonal projection patterns (Mercer et al., 2007, 2012; Botcher et al., 2014). To assess the contribution of the local inhibitory network to CCh-induced CA2 PN spontaneous AP bursting, we blocked all GABAA
and GABAB receptors by applying 1 µM SR95531 and 2 µM
CGP55845A. We observed several notable changes following CCh application under these conditions. The burst duration was significantly shorter (Fig. 4 CandTable 1) resulting in a trend for less AP fired per burst (Fig. 4 DandTable 1), although the firing rate during a burst was significantly higher (Fig. 4 EandTable 1) than in control conditions with GABAergic transmission intact. Furthermore, the rate of depolarization preceding a burst, burst rise rate, was significantly faster (Fig. 4 HandTable 1) and the rate at which the VMhyperpolarized following a burst, the burst
decay rate, tended to be faster, although the difference was not significant (Fig. 4 I and Table 1). Our interpretation of these results is that local inhibition is acting to pace AP firing during bursts in CA2 PNs in the presence of CCh. Furthermore, the local field potential (LFP) recorded nearby in the pyramidal layer of area CA2 bore signatures of epileptiform-like events (Fig. 4A3). These events consisted of brief (0.8 ± 0.3 s, n = 5) bursts of 3.3 ± 1.3
Figure 3. Modification of CA2 PN intrinsic properties by CCh. (A) Sample traces of AP firing in response to depolarizing current step injections re-corded in whole-cell current-clamp configuration from a CA2 PN in control (A1, gray) and 10 µM CCh (A2, black), expanded view of the first AP in each condition (A3) and corresponding phase plane plot (A4). (B–I) Summary graphs of CA2 PNs AP firing properties in control (gray) and 10 µM CCh (black; individual cells shown as thin lines, population averages shown as thick lines, error bars represent SEM). (B) RM(before CCh, 42 ± 2.8 MOhm; after CCh, 90 ± 8.0 MOhm; Wilcoxon signed-rank test, P < 0.001, n = 26). (C) AP threshold (before CCh,−47.0 ± 0.9 mV; after CCh, −44.0 ± 0.8 mV;
Wilcoxon signed-rank test, P = 0.017, n = 34). (D) AP width at half-maximal amplitude (before CCh, 1.13 ± 0.04 ms; after CCh, 1.02 ± 0.04 ms; Wilcoxon signed-rank test, P = 0.005, n = 34). (E) AHP (before CCh, 6.2 ± 0.6 mV; after CCh, 8.3 ± 0.4 mV; Wilcoxon signed-rank test, P = 0.002, n = 29). (F) Latency to fire first AP per current step as a function of current injection over rheo-base (200 pA over rheorheo-base, before CCh, 83 ± 11 ms; after CCh, 156 ± 15 ms; Wilcoxon signed-rank test, P < 0.001, n = 34). (G) Number of APs fired per current step as a function of current injection over rheobase (200 pA over rheobase, before CCh, 5.0 ± 0.5; after CCh, 11.9 ± 1.1; Wilcoxon signed-rank test, P < 0.001, n = 34). (H) Instantaneous firing frequency of APs as a func-tion of AP number during a current step of intensity chosen 1.5 times above rheobase (first couple of APs, before CCh, 15.9 ± 1.8 Hz; after CCh, 19.6 ± 2.1 Hz; Wilcoxon signed-rank test, P = 0.027, n = 31). (I) AP amplitude as a function of AP number during a current step of intensity chosen 1.5 times above rheobase (first AP, before CCh, 77.5 ± 1.4 mV; after CCh, 71.1 ± 2.4 mV; paired t test, P = 0.020, n = 29). (J) Sample traces of the ADP following a depolarizing current step injection in a CA2 PN recorded in whole-cell current-clamp configuration in control (gray) and 10 µM CCh (black). (K) Summary graph of CA2 PNs ADP in control (gray) and 10 µM CCh (black; before CCh, 1.6 ± 0.3 mV; after CCh, 7.0 ± 0.9 mV; paired t test, P < 0.001, n = 34; individual cells shown as thin lines; population averages shown as thick lines; error bars represent SEM). (L) Sample traces of voltage sag in response to hyperpolarizing current step injections recorded in whole-cell current-clamp configuration from a CA2 PN in control (gray) and 10 µM CCh (black). (M) Summary graph of CA2 PN voltage sag following hyperpolarization to −100 mV in control ACSF (gray) and 10 µM CCh (black; before CCh, 1.6 ± 0.1 mV; after CCh, 4.5 ± 0.5 mV; Wilcoxon signed-rank test, P < 0.001, n = 31; individual cells shown as thin lines; population averages shown as thick lines; error bars represent SEM). *, P < 0.05; **, P < 0.01; ***, P < 0.001.
synaptic potentials with superimposed population-spike-like sig-nals. We detected these events in five of six CA2 PNs recorded in the presence of GABA blockers. In these PNs, epileptiform-like discharges accompanied 70 ± 8% of the AP bursts, which they tended to precede by 32 ± 12 ms. Our interpretation of this activity is that with inhibitory transmission blocked, PNs in the network undergo AP bursting that is not regulated by feed-forward and
feedback inhibition. Hypersynchrony likely emerges in the net-work, leading to very short and sudden bursts of APs instead of paced activity.
When we blocked all excitatory and inhibitory synaptic transmission (Fig. 4, A4–I), we saw that following CCh
applica-tion, the spontaneous rhythmic bursts of CA2 PNs were very similar to what we observed with NBQX and APV with only the
Figure 4. Contribution of synaptic transmission to CCh-induced AP burst firing in CA2 PNs. (A) Sample trace of bursts recorded in whole-cell current-clamp configuration from a CA2 PN upon application of 10 µM CCh in acute hippocampal slice in control condition (A1, 10 µM CCh, black) or application of 10 µM NBQX and 50 µM APV (A2, red); 1 µM SR95531 and 2 µM CGP5584A (A3, green); and 10 µM NBQX, 50 µM APV, 1 µM SR95531, and 2 µM CGP5584A (A4, gray). A3 shows an additional trace of an epileptiform-like discharge recorded in CA2 stratum pyramidale (LFP, lower trace). (B–I) Summary graphs of burst characteristics with application of 10 µM CCh in control (black, n = 25; same CCh data shown in B–E as whole-cell data inFig. 1, D–G, respectively); 10 µM NBQX and 50 µM APV (red, n = 7); 1 µM SR95531 and 2 µM CGP5584A (green, n = 6); and 10 µM NBQX, 50 µM APV, 1 µM SR95531, and 2 µM CGP5584A (gray, n = 6; individual cells shown as dots; population averages shown as thick lines; error bars represent SEM). (B) Interburst interval (Kruskal–Wallis test, P = 0.006). (C) Burst duration (Kruskal–Wallis test, P = 0.037). (D) Number of APs per burst (Kruskal–Wallis test, P = 0.008). (E) AP firing frequency during bursts (Kruskal–Wallis test, P = 0.012). (F) VMlevel during bursts (one-way ANOVA, P = 0.41). (G) VMlevel in between bursts (one-way ANOVA, P < 0.001). (H) VM depolarization rate during the burst rising phase (Kruskal–Wallis test, P < 0.001). (I) VMrepolarization rate during the burst decaying phase (Kruskal–Wallis test, P = 0.087). *, P < 0.05; **, P < 0.01.
interburst-VM, interburst intervals and number of APs per burst
different from control conditions (Fig. 4, B, D, and G;Table 1). Thus, while the CA2 PN AP bursting activity is shaped by both excitatory and inhibitory synaptic input, the intrinsic conduc-tance of these neurons permits them to undergo rhythmic bursts of AP firing in the presence of 10 µM CCh.
CCh affects transmission onto CA2 PNs
High cholinergic tone has been shown to suppress synaptic trans-mission in the hippocampus in a laminar-selective way (Hasselmo and Schnell, 1994). These observations form a basis for computa-tional models describing cholinergic modulation of hippocampal networks during learning. As this has never been explored in area CA2, and because we found that synaptic transmission shapes burst firing, we decided to examine how excitatory and inhibitory transmission is altered in this area by recording synaptic responses before and after application of 10 µM CCh.
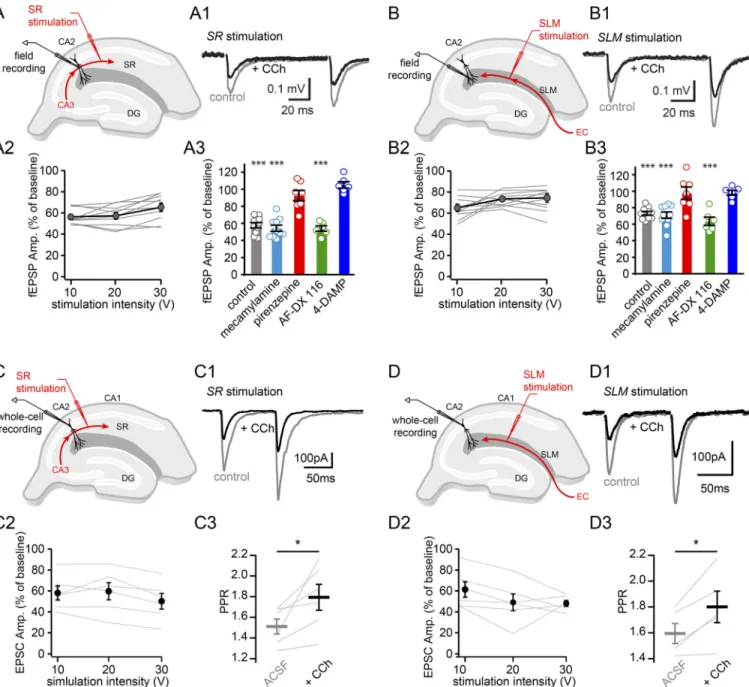
Our first strategy was to use extracellular field recordings to examine evoked excitatory synaptic transmission in area CA2 at proximal inputs in stratum radiatum as well as distal inputs in (SLM in the presence of GABA receptor blockers (Fig. 5, A and B). We observed that application of 10 µM CCh reduced fEPSP amplitudes at both proximal (Fig. 5, A1–A3) and distal (Fig. 5, B1–B3) inputs. The reduction in fEPSP at stratum radiatum was
larger than that measured in SLM, and this difference was sta-tistically significant (P = 0.0079, two-way ANOVA, repeated measure). These results are very similar to what has been ob-served in areas CA1 (Hasselmo and Schnell, 1994) and CA3 (Kremin and Hasselmo, 2007).
We postulate that the application of 10 µM CCh is likely acting on CA2 PNs via activation of mAChRs. Our finding that application of the M1 and M3 receptor antagonists, pirenzepine and 4-DAMP, prevents the large membrane depolarization, and AP bursting supports this conclusion. However, in the hippo-campus, nAChRs have been found to be located at both pre- and postsynaptic compartments and can modulate glutamatergic transmission (McGehee et al., 1995; Halff et al., 2014). To explore a possible contribution of nAChR participation in syn-aptic transmission in area CA2, we applied 10 µM of the nAChR blocker mecamylamine and measured the resulting CCh-induced decrease in synaptic transmission at stratum radiatum (Fig. 5A3) and SLM (Fig. 5B3) inputs. We found that blocking nAChRs had no impact on the CCh-induced reduction in synaptic transmis-sion, indicating that these receptors are likely not contributing to the CCh-induced change in synaptic transmission as it is being measured here.
As shown inFig. 2 B, application of M1/M3 mAChR antagonists prevented CCh-induced membrane depolarization. To determine
Table 1. Effect of synaptic transmission on charbachol-induced CA2 PN spontaneous activity Measurement Control (n = 25)a Excitatory transmission
blocked (n = 7)b Inhibitory transmission blocked (n = 6)c Excitatory and inhibitory transmission blocked (n = 6)d Statistics
ACSF-VMbefore CCh application (mV) −75 ± 1.2 −72 ± 3.1 −80 ± 1.9 −70 ± 4.1 P = 0.054e CCh-VM(mV) −64 ± 1.0 −62 ± 2.1 −64 ± 1.5 −57 ± 2.9f P = 0.036e ΔACSF-CChVM(mV) 11 ± 1.0 9.5 ± 1.5 16 ± 1.9 13 ± 1.4 P = 0.065e Depolarization rate (mV/min) 6.5 ± 0.8 9.2 ± 3.4 9.4 ± 2.3 8.6 ± 2.0 P = 0.52g Burst onset (min) 6.4 ± 0.7 4.6 ± 1.8 4.7 ± 1.2 3.5 ± 0.6 P = 0.21e Interburst interval (s) 100 ± 14.7 36 ± 8.3h 113 ± 41.9 36 ± 5.6h P = 0.006g Burst-VM(mV) −42 ± 1.0 −36 ± 1.6 −42 ± 2.2 −40 ± 3.2 P = 0.41e Interburst-VM(mV) −62 ± 0.8 −56 ± 1.4i −63 ± 1.9 −56 ± 1.1j P < 0.001e Δburst-IBIVM(mV) 21 ± 1.2 18 ± 2.6 22 ± 3.7 14 ± 2.3 P = 0.11e Burst rise rate (mV/s) 3.5 ± 0.5 5.9 ± 1.1 59 ± 26h 3.6 ± 0.6 P < 0.001g Burst decay rate (mV/s) −4.6 ± 0.8 −4.3 ± 0.7 −13.7 ± 4.0 −4.8 ± 0.6 P = 0.087g Burst duration (s) 3.8 ± 0.5 2.6 ± 0.7 1.1 ± 0.3h 2.4 ± 0.6 P = 0.037g Number of APs/burst 22 ± 2.5 11 ± 1.8h 13 ± 2.3 11 ± 2.5h P = 0.008g Firing frequency in burst (Hz) 13 ± 1.9 9.5 ± 1.4 36 ± 7.9h 9.7 ± 4.5 P = 0.012g a10 µM CCh.
b10 µM CCh, 10 µM NBQX, and 50 µM APV. c10 µM CCh, 1 µM SR95531, and 2 µM CGP5584A.
d10 µM CCh, 10 µM NBQX, 50 µM APV, 1 µM SR95531, and 2 µM CGP5584A. eOne-way ANOVA.
fP = 0.025 vs. CT; Tukey post hoc test. gKruskal–Wallis test.
hP < 0.05 vs. CT; Dunn–Holland–Wolfe post hoc test. iP = 0.001 vs. CT; P = 0.013 vs. SR; Tukey post hoc test. jP = 0.006 vs. CT; P = 0.033 vs. SR; Tukey post hoc test.
Figure 5. CCh attenuates excitatory synaptic transmission onto CA2 PNs. (A) Diagram illustrating extracellular recording configuration with recording and stimulation electrodes in stratum radiatum. (A1) Sample traces of field responses to electrical stimulation of stratum radiatum input to area CA2 before (gray) and after (black) 10 µM CCh application in the presence of GABA receptor antagonists (1 µM SR95531 and 2 µM CGP5584A). (A2) Summary graph of the proportion of control response amplitude (Amp.) remaining in stratum radiatum after CCh with increasing stimulation intensities (n = 10). (A3) Summary graph of the proportion of fEPSP amplitude remaining with 20-V stimulation in stratum radiatum after application of 10 µM CCh alone (control, gray; n = 10, 57.2 ± 2.5%, one-sample t test, P = 2.8 × 10⁻⁷) or in the presence of 10 µM mecamylamine, an nAChR blocker (turquoise; n = 10, 54.2 ± 3.6%, one-sample t test, P = 4.8 × 10⁻⁷); 10 µM pirenzepine, an M1 muscarinic receptor blocker (red; n = 7, 92.6 ± 6.0%, one-sample t test, P = 0.26); 10 µM AF-DX 116, an M2 muscarinic receptor blocker (green; n = 6, 53.8 ± 3.1%, one-sample t test, P = 2.5 × 10⁻⁵), and 10 µM 4-DAMP, an M3 muscarinic receptor blocker (blue; n = 6, 105 ± 3.7%, one-sample t test, P = 0.23). (B) Diagram illustrating extracellular recording configuration with recording and stimulation electrodes in SLM. (B1) Same as A1, except with SLM input stimulation. (B2) Summary graph of the proportion of control response amplitude remaining in SLM after CCh with increasing stimulation intensities (n = 10). (B3) Summary graph of the proportion of fEPSP amplitude remaining with 20-V stimulation in SLM after 10 µM CCh application (control, gray; n = 10, 68.9 ± 2.2%, one-sample t test, P = 8.8 × 10⁻⁷) or in the presence of 10 µM mecamylamine (turquoise; n = 10, 70.9 ± 3.8%, one-sample t test, P = 3.8 × 10⁻⁵); 10 µM pirenzepine (red; n = 7, 97.7 ± 7.5%, one-sample t test, P = 0.766); 10 µM AF-DX 116 (green; n = 6, 63.46 ± 5.0%, one-sample t test, P = 7.9 × 10⁻⁴); and 10 µM 4-DAMP (blue; n = 6, 98.2 ± 3%, one-sample t test, P = 0.567). (C) Diagram illustrating whole-cell recording configuration from CA2 PNs with stratum radiatum input stimulation in acute hippocampal slices. (C1) Sample traces of evoked EPSC recorded in a CA2 PN held at−70 mV with electrical stimulation of stratum radiatum input before (gray) and after (black) 10 µM CCh application in the presence of GABA receptor antagonists (1 µM SR95531 and 2 µM CGP5584A). (C2) Summary graph of the proportion of control response amplitude remaining after CCh with increasing stimulation in-tensities in stratum radiatum (n = 6; percentage remaining at 20-V stimulation = 57.3 ± 10.2%, one-sample t test, P = 0.008). (C3) Paired-pulse ratio at 20-V stimulation (n = 6; before CCh, 1.5 ± 0.1; after CCh, 1.8 ± 0.1; percentage increase = 19 ± 7%, paired t test, P = 0.041). (D) Same as C with SLM input stimulation. (D1) Same as in C1 except with SLM input stimulation. (D2) Summary graph of the proportion of control response amplitude remaining after CCh with in-creasing stimulation intensities in SLM; n = 6; percentage remaining at 20-V stimulation = 49.1 ± 8.0%, one-sample t test, P = 0.001). (D3) Paired-pulse ratio at 20-V stimulation (n = 5; before CCh, 1.6 ± 0.1; after CCh, 1.8 ± 0.1; percentage increase = 13 ± 3%, paired t test, P = 0.024). *, P < 0.05; ***, P < 0.001.
if activation of these receptors is also a requirement for the at-tenuation of synaptic transmission, we performed extracellular recordings of synaptic transmission in the presence of pirenzep-ine (10 µM), AF-DX 116 (10 µM), or 4-DAMP (1 µM) mAChR blockers. We found that with either the M1 or M3 mAChRs blocked, CCh application had no effect on the amplitude of evoked EPSPs at synapses in both stratum radiatum and SLM (Fig. 5, A3 and B3). These data indicate that M1 and M3 receptors are pri-marily responsible for mediating the CCh-induced decrease in
fEPSP amplitude. With M2 receptors blocked with AF-DX 116, we observed that the fEPSP amplitude remaining after CCh applica-tion was similar to control in both stratum radiatum and SLM.
To better examine the effect of CCh application on synaptic transmission independently from membrane depolarization effects, we performed whole-cell recordings of CA2 PNs with cesium intracellular solution. We voltage clamped the cells at −70 mV and evoked EPSCs from CA2 PNs with stimulating electrodes in stratum radiatum and SLM in the presence of
Figure 6. CCh decreases excitatory transmission through a presynaptic mechanism. (A) Sample traces of sEPSCs recorded in whole-cell voltage-clamp configuration from a CA2 PN before (top, gray) and after (bottom, black) application of 10 µM CCh on acute hippocampal slice. (B) Summary graph of the time course of sEPSC frequency recorded in whole-cell voltage-clamp configuration from CA2 PNs upon 10 µM CCh wash-in (n = 8; error bars represent SEM). (C) Summary graph of the sEPSC frequency recorded in whole-cell voltage-clamp configuration from CA2 PNs before and after 10 µM CCh application (n = 8; before CCh, 1.6 ± 0.4 Hz; after CCh, 7.0 ± 1.1 Hz; paired t test, P = 0.002; individual cells shown as thin lines; population averages shown as thick lines; error bars represent SEM). (D) Normalized histograms of the sEPSC amplitude recorded in whole-cell voltage-clamp configuration from CA2 PNs before (gray) and after (black) 10 µM CCh application (n = 7; first peaks in amplitude distributions: before CCh, 25.1 ± 0.6 pA; after CCh, 23.9 ± 1.1 pA; paired t test, P = 0.27, shaded areas represent SEM). (E) Sample traces of mEPSCs recorded in the presence of 100 nM TTX and 4 mM CaCl2before (top, gray) and after (bottom, black) application of 10 µM CCh. (F) Summary graph of the time course of mEPSC frequency recorded in voltage-clamp configuration from CA2 PNs upon 10 µM CCh application (n = 9, error bars represent SEM). (G) Summary graph of the mEPSC frequency recorded before and after 10 µM CCh application (n = 9; before CCh, 0.27 ± 0.05 Hz; after CCh, 0.35 ± 0.05 Hz; paired t test, P = 0.312; individual cells shown as thin lines; population averages shown as thick lines; error bars represent SEM). (H) Normalized histograms of the mEPSC amplitude recorded before (gray) and after (black) 10 µM CCh application (n = 9; first peaks in amplitude distributions: before CCh, 9.0 ± 0.6 pA; after CCh, 8.6 ± 0.9 pA; paired t test, P = 0.489; shaded areas represent SEM). (I) Averaged sample traces of EPSCs evoked with minimal stimulation of CA3 inputs and recorded in CA2 PNs before (black trace) and after (gray trace) 10 µM CCh application. (J) Example data from a single experiment using minimal stimulation in stratum radiatum to evoke EPSCs in CA2 PNs. Each EPSC amplitude is plotted over time before and during CCh application. (K–O) Summary graphs. (K) EPSC amplitude including failures (n = 5; paired t test, P = 0.023). (L) The amplitude excluding failures (paired t test, P = 0.555). (M) The paired pulse ratio (PPR, paired t test, P = 0.0241). (N and O) Failure rate (paired t test, P = 0.007; N) and coefficient of variation (paired t test, P = 0.028; O) measured before and after 10 µM CCh application (individual cells shown as thin lines; population averages shown as thick lines; error bars represent SEM). *, P < 0.05; **, P < 0.01.
GABA receptor blockers. Consistent with our field recordings, we observed a decrease in EPSC amplitude following CCh ap-plication in both stratum radiatum and SLM inputs (Fig. 5, C and D). However, in contrast to the field recordings, this reduction of EPSC amplitude did not significantly differ between stratum radiatum and SLM inputs (t test between proportion of control response in stratum radiatum and SLM, P = 0.47). Thus, we conclude that CCh application decreases excitatory transmission in addition to depolarizing CA2 PNs. We observed an increase in the paired-pulse ratio of evoked EPSCs in stratum radiatum and SLM (Fig. 5, C3–D3), consistent with a presynaptic effect of CCh
on synaptic vesicle release probability.
To determine whether there is also a postsynaptic change in excitatory transmission, we monitored spontaneous EPSCs
(sEPSCs). We found that the sEPSC frequency increased within 5 min following CCh application (Fig. 6, A–C). We hypothesize that this increase in frequency results from enhanced network activity, as connected synaptic inputs will be undergoing spon-taneous bursts of AP firing. We did not observe a change in the amplitude of individual synaptic events (Fig. 6 D), consistent with the hypothesis that CCh did not act postsynaptically to reduce synaptic transmission. To further confirm the presyn-aptic action of CCh and decouple the network activity from synaptic transmission, we performed this experiment in the presence of 100 nM TTX and 4 mM extracellular CaCl2,
per-mitting us to record mEPSCs. We did not detect a change in mEPSC frequency before and after application of CCh (Fig. 6, E–G). Furthermore, we observed no change in mEPSC quantal
Figure 7. CCh alters inhibitory synaptic transmission onto CA2 PNs. (A) Diagram illustrating whole-cell recording configuration from CA2 PNs with stratum radiatum and SLM input stimulation in acute hippocampal slices. Recordings were performed at +10 mV with intracellular cesium in the pipette. (B) Sample traces (B1) of evoked IPSCs recorded in a CA2 PN with electrical stimulation of stratum radiatum input before (gray) and after (black) 10 µM CCh application and summary graphs (B2) of the proportion of control response amplitude remaining after CCh with increasing stimulation intensities (n = 6; percentage remaining at 20-V stimulation = 31.9 ± 7.3%, one-sample t test, P < 0.001). (B3) Paired-pulse ratio at 20-V stimulation (n = 6; before CCh, 0.9 ± 0.1; after CCh, 1.2 ± 0.1; percentage increase = 32 ± 5%, paired t test, P = 0.001). (C) Same as B with SLM input stimulation (C1, sample traces; C2, summary graph; n = 6; percentage remaining at 20-V stimulation = 67.1 ± 11.2%, one-sample t test, P = 0.033). (C3) Paired-pulse ratio at 20-V stimulation (n = 6; before CCh, 0.7 ± 0.1; after CCh, 1.0 ± 0.1; percentage increase: 39 ± 19% by CCh; paired t test, P = 0.045). (D) Sample traces of sIPSCs recorded in whole-cell voltage-clamp configuration from a CA2 PN before (top, gray) and after (bottom, black) application of 10 µM CCh on acute hippocampal slices. (E) Summary graph of the time course of sIPSC frequency recorded in whole-cell voltage-clamp configuration from CA2 PNs upon 10 µM CCh wash-in (n = 7; error bars represent SEM). (F) Summary graph of the sIPSC frequency recorded in whole-cell voltage-clamp configuration from CA2 PNs before and after CCh application (n = 7; before CCh, 15 ± 0.9 Hz; after CCh, 19 ± 0.9 Hz, paired t test, P = 0.026; individual cells shown as gray lines; population averages shown as thick lines; error bars represent SEM). (G) Normalized histograms of the sIPSC amplitude recorded in whole-cell voltage-clamp configuration from CA2 PNs before (gray) and after (black) 10 µM CCh application (n = 7; first peaks in amplitude dis-tributions: before CCh, 36.0 ± 2.0 pA; after CCh, 40.4 ± 2.6 pA; paired t test, P = 0.29; shaded areas represent SEM). *, P < 0.05; **, P < 0.01.
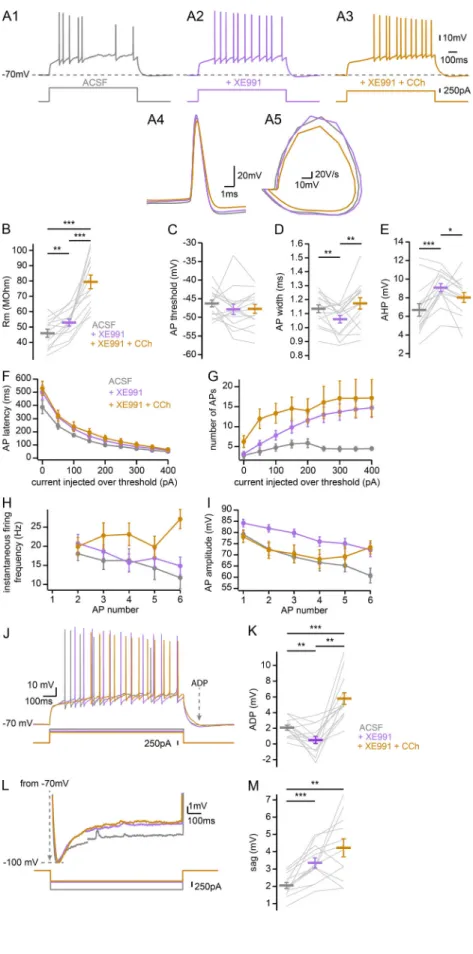
Figure 8. Contribution of the M-current to CCh ef-fects on CA2 PN intrinsic properties. (A) Sample traces of AP firing in response to depolarizing current step injections recorded in whole-cell current-clamp configuration from a CA2 PN in control (A1, gray), 10 µM XE-991 (A2, purple), and 10 µM XE-991 and 10 µM CCh (A3, orange), expanded view of the first AP in each condition (A4); and corresponding phase plane plot (A5). (B–I) Summary graphs of CA2 PNs AP firing properties in control (gray), 10 µM XE-991 (purple), and 10 µM XE-991 and 10 µM CCh (orange; n = 15; individual cells shown as thin lines; population averages shown as thick lines; error bars represent SEM). (B) RM(before XE-991, 46 ± 2.6 MOhm; after XE-991, 53 ± 2.3 MOhm; after XE-991 and CCh = 79 ± 4.5 MOhm; Friedman ANOVA, P < 0.001). (C) AP threshold (before XE-991,−46.3 ± 0.9 mV; after XE-991,−47.9 ± 1.4 mV; after XE-991 and CCh, −47.7 ± 1.2 mV; Friedman ANOVA, P = 0.37). (D) AP width at half-maximal amplitude (before XE-991, 1.13 ± 0.03 ms; after XE-991, 1.06 ± 0.03 ms; after XE-991 and CCh, 1.17 ± 0.04 ms; repeated-measures ANOVA, P = 0.002). (E) AHP (before 991, 6.7 ± 0.7 mV; after XE-991, 9.1 ± 0.4 mV; after XE-991 and CCh, 8.0 ± 0.5 mV; repeated-measures ANOVA, P < 0.001). (F) Latency to fire first AP per current step as a function of current injection over rheobase (200 pA over rheobase: before XE-991, 100 ± 7.6 ms; after XE-991, 132 ± 14.0 ms; after XE-991 and CCh, 147 ± 19.7 ms; Friedman ANOVA, P = 0.006). (G) Number of APs fired per current step as a function of current injection over rheobase (200 pA over rheobase, before XE-991, 6 ± 1; after XE-991, 12 ± 2; after XE-991 and CCh, 15 ± 3; Friedman ANOVA, P = 0.27). (H) Instantaneous firing frequency of APs as a function of AP number during a current step of intensity chosen 1.5 times above rheobase (first couple of APs frequency, before XE-991, 18 ± 1.8 Hz; after XE-991, 20 ± 2.3 Hz; after XE-991 and CCh, 20 ± 2.4 Hz; repeated-measures ANOVA, P = 0.55). (I) AP amplitude as a function of AP number during a current step of intensity chosen 1.5 times above rheobase (first AP amplitude, before XE-991, 79 ± 2.0 mV; after XE-991, 84 ± 1.6 mV; after XE-991 and CCh, 78 ± 2.6 mV; repeated-measures ANOVA on first AP amplitude, P = 0.044). (J) Sample traces of the ADP following a depolarizing current step injection in a CA2 PN recorded in whole-cell current-clamp configuration in control (gray), 10 µM XE-991 (purple), and 10 µM XE-991 and 10 µM CCh (orange). (K) Summary graph of CA2 PNs ADP in control (gray), 10 µM XE-991 (purple), and 10 µM XE-991 and 10 µM CCh (orange; n = 14, before 991, 2.1 ± 0.3 mV; after XE-991, 0.5 ± 0.5 mV; after XE-991 and CCh, 5.8 ± 0.7 mV; Friedman ANOVA, P < 0.001; individual cells shown as thin lines; population averages shown as thick lines; error bars represent SEM). (L) Sample traces of voltage sag in response to hyperpolarizing current step in-jections recorded in whole-cell current-clamp configu-ration from a CA2 PN in control (gray), 10 µM XE-991 (purple), and 10 µM XE-991 and 10 µM CCh (orange). (M) Summary graphs of CA2 PN voltage sag following hyperpolarization to−100 mV in control (gray), 10 µM XE-991 (purple), and 10 µM XE-991 and 10 µM CCh (orange; n = 12, preXE991, 2.1 ± 0.2 mV; after XE-991, 3.5 ± 0.3 mV; after XE-991 and CCh, 4.2 ± 0.5 mV; Friedman ANOVA, P < 0.001; individual cells shown as gray lines; population averages shown as thick lines; error bars represent SEM). *, P < 0.05; **, P < 0.01; ***, P < 0.001.
size (Fig. 6 H), consistent with a lack of postsynaptic effect of CCh. While these results support the hypothesis that CCh is acting presynaptically to reduce EPSC amplitude, the addition of TTX prevented >90% of spontaneous synaptic events, resulting in a very low mEPSC frequency. While this value is very similar to what has recently been reported by others for area CA2 (Modi et al., 2019), this low event frequency may be problematic in detecting changes in release probability. Furthermore, these spontaneous events are not input specific. Thus, we used a third method to investigate a potential presynaptic site of action of CCh, performing minimal stimulation of stratum radiatum in-puts while recording CA2 PNs before and after CCh application (Fig. 6, I and J). We observed that the amplitude of synaptic events decreased when failures were included (Fig. 6 K) but was not changed when failures were excluded (Fig. 6 L). Consis-tently, when the amplitudes of the first and second stimulation
were averaged with failures included, CCh application resulted in an increase in the paired pulse ratio (Fig. 6 M), indicating that release probability is decreased with CCh. Likewise, following CCh application, we observed an increase in failure rate (Fig. 6 N) as well as in the coefficient of variation (Fig. 6 O), consistent with a decrease in release probability.
We examined inhibitory transmission in area CA2 by using the same voltage clamp approach but held the CA2 PNs at +10 mV in the absence of GABA blockers. We observed that CCh application reduced inhibitory postsynaptic current (IPSC) am-plitudes evoked by both stratum radiatum and SLM input stimulation (Fig. 7, A–C). This reduction of IPSC amplitude was largest in stratum radiatum compared with SLM (t test between proportion of control response in stratum radiatum and SLM, P = 0.028). Paired-pulse ratios of evoked IPSCs in stratum ra-diatum and SLM were also increased after CCh application
Figure 9. Reduction of the M-current alone does not underlie the CCh-induced AP bursting in CA2 PNs. (A) Sample trace recorded in whole-cell current-clamp configuration from a CA2 PN and expanded views showing only minimal VMdepolarization without bursts during application of 10 µM of the M-current blocker XE-991 (A1) followed by increased depolarization (A2) and bursts (A3) upon subsequent application of 10 µM CCh in acute hippocampal slice. (B–D) Summary graphs of CA2 PN VMchanges with application of 10 µM CCh (black, n = 29; same CCh data shown inFig. 8, C and D, as 10 µM CCh inFig. 2, E
and F, respectively) or 10 µM XE-991 (purple, n = 8; individual cells shown as dots; population averages shown as thick lines; error bars represent SEM). (B) VM levels at resting and after the initial depolarization induced by CCh or XE-991 (before CCh,−75.4 ± 1.1; after CCh, −65.4 ± 1.0; before XE-991, −76.7 ± 2.7 mV; after XE-991,−73.6 ± 2.8 mV; paired t test before CCh and after CCh, P < 0.001; paired t test before XE-991 and after XE-991, P = 0.001; t test before CCh and before XE-991, P = 0.65; t test after CCh and after XE-991, P = 0.023). (C) VMinitial depolarization magnitude upon CCh or XE-991 application (CCh, 10.0 ± 0.9 mV; XE-991, 3.2 ± 0.6 mV; Mann–Whitney U test, P < 0.001). (D) VMinitial depolarization rate upon CCh or XE-991 application (CCh, 6.0 ± 0.7 mV/min; XE-991, 0.8 ± 0.3 mV/min; Mann–Whitney U test, P < 0.001). (E) VMlevels following sequential addition of XE-991 and XE-991 plus CCh (before XE-991,−74.0 ± 3.4 mV; after XE-991,−70.9 ± 3.6 mV; after XE-991 and CCh, −61.1 ± 3.2 mV; repeated-measures ANOVA, P = 0.001, n = 5). *, P < 0.05; **, P < 0.01; ***, P < 0.001.
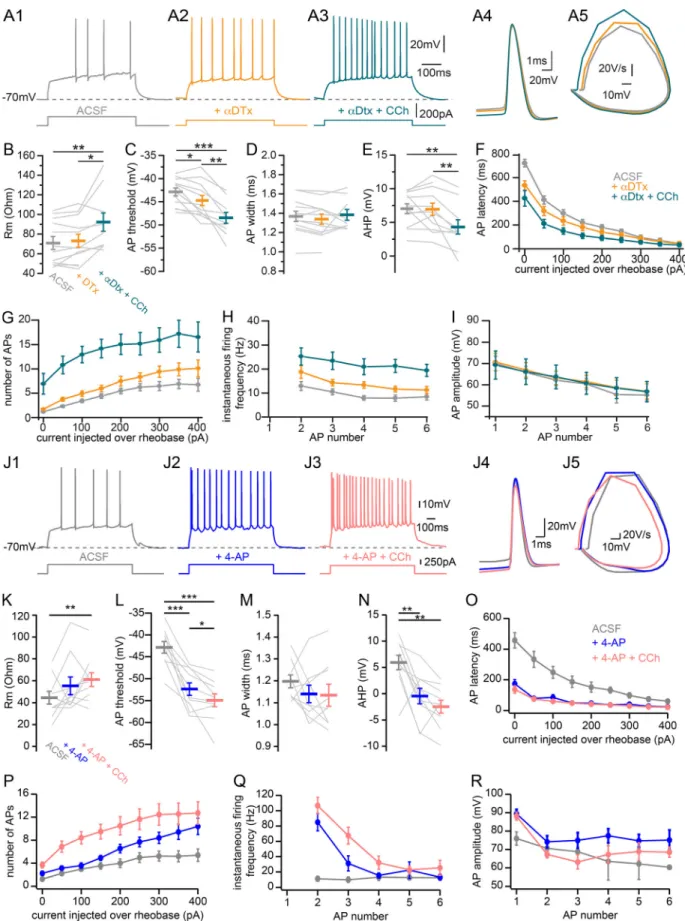
Figure 10. Contribution of voltage-activated potassium currents to CCh-induced effects on CA2 PN intrinsic properties. (A) Sample traces of AP firing in response to depolarizing current step injections recorded in whole-cell current-clamp configuration from a CA2 PN in control ACSF (A1, gray), 100 nM⍺-DTX (A2, orange), and 100 nM⍺-DTX and 10 µM CCh (A3, green); expanded view of the first AP in each condition (A4); and corresponding phase plane plot (A5). (B–I) Summary graphs of CA2 PNs AP firing properties in control (gray), 100 nM ⍺-DTX (orange), and 100 nM ⍺-DTX and 10 µM CCh (green; n = 12 for before and after⍺-DTX, n = 9 for after ⍺-DTX and CCh; individual cells shown as thin lines; population averages shown as thick lines; error bars represent SEM). (B) RM
(Fig. 7, B3–C3). We then gauged how inhibitory transmission
was affected by CCh by recording spontaneous IPSCs (sIPSCs). Monitoring sIPSCs by holding CA2 PNs at a potential of +10 mV showed that CCh application increased the sIPSC frequency within 5 min (Fig. 7, D–F). However, the sIPSC amplitude dis-tribution was not changed by CCh (Fig. 7 G), indicating that CCh acts presynaptically to reduce inhibitory transmission by de-creasing the probability of GABA release. Altogether, these re-sults show a drastic influence of CCh over synaptic transmission in area CA2.
Contribution of M-current to CCh-induced depolarization Because CA2 PNs can fire bursts of APs in the absence of syn-aptic transmission, we examined which ionic conductance un-derlies the depolarization and spontaneous AP bursting in the presence of CCh. KV7 channels, which underlie the M-current,
have been shown to be modulated by acetylcholine and play a central role in controlling resting VMand repetitive and burst
firing in CA3 and CA1 PNs (Cobb et al., 1999;H¨onigsperger et al., 2015). We hypothesize that this current may play a similar role in CA2 PNs. To test this, we looked at the effect of blocking the M-current with 10 µM XE-991 on CA2 PN intrinsic properties (Fig. 8 A). For these experiments, care was taken to inject DC as needed to keep the initial VM at−70 mV. Data were acquired
after 20 min of bath application of XE-991. We confirmed that the drug was active by performing whole-cell recordings in area CA1 and reproducing previously published changes in EPSP summation and intrinsic properties (H¨onigsperger et al., 2015). First, we examined the effects of XE-991 on CA2 PN in-trinsic excitability. Consistent with previous observations that M-current channels are open at rest in CA2 PNs (Tirko et al., 2018), we observed an increase of RMin CA2 PNs following
XE-991 application, with subsequent application of CCh causing further RM increase (Fig. 8 B). Application of X-991 did not
change AP threshold (Fig. 8 C) but did reduce AP width (Fig. 8 D) and increased AHP (Fig. 8 E). These effects were unchanged or attenuated by further application of CCh (Fig. 8, C–E). Applica-tion of XE-991 increased the latency of AP onset (Fig. 8 F) as well as the number of APs per step, albeit only at current injections well above threshold (Fig. 8 G), and occluded the effects of CCh application of these measurements. The milder effect of XE-991 alone compared with XE-991 plus CCh on AP number at low current injections indicates that CCh increases CA2 PN excit-ability by acting on additional conductances beside the M-current. Although the instantaneous firing frequency tended to be higher and to increase with AP number in XE-991 with CCh, no significant effects were seen in this dataset (Fig. 8 H). XE-991 application alone significantly increased AP amplitude, and addition of CCh reversed that effect, suggesting an M-current–independent effect of CCh in reducing spike amplitude (Fig. 8 I). The ADP following current step termination was reduced in XE-991 compared with ACSF, and subsequent application of CCh led to a further increase (Fig. 8, J and K). Application of XE-991 led to an increase in sag potential (Fig. 8 L). Our explanation of this finding is as follows. Block of the M-current results in a depolarization of the membrane, strongly supporting the conclusion that a fraction of these channels is open at resting VM. In normal ACSF, the sag current is a result of two
processes: the opening of HCN channels, resulting in Ih, and the
closing of the Kv7 channels, resulting in a reduction of M-current.
In our protocol, we inject DC to keep the initial starting VMat−70
mV. We then inject the necessary amount of current to bring the VMto−100 mV. The reversal potential for potassium is more than
−100 mV, so any M-current will be expected to be depolarizing and counteract the nonselective Ih. Thus, in the presence of
XE-991, the M-current at rest is blocked, and the step to−100 mV only activates Ih, which appears larger, because it is not
attenuated by the closing M-current. Presented differently, the RMwill be higher with XE-991 present, allowing a greater
(before⍺-DTX, 70.9 ± 6.5 MOhm; after ⍺-DTX, 73.1 ± 6.6 MOhm; after ⍺-DTX and CCh, 92.2 ± 9.4 MOhm; repeated-measures ANOVA, P = 0.0028). (C) AP threshold (before⍺-DTX, −42.9 ± 0.8 mV; after ⍺-DTX, −44.7 ± 1.1 mV; after ⍺-DTX and CCh, −48.5 ± 1.1 mV; repeated-measures ANOVA, P < 0.001). (D) AP width at half-maximal amplitude (before⍺-DTX, 1.36 ± 0.05 ms; after ⍺-DTX, 1.34 ± 0.05 ms; after ⍺-DTX and CCh, 1.38 ± 0.05 ms; repeated-measures ANOVA, P = 0.71). (E) AHP (before⍺-DTX, 7.0 ± 0.7 mV; after ⍺-DTX, 6.9 ± 0.9 mV; after ⍺-DTX and CCh, −4.3 ± 1.1 mV, repeated-measures ANOVA, P = 0.0021). (F) Latency to fire first AP per current step as a function of current injection over rheobase (200 pA over rheobase, before⍺-DTX, 180.5 ± 22.5 ms; after ⍺-DTX, 138.1 ± 23.1 ms; after⍺-DTX and CCh, 91.0 ± 20.3 ms; repeated-measures ANOVA, P = 0.0016). (G) Number of APs fired per current step as a function of current injection over rheobase (200 pA over rheobase, before⍺-DTX, 5.5 ± 0.6; after ⍺-DTX, 7.5 ± 1.0; after ⍺-DTX and CCh, 15.1 ± 2.1; Friedman ANOVA, P < 0.001). (H) Instantaneous firing frequency of APs as a function of AP number during a current step of intensity chosen 1.5 times above rheobase (first couple of APs: before⍺-DTX, 12.9 ± 1.8 Hz; after ⍺-DTX, 18.7 ± 2.6 Hz; after ⍺-DTX and CCh, 25.3 ± 3.6 Hz; repeated-measures ANOVA, P < 0.001). (I) AP amplitude as a function of AP number during a current step of intensity chosen 1.5 times above rheobase (first AP: before⍺-DTX, 70.0 ± 3.4 mV; after ⍺-DTX, 70.7 ± 4.1 mV; after⍺-DTX and CCh, 69.3 ± 6.6 mV; repeated-measures ANOVA, P = 0.59). (J) Sample traces of AP firing in response to depolarizing current step injections recorded in whole-cell current-clamp configuration from a CA2 PN in control ACSF (J1, gray), 100 µM 4-AP (J2, blue), and 100 µM 4-AP and 10 µM CCh (J3, pink); expanded view of the first AP in each condition (J4); and corresponding phase plane plot (J5). (K–R) Summary graphs of CA2 PNs AP firing properties in control (gray), 100 µM 4-AP (blue), and 100 µM 4-AP and 10 µM CCh (pink; n = 10; individual cells shown as thin lines; population averages shown as thick lines; error bars represent SEM). (K) RM(before 4-AP, 44.6 ± 5.7 MOhm; after 4-AP, 55.3 ± 8.0 MOhm; after 4-AP and CCh, 61.0 ± 6.3 MOhm; repeated-measures ANOVA, P = 0.029). (L) AP threshold (before 4-AP,−42.8 ± 1.3 mV; after 4-AP, −52.4 ± 1.4 mV; after 4-AP and CCh, −54.9 ± 1.5 mV; repeated-measures ANOVA, P < 0.001). (M) AP width at half-maximal amplitude (before 4-AP, 1.2 ± 0.03 ms; after 4-AP, 1.1 ± 0.04 ms; after 4-AP and CCh, 1.1 ± 0.05 ms; repeated-measures ANOVA, P = 0.27). (N) AHP (before 4-AP, 5.9 ± 1.4 mV; after 4-AP,−0.4 ± 1.4 mV; after 4-AP and CCh, −2.5 ± 1.2 mV; repeated-measures ANOVA, P < 0.001). (O) Latency to fire first AP per current step as a function of current injection over rheobase (200 pA over rheobase, before 4-AP, 152 ± 33.9 ms; after 4-AP, 48 ± 5.1 ms; after 4-AP and CCh, 43 ± 3.5 ms; Friedman ANOVA, P = 0.018). (P) Number of APs fired per current step as a function of current injection over rheobase (200 pA over rheobase, before 4-AP, 4.0 ± 0.7; after 4-AP, 6.5 ± 0.7; after 4-AP and CCh, 10.5 ± 1.6; Friedman ANOVA, P < 0.001). (Q) Instantaneous firing frequency of APs as a function of AP number during a current step of intensity chosen 1.5 times above rheobase (first couple of APs, before 4-AP, 11.3 ± 3.1 Hz; after 4-AP, 84.9 ± 11.3 Hz; after 4-AP and CCh, 106.7 ± 10.9 Hz; Friedman ANOVA, P < 0.001). (R) AP amplitude as a function of AP number during a current step of intensity chosen 1.5 times above rheobase (first AP, before 4-AP, 76 ± 3.6 mV; after 4-AP, 89 ± 2.4 mV; after 4-AP and CCh, 88 ± 2.2 mV; repeated-measures ANOVA, P < 0.001). *, P < 0.05; **, P < 0.01; ***, P < 0.001.
current at −100 mV, thus making the “sag” measurement larger. Further application of CCh in the presence of XE-991 resulted in similar levels of sag potential (Fig. 8 M). Alto-gether, these data show that the application of the KV7 blocker
XE-991 partially recapitulated and/or occluded many of the effects of CCh on CA2 PN intrinsic properties, including AHP amplitude, number of APs per current step, and sag current. This suggests a contribution of M-current closing to the ef-fects of CCh on CA2 PN VM.
During these experiments, we also investigated the con-sequences of M-current block by XE-991 on CA2 PN VM by
performing current-clamp recordings without injection of DC. We found that application of XE-991 led to a significant depo-larization of CA2 PNs. This depodepo-larization was insufficient to elicit AP bursting, and subsequent application of CCh brought further depolarization and AP bursting (Fig. 9 A). XE-991 has been found to be a voltage-dependent blocker of KV7.2 channels
exogenously expressed in Chinese hamster ovary cells (Greene et al., 2017). Thus, we performed several experiments in which DC was injected to just below threshold to increase the proba-bility of channel block. No difference was observed in the VM
following this manipulation. When compared with CCh-induced initial VM depolarization of CA2 PNs, the XE-991 effect was
smaller and did not bring VMto depolarized levels sufficient to
AP bursting (Fig. 9, B–D). To confirm this, we analyzed the changes in VMbefore addition of XE-991, during and following
the addition of CCh with XE-991 (Fig. 9 E). With this, we con-sistently observed an increase in the RMfollowing XE-991
ap-plication, indicating that a proportion of these channels are open at rest (Fig. 8 B). Therefore, this result shows that the M-current is likely open at rest in CA2 PNs, and blocking it leads to a partial depolarization of 3.2 ± 0.6 mV (n = 8). However, addition of CCh resulted in a further increase of RM, indicating a separate
con-ductance contributing to membrane depolarization, and that
Figure 11. Voltage-gated potassium channels pace AP firing during CCh-induced bursts in CA2 PNs. (A1 and A2) Sample trace of bursts recorded in whole-cell current-clamp configuration from a CA2 PN (A1) and expanded view of a burst (A2) upon application of 10 µM CCh in acute hippocampal slice with D-type potassium channels blocked by application of 100 nM⍺-DTX). (A3 and A4) Sample trace of bursts (A3) and an expanded view (A4) recorded in the same configuration, except with the nonselective KVchannel blocker 4-AP applied at 100 µM with 10 µM CCh. (B1) VMlevels at rest (gray) after application of 100 µM 4-AP (blue) and after further application of 10 µM CCh (pink; before 4-AP,−76.7 ± 1.6 mV; after 4-AP, −75.6 ± 1.5 mV; after 4-AP and CCh, −65.7 ± 1.5 mV; n = 10; repeated-measures ANOVA, P < 0.001). (B2) VMlevels at rest (gray) and after application of⍺-DTX (orange) and further application of CCh (green; before⍺-DTX, −72.9 ± 0.8 mV; after ⍺-DTX, −71.3 ± 1.1 mV; after ⍺-DTX and CCh, −64.7 ± 0.7 mV; n = 10; repeated-measures ANOVA, P < 0.001). (C–E) Summary graphs of burst characteristics with application of 10 µM CCh in control (black, n = 25; same CCh data shown inFig. 12, C–E, as CCh inFig. 4, H, I, and E, respectively), 100 nM⍺-DTX (green, n = 9), and 100 µM 4-AP (pink, n = 8; individual cells shown as dots; population averages shown as thick lines; error bars represent SEM). (C) Burst rise rate (Kruskal–Wallis test, P < 0.001). (D) Burst decay rate (Kruskal–Wallis test, P = 0.008). (E) Firing rate during burst (Kruskal–Wallis test, P = 0.027). *, P < 0.05; ***, P < 0.001.