COAGULATION OF COLLOIDAL PARTICLES IN TURBULENT FLOWS WITH APPLICATIONS IN WASTEWATER TREATMENT
by
Michael Angelis Delichatsios
Diploma in Mechanical Engineering National Technical University of Athens
(1967)
S. 1., Massachusetts Institute of Technology (1971)
SUBMITTED IN PARTIAL FULFILLMENT OF THE REQUIREMENTS FOR THE
DEGREE OF DOCTOR OF PHILOSOPHY at the Massachusetts Institute of Technology September, 1974 -
Fr
Signature of AuthaU ... .-. .Department of Mechanical Engineering July 25, 1974
Certified by . . .
Thesis Supervisor
Accepted by . . . ... . . . . . . . *.
Chairman, Departmental Committee on Graduate Students
COAGULATION OF COLLOIDAL PARTICLES IN TURBULENT FLOiTS WITH APPLICATIONS IN WASTEWATER TREATMENT
by
Michael Angelis Delichatsios
Submitted to the Department of Mechanical Engineering on July 25, 1974, in partial fulfillment of the requirements for the degree of Doctor of Philosophy.
ABSTRACT
The coagulation of colloidal particles of various sizes in a locally isotropic turbulent flow has been investigated theoretically and experimentally. A simple kinetic model for the collision between particles proves to be successful in predicting the coagulation rate of surface charge free colloidal particles. Retardation of coagulation rates by the interparticle repulsive potential is also discussed. The coagulation rate of latex particles is measured inside a fully developed turbulent pipe flow. Finally, a new approach to wastewater treatment systems employing coagulation is proposed, based on a detailed under-ntanding of the interaction between coagulation, breakup, and sedimenta-t4.on.
Thesis Supervisor: Ronald F. Probstein Title: Professor of Mechanical Engineering
-4-TABLE OF CONTENTS Page TITLE PAGE . ...-.- 1 ABSTRACT ... 2 ACKNOWLEDGMENTS...- . .3 TABLE OF CONTENTS ... 4. . . . . . . . NOMENCLATURE... 6 1. INTRODUCTION . . . . . . . . . . . . . . ...-.-.-.-..-.-. 10
2. THEORY FOR TUE COAGULATION OF COLLOIDAL PARTICLES IN TURBULENT FLOWS . . . . . . . . . . . ..... ... 15
2.1 Coagulation as a Two-step Process 15 2.2 A Simple Kinetic iodel for Fully Destabilized Dispersions 18 2.3 ionodisperse Systems 19 2.4 Polydisperse Systems 22 2.5 Comparison of Turbulent Coagulation Rates with Brownian and Shear Flow Coagulation Rates 26 2.6 Turbulent Coagulation in Partially Destabilized Systems 28 3. EXPERllENTAL DESIGN AND APPARATUS . . . . . . . . 32 3.1 Purpose of the Experiment and General Description 32
3.2 Flow System 32
3.3 Injection Stations 34
3.4 Sampling Stations 35
3.5 Particle Number Density Analysis 37
3.6 Choice of Dispersed Particles 39
3.7 Preparation and Destabilization of the Latex
Polymer Emulsion 39
ACKNOWLEDGMNTS
I would like to express my sincere thanks to my advisor, Professor
R. F. Probstein, for suggesting to me the subject of the present thesis
and for his criticisms during the course of this research. I would also like to thank the other members of my thesis committee, Professor
A. A. Sonin of Massachusetts Institute of Technology and Professor
L. A. Spielman of Harvard University, for their helpful advice and sugges-tions. I would like also to express my gratitude to the other members
of the Fluid Mechanics Laboratory, who have helped with this thesis, both with their ideas and with their criticisms. Finally, I would like to
thank Miss Margaret Gazan for typing a first draft of this thesis and
Miss Lucille Blake for typing the final text.
-5-Page
4. PRESENTATION AND DISCUSSION OF RESULTS ... ... 42
4.1 Characteristics of Turbulent Pipe Flow 42 4.2 Brownian Coagulation Rate and Particle Surface Potential 43 4.3 Turbulent Coagulation Rate Experiments 45 5. BREAKUP OF DISPERSED PARTICLES IN ISOTROPIC TURBULENT FLOWS 51 6. SCALING LAWS AND APPLICATIONS IN WASTEWATER TREATMENT SYSTEMS.a... . ... 58
6.1 Scaling Laws 58 6.2 A New Approach to Wastewater Treatment 60 7. CONCLUSIONS AND RECOMMENDATIONS ... ... 63
APPENDIX A - Limits of the Polydisperseness Coefficient A(t) 65 APPENDIX B - The Stability Factor in Brownian Motion Coagulation 67 APPENDIX C - Shipboard Wastewater Treatment 70 REFERENCES... ... ... 73
TABLES ... ... ... . . . . 78
FIGURE TITLES... ... 80
FIGURES.a... ... 82
NOMENCLATURE
A(t) polydisperseness coefficient for coagulation (dimensionless), Equation (2-31)
b volume Brownian coagulation rate (cm3/sec)
d particle diameter (cm)
D pipe diameter (cm)
DT tank diameter (cm)
D ffeffective turbulent diffusion coefficient of the relative particle motion (cm2/sec)
f pipe friction coefficient (dimensionless)
fMd/W) function depending on the continuous and dispersed phase viscosities (dimensionless), Equation (5-2)
F fluid mechanical force acting on a particle (dyn) g gravitational acceleration (cm/sec2)
G rate of strain in shear flows (sec
)
H Harnaker constant (ergs)
k Boltzmann constant (ergs/0K)
turbulent coagulation pipe length (cm) L Eulerian macroscale of turbulence (cm) n(v, t) particle volume distribution (cm-6)
N total particle number density (cm-3
p(u) probability distribution function of the relative velocity u
p(C) probability distribution function of the relative acceleration
cZ
-7-p(u, 6) P
Q
r r 0 Re t T u u ub u C UD uk urr (Ur eff us U* 2 1/2 (u)
joint probability distribution function between the relative velocity u and acceleration 6
impeller power input in an agitator tank (ergs/sec) pipe flow rate (gpm)
distance between two points (cm)
maximum distance of potential action from the center of a particle (cm)
U D pipe Reynolds number (V)
time (sec)
absolute temperature (0K)
turbulent relative velocity between two points (cm/sec) instantaneous turbulent velocity at a point (cm/sec) breakup characteristic velocity (cm/sec)
cutoff velocity value of the relative velocity probability distribution function (cm/sec)
induced relative velocity by potential forces (cm/sec) Equation (2-46)
Kolmogorov characteristic velocity (cm/sec), Equation (2-12) root mean square relative particle velocity (cm/sec)
effective collision velocity in partially destabilized systems (cm/sec), Equation (2-47)
particle settling velocity (cm/sec)
pipe friction velocity (cm/sec), Equation (4-2)
root mean square turbulent velocity at a point (cm/sec) turbulent relative acceleration between two points (cm/sec2
(2 )1/2 U V v vr W(r) W
w
0 Br Wturb x Greek Symbols y D pd p p p croot mean square turbulent relative acceleration
between two points (cm/sec2), Equations (5-10), (5-11) average pipe velocity (cm/sec)
particle volume (cm
)
tank volume (cm3)interparticle potential energy as a function of the distance between the particle centers (ergs)
characteristic interparticle potential energy (ergs) Brownian coagulation stability factor (dimensionless) turbulent coagulation stability factor (dimensionless)
distance from the first sampling station along the pipe (cm)
drop surface tension (dyn/cm)
rate of turbulent energy dissipation per unit mass (ergs/sec. gm) '
ratio of shear flow to turbulent transport (dimensionless) temperature (0C)
Kolmogorov microscale of turbulence (cm) Debye length (cm)
viscosity of the continuous phase (gm/sec.cm) viscosity of the dispersed phase (gm/sec.cm)
kinematic viscosity of the continuous phase (cm2/sec) dimensionless particle volume, Equation (2-25)
density of the continuous phase (gm/cm3)
3
particle density (gm/cm
)
-9-T Kolmogorov time scale (sec), Equation (2-5)
T b breakup characteristic time (sec), Equations (5-13), (5-14) TBr Brownian coagulation characteristic time (sec),
Equation (2-35)
TC turbulent coagulation characteristic time (sec) Equation (2-36)
Td turbulent characteristic time in the inertial subrange (sec), Equation (2-6)
Tr particle motion relaxation time (sec), Equation (2-4) y volume fraction of the dispersed phase (dimensionless)
ryD destabilizer volumetric concentration (dimensionless) y(,, t) dimensionless particle size distribution, Equation (2-26) W particle coagulation rate in a fully destabilized
system (sec )
Wb(v) breakup rate of a particle with volume v (sec)
WD particle coagulation rate in a partially destabilized system (sec1)
WlF coagulation rate of primary particles with flocs (sec
)
w(v,v') volume swept per unit time during collision between1. INTRODUCTION
Systems of particles dispersed in a continuous phase are very common in practice. They are usually known as aerosols, dispersions of parti-cles in a gaseous medium, suspensions, dispersions of solid partiparti-cles
in a liquid medium, and emulsions, dispersions of drops in a liquid medium. In many applications the coagulation between the dispersed particles is of major importance with respect to the treatment, handling, or behavior of the dispersions. In this work we are mainly going to consider
disper-sions of colloidal particles in a liquid medium.
Colloidal particles of submicron or micron size acquire a surface charge, usually negative. The dispersions of these particles in a liquid medium remain stable for a long time, since both the gravitational forces are weak compared to thermal motion, and coagulation of the particles is
inhibited due to interparticle potential repulsions.
It is apparent that coagulation is a two-step process. Kinetic
transport leads to particle collisions, and aggregation between two
parti-cles is accomplished as soon as the interparticle repulsive action is
over-come. Particle transport may take place as a consequence of Brownian motion, shear flow, and turbulent agitation. The shielding action of the
surface charge can be reduced or neutralized, i.e., the dispersion is
destabilized, by the addition of chemicals dissolved in the dispersion. The destabilization of the dispersion by the chemicals may be accom-plished in four distinct ways (O'Melia in Weber (1972)):
1. Adsorption of the chemicals on the particle's surface
-11-2. Adsorption for particle bridging
3. Entrapment of particles in metal hydroxide precipitate 4. Repression of the effective range of the interparticle
potential.
The phenomenon of coagulation has been analyzed in a large number of works. Smoluchowski (1916) developed successful theories for the coagulation of surface charge free particles in Brownian motion and
shear flow. He assumed that particle interactions at short distances can be neglected. Saffman and Turner (1956) and independently Levich
(1962) developed models for the coagulation in isotropic turbulent flows of surface charge free dispersed particles of size less than the Kolmogorov microscale.
In parallel Fuchs (1934) incorporated in Smoluchowski's diffusion model for the Brownian coagulation between charged particles the effects of interparticle repulsions.
In late 1940's the now generally accepted VODL (Verwey-Overbeek and Derjaguin-Landau) theory succeeded in relating the particle surface charge
and the interparticle repulsive potential to the physiochemical properties of a whole class of dispersions, the lyophobic dispersions (see, e.g., Verwey-Overbeek (1948)). Using the theory developed by Fuchs (1934), Reerink and Overbeek (1954) estimated the retardation effects of the
repulsive action on the Brownian coagulation rates.
Finally the viscous interactions between particles at short distances were incorporated in Smoluchowski's theory for Brownian coagulation by
Numerous experimental investigations verified Smoluchowski's theory for Brownian and shear flow coagulation (see more references in Swift and Friedlander (1964)). The agreement of the experimental results with these theories indicatesthat in many cases the viscous interaction effects suggested by Spielman (1970) may be neglected.
Several experiments in agitator tanks (see, e.g., Birkner and Morgan (1968) and Hahn and Stumm (1968)) failed to completely verify the exist-ing theories of turbulent coagulation. In these experiments not com-pletely destablized dispersions were used. Moreover, the turbulent flow inside an agitator tank is far from homogeneous and isotropic (Lattke
(1971)), a basic assumption in the theories of turbulent motion coagula-tion suggested by Saffman and Turner (1956) and Levich (1962).
Finally it is important to notice here that for deformable particles, for example, drops with size larger than the colloidal particles, the squeezing of the continuous phase film between the particles during colli-sion may have a significant influence on their coagulation. This has already been observed in Brownian coagulation experiments (Tempel (1953)). We expect that due to the higher interparticle collision forces the
squeez-ing effect will be negligible in turbulent coagulation.
In this thesis we develop a new theory, based on simple kinetic theory collision concepts, for the turbulent coagulation of dispersed particles of sizes less than or larger than the Kolmogorov microscale. Partially destabilized systems are also included in this analysis. Experiments in
fully developed turbulent pipe flows have been carried out, and the
~-13-goal is the rational design of wastewater treatment systems after com-plete knowledge of the coagulation phenomenon has been gained.
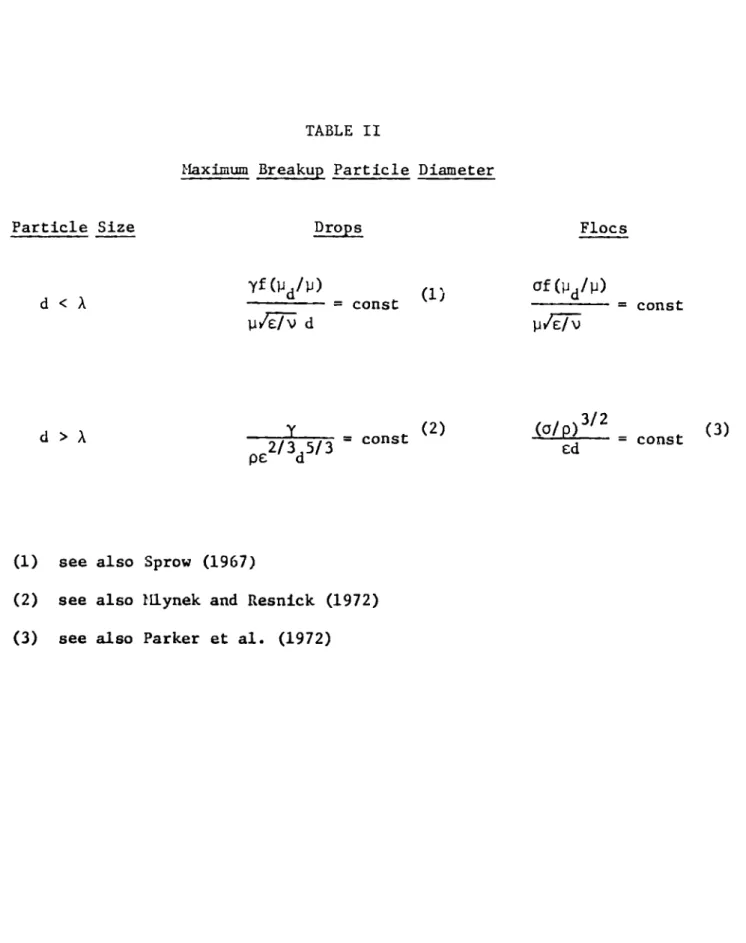
During the course of this work it became apparent that breakup of particles under turbulent conditions posed a limit in the operation of wastewater treatment systems employing coagulation. The maxiMum parti-cle size in dilute dispersions under known turbulent flow conditions is well predicted by the theories of Kolmogorov (1949) and Hinze (1955), for particles with size in the inertial subrange of an isotropic turbulent flow. In denhe dispersions coagulation opposes breakup, and a steady average particle size is reached when the coagulation rate is equili-brated to the breakup rate. A new model is suggested in this work for the estimation of the breakup rate of particles in isotropic turbulent
flows.
Important scaling laws relating coagulation, breakup, and sedimenta-tion of particles are developed based on the knowledge gained in this whole work. A new method and apparatus for wastewater treatment in ships
is finally proposed with the great advantage of considerably reducing the
space requirements by making use of existing piping.
An outline of the contents of this dissertation illustrates in general
the approach used in this research. Chapter 2 contains the theoretical models of turbulent coagulation for fully or partially destablized systems with dispersed particles of various sizes in comparison with the Kolmogorov miscroscale. The experimental set-up and procedure to measure the coagula-tion rate between particles in turbulent pipe flows are described in
with the theoretical predictions. Breakup rates of particles and their maximum size in an isotropic turbulent flow is discussed in Chapter 5.
Scaling laws pertinent to wastewater treatment systems and a new method for wastewater treatment are brought forward in Chapter 6. Finally, some important recommendations for continuation of the present work are
-15-2. THEORY FOR THE COAGULATION OF COLLOIDAL PARTICLES IN TURBULENT FLOWS
2.1 Coagulation as a Two-step Process
As it has been pointed out in the introduction coagulation is a two-step process, namely, kinetic transport of particles leading to eventual collisions and sticking of the particles to form one particle after the interparticle repulsion is overcome. The collision rate between parti-cles depends on their relative velocity, their size and particle size distribution, and the particle number density, that is, the number of
particles per unit volume of the continuous phase. The probability of
sticking will depend primarily on the intensity of interparticle
poten-tial energy and the hydrodynamic forces during collision available to counteract this potential.
It is proposed that turbulent motion may increase the coagulation
rate in comparison with shear flow or Brownian motion by two factors.
Higher relative velocities lead to an increase of the collision rate, while at the same time greater impact energies during collisions may
improve the sticking probability of particles.
Before going further in the investigation of the coagulation between particles in isotropic turbulent flows, we put forward the assumptions underlying the present analysis.
1. Only isotropic turbulent flows will be considered here. This is not really a severe restriction because many turbulent flows may be modeled as locally isotropic.
2. Binary collisions will take place during particle interactions; that is, only dilute dispersions will be studied. For homogeneous
dispersions with a volume fraction of the dispersed phase
P,
thisassumption will be applicable if 2 <<l. Here $P can be interpreted as the probability that two particles are found simultaneously at a distance of a particle diameter from a third particle (Batchelor
(1972)).
3. Gravitational forces may be in general neglected when the particle settling velocity is much smaller than the root mean square turbulent
velocity (Owen (1969)).
The settling velocity is equal to (Owen (1969)),
Up-- vd2 ._(2-1)
a 18 P V
Here pp is the particle density, d its diameter, p the density and V the kinematic visco3ity of the continuous phase.
The root mean square turbulent velocity is given (Batchelor (1960))
by
(u2)1/2 = EL)/3 (2-2)
where C is the rate of turbulent energy dissipation per unit mass, and L is the Eulerian macroscale of turbulence.
It follows that gravitational effects will be negligible when
u
s <<1 . (2-3)
(u,2)1/ 2
4. Due to strong interparticle impact forces, the squeezing of the con-tinuous phase film during collision between two particles will not
-17-significance is minimal in the coagulation of dispersed colloidal
size nondeformable particles even in the case of Brownian motion, 5. Interactions between two particles will be neglected. Interactions
between particles and the continuous phase will be small for dilute systems.
There is no comprehensive analysis of particle interactions at short interparticle distances in an isotropic turbulent flow, in analogy, for example, to the Stokes flow particle interactions (Batchelor
(1972)). Owen (1969) has estimated that in a dispersion the rate of turbulent energy dissipation per unit mass compared with that of a
particle free continuous fluid is increased by a factor of (1 + ).
6. Slip velocities between a particle and the continuous phase will be
insignificant if the relaxation time of the particle motion is less than a turbulent characteristic time.
For spherical particles and relative velocities such that the
Reynolds number of the particle motion is less than one, the relaxa-tion time is (Owen (1969)),
(p +p/2) 2
. p_ - (2-4)
r 18 p V
The turbulent characteristic time is that of an eddy of size equal to the particle diameter. For particles with size less than the Kolmogorov microscale (A = (Y )l), C this time is equal to the Kolmogorov time scale (Rotta (1972)).
(v)1/2
For particles with size in the inertial subrange of turbulence, the turbulent characteristic time is (Rotta (1972)),
d
Td - d/3 -(2-6)
d (Ed)13
Thus slip velocities will be neglected when T
<1 for d<A (2-7)
T
-K<1 for d > X. (248)
'd
These conditions are in general satisfied for colloidal particles
dispersed in a liquid medium.
7. Finally, breakup of colloidal size particles does not take place
under normal turbulent flow conditions. This statement will be justified in greater detail in Chapter 5.
2.2 A Simple Kinetic Model for Fully Destabilized Dispersions
In what follows we assume that the dispersion is fully destablized;
namely, the interparticle potential forces are neutralized by the
addi-tion of chemicals called coagulants or coagulant aids (Weber (1972)).
The coagulation rate of particles will then be effectively equal to their collision rate.
In his pioneering work Smoluchowski (1916) suggested a simple diffu-sion model for Brownian coagulation. Each particle is considered as a
potential coagulating sphere towards which the surrounding particles diffuse and subsequently coagulate. This model has been lately corrected by
Spielman (1970) to take into account viscous interactions between the
-19-predicts that the coagulation rate of particles in a shear flow is pro-portional to the rate of strain.
Camp and Stein (1943) suggested that the same result for shear flow coagulation could be used in estimating the coagulation of parti-cles inside turbulent agitators. The rate of strain should be replaced
by (s/v)1/2
Saffman and Turner (1956) calculated the coagulation rate in turbu-lent clouds of drops with sizes less than the Kolmogorov microscale by analyzing the flow field around a drop. They found the same functional form for the coagulation rate as that suggested by Camp and Stein (1943) with a different proportionality constant.
Finally, Levich (1962) extended the Brownian diffusion model in
turbulent motion coagulation and estimated the coagulation rate of
colloidal particles. His results agree with the predictions of previous investigators, but the proportionality constant is approximately one
order of magnitude larger. This discrepancy may be attributed to the inability of a steady diffusion model to correctly describe the relative
particle motion in turbulent flows due to the non-Markovian nature of the
turbulent dispersion process.
In this work we propose a simple kinetic model for the coagulatio. between particles in isotropic turbulent flows that accounts for the statistical nature of particle transport. This model can predict the
coagulation rate between particles of various sizes in an isotropic turbulent flow.
2.3 Monodisperse Systems
In order to better understand the physics, we consider here a dis-persion consisting of equal size spherical particles in a liquid medium.
According to simple kinetic theory concepts, the volume swept by a particle pei unit time in a collision between particles is
w(v,v) =
rd
2ur .
(2-9)
Here ur is the root mean square relative particle velocity during colli-sion, v is the volume of each particle, and (ud2) is the collision cross section.
The coagulation rate between particles will be given by
w
= 1/2 w(v,v) N (2-10)where N is the number particle density, and the factor 1/2 ensures that each collision is counted only once.
It follows that the variation of the particle number density with time will be
=- WN .(2-11)
dt~
The relative turbulent velocity introduced in Equation (2-9) is a
function of the distance between particles during collision. It is equal
to the square root of the second-order correlation of the turbulent
velocity difference between two points at a distance of a particle diameter
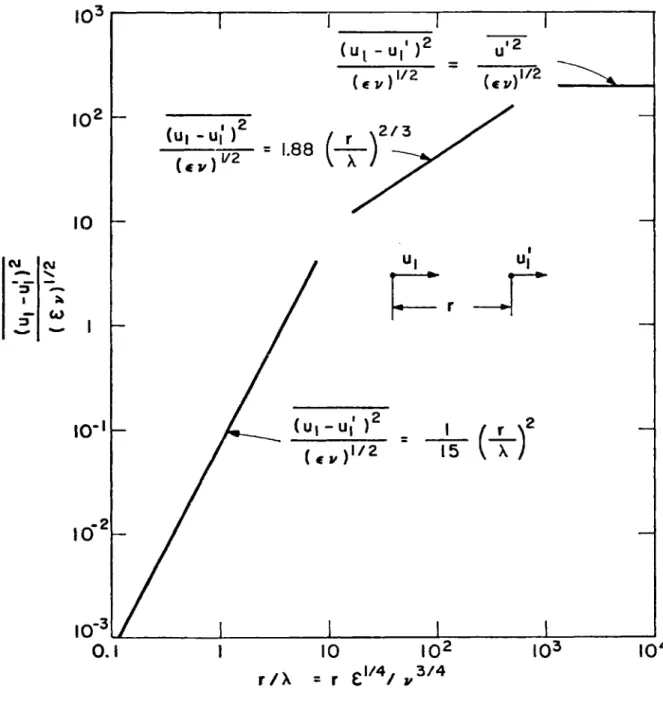
in an isotropic turbulent flow. The second-order correlation of the turbulent velocity difference between two points is calculated from Kolmogorov's similarity theory (Rotta (1972)), and it is depicted in Figure 1. In this figure (u1 - u{) is the difference of the turbulent
velocity components at two points at an arbitrary distance r along the vector joining the two points. The characteristic veloaity implied in
-21-Uk = (Ev)1/4 . (2-12)
The Eulenian macroscale of turbulence L is taken one thousand times larger than the Kolmogorov microscale A.
The relative velocity between particles during collision, ur' can now be approximated by
Ur=~((u 1-u') 2)1/2 (2-13)
It is not possible to calculate the exact value of ur. We may assume that each cartesian component of the relative velocity between
two points in isotropic turbulence has a Gaussian probability distribu-tion. This is approximately corroborated from the experiments by
Townsend (1947) and Van Atta and Park (1972). If we further assume that the turbulent relative velocity components between two points are sta-tistically independent, we may find, using methods similar to classical gas kinetic theory, that the reJative particle velocity is equal to the
value given in Equation (2-13) multiplied by a factor
2/2_7
= 1.59.Since the relative velocity components can never be considered
statisti-cally independent (Rotta (1972)), and since we cannot account for the
exact velocity distribution functions, we use in what follows the approxi-mate expression of Equation (2-13) in evaluating the coagulation rates.
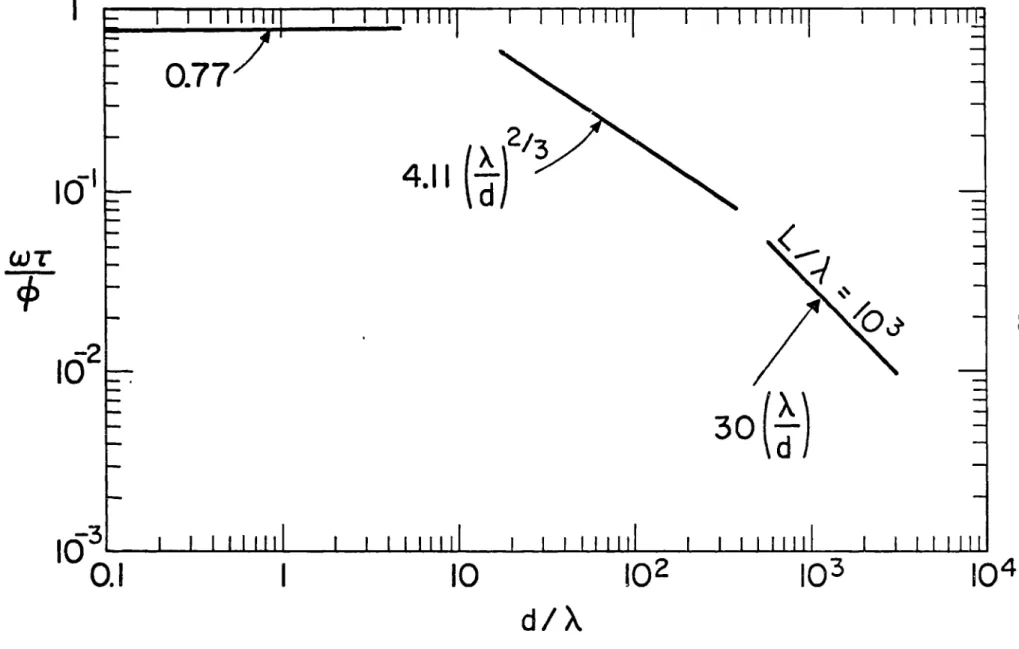
Thus from Equation (2-10) and using Equation (2-13) and the results depicted in Figure 1, we find after some rearrangements that the coagula-tion rate is
W = 0.77 ford<X(2-14)
T= 4.ll(A/d)2/3 for d > A (2-15)
= 3(L)1/3 A/d d'L . (2-16)
In the above equations the volume fraction of the dispersed phase is
$ = 7r/f6 d N . (2-17)
The results given by Equations (2-14), (2-15), and (2-16) are plotted in Figure 2. In this plot L = 10 A.
In many practical applications the size of colloidal particles is less than the Kolmogorov microscale, and Equation (2-14) is applicable.
For example, in order to have A = 10pm the required rate of turbulent energy dissipation per unit mass in an aqueous dispersion is
3
E=
L4=
106 erg/sec - gm . (2-18)This corresponds to a practically tremendous energy input.
Finally, Equation (2-15) will be applicable only in cases when an
inertial subrange of turbulence exists, namely, when L >> X (Rotta (1972)).
2.4 Polydisperse Systems
It is straightforward to write a kinetic equation for the change of
the particle number density with time in a polydisperse two-phase system.
This has already been done by previous investigators for Brownian motion
and shear flow (see, e.g., Swift and Friedlander (1964)).
We assume the particle size distribution to be given by a
continu-ous function n(v,t), so that n(v,t) Av be the number of particles per unit volume of the continuous phase at time t with volumes between v and v + Av.
-23-Let also w(v,v') be the volume collision frequency between particles with volumes v and v', that is, the volume swept per unit time in
their relative motion during collision.
Then in similarity to Equation (2-9) and in accordance with our simple kinetic model
w(v,v') Tr d + d')2 ur (2-19)
Here d,d' are the diameters of particles of volumes v an v', respectively. The relative velocity introduced in Equation (2-19) will be equal to
U ((u - U')2)1/2(2-20) d + d'
r =- 2
Following previous erperience (Swift and Friedlander (1964)), the evolution of the particle size distribution with time is
dn(v,t) = 1/2
ft
w(v',v - v') n(v',t) n(v - v',t) dv' - fV w(vv')dt 0 0
n(v,t) n(v',t) dv' . (2-21)
To write this equation we have made use of the assumptions that only binary collisions take place, and no breakup of particles is probable.
The total particle number density is
N =
f
n(vt) dv , (2-22)and the volume fraction of the dispersed phase $ is
* = N V = f vn(v,t) dv (2-23)
Integrating Equation (2-21) with respect to v, the change of the total particle density is
=
I
f f w(v,v') n(v,t) n(v',t) dv dv' . (2-24)dt 2 0 0
This equation degenerates to the simpler Equation (2-11) for mono-disperse systems.
Equations (2-21) and (2-24) are quite general for various particle sizes if the appropriate volume collision frequency is selected from
Equations (2-19) and (2-20).
Using dimensionless parameters we can simplify Equation (2-24). The proper dimensionless volume and particle size distribution suggested by Swift and Friedlander (1964) are
vN d(2-25)
$ n(v,t) (2-26)
N
The dimensionless particle size distribution satisfies the relations
(cf. Equations (2-22) and (2-23))
f
0 0(gt) dE = 1 (2-27)E
ip$(Gt)
dt = 1 . (2-28)It follows that Equation (2-24) may be rewritten using Equations (2-25) and (2-26) as
-25-Equation (2-29) is further simplified to the form
dN= - wN A(t) (2-30)
dt
where the appropriate volume collision rate w(v,v') (Equation (2-19) has been used. Here w is the coagulation rate corresponding to a mono-disperse system with the same volume fraction of the dispersed phase P, and A(t) is a correction factor due to polydispersity.
For the most important case of colloidal dispersions with particle sizes less than the Kolmogorov microscale, the correction factor A(t)
takes the simple form
A(t) = 3( + 4'1/3)3 p(,t) (',t) d d' . (2-31)
Using the following algebraic inequalities
(4 +
4')
< (1/3 + ,1/3)3 4 4( +')
, (2-32)it'can be proved that
0.25 4 A(t)C 1. (2-33)
The correction factor A(t) is equal to one for monodisperse systems, and it will take the minimum value 0.25 for a system consisting of two
monodisperse systems with widely differing volume fractions and widely
differing particle number densities in the inverse order. An outline
of the proof is given is Appendix A.
In general the polydisperseness coefficient A(t) will be a function
of time, except for the case the dimensionless particle size distribution is independent of time, namely, when there is a similarity solution for the particle size distribution (Swift and Friedlander (1964)).
In a recent paper (Pulvermacher and Ruckenstein (1974)), it has been proved that such a solution cannot exist for the collision function
(41/3
+ 11/3)3 implied in Equation (2-31).2.5 Comparison of Turbulent Coagulation Rates with Brownian and Shear Flow Coagulation Rates
In the previous two sections it was tacitly assumed that only
turbulent coagulation is present or that Brownian or shear flow coagula-tion are negligible. The conditions for which the latter statement is true are developed in this section.
Turbulent action dominates when the relevant length scale of a phenomenon is much larger than the molecular dimensions. This means
that for length scales less than a size, which has to be defined for each phenomenon, Brownian motion resulting from molecular interactions
will be solely significant.
In a coagulation process turbulent flow will dominate compared to Brownian motion when the turbulent coagulation time is less than the Brownian coagulation time. In the following analysis we assume a mono-disperse and homogeneous dispersion.
The turbulent coagulation time is the inverse of the coagulation rate given in Equation (2-14), and the Brownian coagulation time (Levich
(1962)) is
rd3
T = BkT4 .(2-34)
Br 8 kT
Here p is the viscosity of the continuous phase, k the Boltzmann constant, and T the absolute temperature of the dispersion. For a dispersion in water at room temperature (6 = 200 C),
-27-T = 0.97 - 1011 d- (2-35)
Br
where d has dimensions of cm and TBr of sec. The turbulent coagulation time is,
= 1.30 , (2-36)
c
and the condition that turbulent coagulation dominates is expressed by the relation
T _10.4 kT __-_ 1 .(2-37)
TBr //d3 l
For a dispersion in water Equation (2-37) leads to
d > 2.37 - 10 /6 (2-38)
E
Here d is in cm, V in cm2/sec, and E in erg/sec - gm.
The interaction between turbulent and shear flow coagulation is very complicated, and a detailed analysis is out of the scope of the present thesis. The coagulation of particles will be affected both by the turbulent fluctuating motion and the local shear flow. The proper dimensionless number which expresses the ratio of shear flow to turbulent
transport is
T _= . (2-39)
e
Here G is the local rate of strain of the shear flow, and De is an effec-tive turbulent diffusion coefficient of the relaeffec-tive particle motion. The effective turbulent diffusion coefficient is approximately equal to
D ~f u d ~ /E=/r d d < X (2-40)
eff r
Df ~ ud ~ (sd)/ 3 d d >X . (2-41) ff r
Turbulent coagulation will dominate if the dimensionless group r in Equation (2-39) is less than one. This happens when
G <
AE/-d < X
(2-42)d < ()l/2 d>X . (2-43)
G
In shear flow turbulence there may be regions where turbulent and shear flow coagulation rates are of the same order of magnitude. There
is no reason to expect that turbulent motion and shear flow act independently in promoting the coagulation of particles. In the context of the present discussion it is remarkable to notice that Swift and Friedlander (1964) postulated in their work that Brownian and shear flow coagulation are additive, although this is devoid of any theoretical justification. Fur-ther experimental and theoretical work to study the coagulation of parti-cles in shear flow turbulence would be valuable.
2.6 Turbulent Coagulation in Partially Destabilized Systems
The statistical analysis of the previous sections has provided a
method for calculating the collision frequency between particles in a turbulent flow. It does not seem possible to extend this method
rigorously so that effects of interparticle potential repulsion are incorporated. The basic reason is that it is not feasible to describe
the interaction between particles in any detailed fashion, when potential forces are present.
-29-An alternative method would be to use a diffusion model to describe the coagulation and then follow the analysis suggested by Fuchs (1934) to incorporate in it interparticle potential effects. Levich (1962) proposed a diffusion model for turbulent coagulation in fully destabi-lized systems. Although his results agree with Equation (2-14), except for the proportionality constant, the proposed diffusion equation is not theoretically justified. The underlying reason is that the relative dispersion of particles in turbulent flows is not a Markovian process, and the characteristic diffusion length scale has a wide spectrum from eddies of a particle diameter to the macroscale of turbulence (see Batchelor and Townsend (1956) and Roberts (1961)).
In a coagulation process of partially destabilized dispersed parti-cles, the coagulation is accomplished in the following way. Particles are transported by turbulent motion near another particle. For short interparticle distances the repulsive potential slows down the particle relative motion, and only a fraction of incoming particles succeeds in coagulating with another particle.
The interparticle potential energy can be characterized by a charac-teristic value W acting over a distance X from the particle surface.
o D
The characteristic value W0 may be taken typically equal to the maximum interparticle potential energy, while AD will be of the order of the
Debye length (Overbeek (1952)).
Based on dimensionless arguments it is seen that the retarded coagula-tion rate for a monodisperse system will have the form
A 14
WD = D
f n ( , ) . (2-44)
Here w is the coagulation rate of particles in a system fully destabi-lized, and F is the fluid mechanical force on a particle. For particles of size less than the Kolmogorov microscale, the fluid mechanical force is
F = 37rid ur (2-45)
where ur is the relative particle velocity (see Equation 2-9)), and the approximate sign in Equation (2-45) implies that the fluid mechanical forces may be reduced due to particle-particle interactions.
An estimate of the functional relation in Equation (2-44) for a mono-disperse system consisting of particles with size less than the Kolmogorov microscale is obtained in the following way. The relaxation time of the particle motion of micron size colloidal particles (cf Equation (2-4))
is less than the time (AD/ur) a particle would require to move a distance equal to the Debye length, while the Kolmogorov characteristic time of an eddy ((v/e)1/2) is much larger. Thus at short interparticle distances and for sufficiently small valuesof the potential energy W that Stokes flow conditions prevail, a relative velocity will be induced by the
poten-tial field
W
0
= D (3 w) (2-46)
P D
It follows that the instantaneous turbulent relative velocity between the particles during collision will be reduced by an amount equal to the induced velocity uD. Coagulation will take place whenever the instantane-ous turbulent relative particle velocity is absolutely larger than uD. For
small values of uD it can be found that the effective collision velocity
(ur )eff =Ur uD (2-47)
Using the simple kinetic model defined in Equation (2-10) with an effective collision cross section diameter d + AD = r and relative particle velocity given by Equation (2-47), we obtain the following
expression for the reduced coagulation rate
A 14
DL
2)(1_ 0 ) .(2-48)d 37rpd u r
r D
Equation (2-47) agrees with the general functional form in Equation (2-44) obtained from diamensionless arguments.
3. EXPERIMENTAL DESIGN AND APPARATUS 3.1 Purpose of the Experiment and General Description
Experiments were carried out in order to measure the coagulation rate of colloidal particles in turbulent flows. The fully developed turbulent flow inside a circular pipe was selected as the ambient flow field because its turbulent characteristics are long ago well known, and the flow is nearly isotropic in the core of the pipe (Laufer (1954)).
Commercially available latex particles were dispersed in water. They were selected because they have a narrow particle size distribution and consist of spherical neutrally buoyant particles.
The variation of the mean particle size and the particle size dis-tribution was obtained by measuring the particle size disdis-tribution of samples directly taken along the pipe flow with the Coulter Counter (Wachtel and La Mer (1962)).
The initial particle size and their concentration, the degree of their destabilization and the pipe flow rate were varied in the course of the present experiments
3.2 Flow System
In designing the flow system the following considerations were taken into account:
1. The pipe flow rate should be constant.
2. The water should be free of interfering contaminants.
3. The flow should be fully developed.
4. Full mixing of the emulsion and the destabilizer with the water in the pipe flow should be ensured before any samples were withdrawn.
-33-5. The length of the pipe should be selected in such a way that a measurable degree of coagulation takes place along the pipe.
A general view of the experimental setup is shown in Figure 3. The flow was established by means of a suitable commercial centrifugal pump. The flow rate was kept constant by virtue of an overflow tank shown in Figure 3. A rotameter, located after the pump, was calibrated to measure the flow rate with accuracy +_ 1 per cent of the full scale. The rotameter had a range from 2 gpm to 17 gpm (manufacturer Fisher and Porter).
Two honeycomb filters were used to clean the supply water from foreign particles. Moreover, in order to minimize the quantity of
con-taminants in the system, all components were carefully cleaned before assembling them. Water was then run through the system for one month before measurements were made. Samples of clean water were regularly withdrawn from the system and analyzed by the Coulter Counter. The
measured total number density of particulate matter in water was typically found to be 106 particles/cm , which was four orders of magnitude less than the typical number density of latex particles in an experimental run
(approximately 10 particles/cm3). We decided to neglect this correc-tion since the error in measuring the particle number density with the Coulter Counter is higher.
Lucite pipe of 1-inch inside diameter (measured with accuracy of
t 0.5 per cent) and a total length of 24 feet was used in order to have visual observation of the flow. Measurements of the pressure drop inside
friction coefficient was the same as the one given by standard frictional resistance curves in smooth pipes (see, e.g., Schlichting (1968)). The !nlet pipe length was selected so that fully developed turbulent flow pre-vails in the test section (see, e.g., Schlichting (1968)). The disturbance of the turbulent flow due to the bends was estimated to be small (see, e.g., Schlichting (1968) note on p. 540).
The pipeline after the position II in Figure 3 was made of five pipe segments of variable length connected together with plastic joints. The ends of these pipe segments were tapered so that smooth fitting with the plastic joints would be insured.
3.3 Injection Stations
The stable latex emulsion was injected into the pipe flow at posi-tion I, as it is shown in Figure 3. The emulsion of known concentration was directly released into the pipe from a pressurized tank through a
solenoid valve actuated by an electric timer shown in Figure 3. The flow rate of the emulsion from the tank into the pipe flow was calculated by measuring the volume withdrawn from the tank in a specified time interval
set by the electric timer. The volume fraction of the dispersed phase in the pipe flow could then be readily calculated.
The destabilizer was released into the pipe flow at position II
after complete mixing of the emulsion with the water was ensured. The distance between injection ports I and II was sixty times the pipe
diame-ter, enough length for complete mixing to take place (see Brodkey (1966)).
The injection system for the destabilizer was similar to the one used for the emulsion except for the injection port at II. A special
-35-destabilizer with the pipe flow. The destabilizer was injected at an angle counter to the pipe flow along the circumference of the pipe cross section. Gross visual observations of the mixing process using a dye showed that complete mixing took place in a distance of approximately fifteen pipe diameters. From similar experimental arrangements (see
Hartung and Hiby (1972)) it was found that mixing is practically com-pleted at a distance of ten pipe diameters from the injection port. The associated mixing time was always much less (approximately one order of magnitude) than the characteristic coagulation time. Thus the effects of inhomogeneous mixing of the destabilizer with the pipe flow could be neglected.
3.4 Sampling Stations
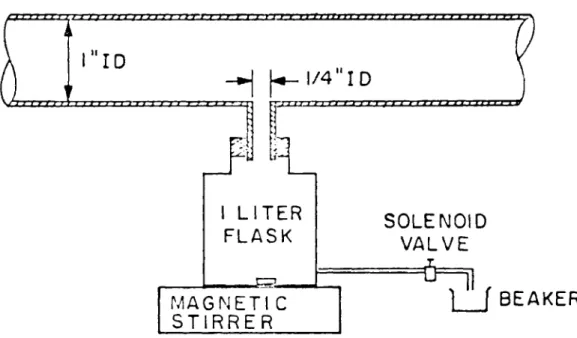
Samples from the pipe were withdrawn at five stations along the pipe shown in Figure 3. A sketch of a typical station is shown in Figure 5.
Withdrawal of the dispersion from the pipe was obtained through a copper pipette (1/4-inch inside diameter and 1-inch length) starting from the pipe wall. The sample was directly diluted in a 1-liter glass flask containing water twice filtered. A solenoid valve at each station controlled the withdrawal time, typically less than one second. The quantity withdrawn was measured by collecting the displaced water from the flask in a beaker located after the solenoid valve. Mild mixing of the sample entering the flask was provided by a magnetic stirrer shown in Figure 5.
The following problems were looked at when the sampling stations
1. The degree of coagulation of the emulsion in the sample during the flow inside the copper pipette was estimated to be less than 1 per cent of the particle number density. For a typical experiment the velocity inside the pipette was 500 cm/sec. This velocity was
calcu-lated by measuring the quantity withdrawn in a certain time interval at a sampling station. The associated characteristic time for coagula-tion was estimated 0.4 sec for a typical dispersion with volume frac-tion $ = 10-3, while the flow time through the pipette was 5 - 10-3 sec. It follows that the degree of coagulation in the pipette could be neglected inasmuch as the error in the measurement of the parti-cle number density with the Coulter Counter is larger (+ 3 per cent). 2. By diluting the sample directly in the 1-liter flask, further
coagula-tion of the dispersed phase by Brownian mocoagula-tion was minimized. The corresponding Brownian coagulation time was very large because the emulsion was very dilute in the flask (0 = 10-5), and the
concentra-tion of the destabilizer was simultaneously lowered due to diluconcentra-tion. No coagulation was measured to take place inside the flasks.
3. Diffusion from the pipe to the flasks, when the solenoid valves were closed, was measured to be negligible. This was checked by visual observation and by measuring the particle number density inside the flasks by means of the Coulter Counter.
4. Finally by selecting the diameter of the pipette (1/4-inch) to be
larger than the pipe boundary layer and by increasing the pressure of the system so that the withdrawal velocity (500 cm/sec) was
-37-that the sample withdrawn was representative of the conditions
pre-vailing in the core of the fully developed turbulent pipe flow. 3.5 Particle Number Density Analysis
An excellent survey of the different ways of measuring particle or drop size distributions is given by Carver (1971), wherein seventeen
particle analyzers have been listed. We decided that the Coulter Counter was the most suitable method for the present experiments. An excellent description of this method can be found in the paper by Wachtel and La Mer (1962), while an in-depth analysis of its operation is given in
the paper by Colibersuch (1972).
The theory behind the operation of the Coulter Counter is quite simple. The dispersed particles suspended in 1 per cent aqueous solu-tion of sodium chloride are forced to flow through a small aperture having an immersed electrode on each side. As each particle passes through the aperture, it replaces a volume of an electrolyte equal to its own value within the aperture, thus momentarily changing the resist-ance between the electrodes. This produces a voltage pulse of short duration having a magnitude proportional to the particle volume. The
resulting series of pulses is electronically amplified, rated, and counted. Thus not only the total number of particles in a measured volume are
counted for each sample, but their size distribution can also be measured. Apertures of different sizes can be used for different ranges of particle
sizes.
In the present experiments we had to use a relatively old model
Extensive electronic noise from electromagnetic radiation generated by other laboratory equipment was eliminated by shielding the Coulter Counter. Aperture tube sizes of 19 pm, 50 pm, 200 pm were used in the
present experiments. An aperture tube can measure particles with diameters ranging from 2 per cent to 40 per cent of its size.
The 1 per cent aqueous solution of sodium chloride was twice
filtered through a Millipore filter of 0.1 pm pore size (Millipore Co.,
lss.) to avoid any background count.
Calibration of the Coulter Counter was done using prototype mono-disperse particles supplied by the manufacturer of the equipment. It is based on the proportionality of the response to the volume of the particles. For the 19p tube the proportionality constant, using 0.8 pm Dow latex particles, was found to be 6.8 x 10- (PM)3/indication of the
equipment.
The actual particle size analysis of each sample was carried in a standard way. In each stage the degree of dilution was known, so that from the final measurements in the Coulter Counter, the number particle density in the pipe flow could be estimated. The Coulter Counter measures directly the cumulative particle size distribution in discrete steps. The cumulative particle size distribution gives the number of particles with volumes equal to or larger than a speci-fied particle volume.
Finally, the maximum error in the counting of dispersed particles by the Coulter Counter was found to be + 3 per cent deduced from
-39-3.6 Choice of Dispersed Particles
Several types of dispersed systems were under consideration before this experimental work started. It was decided that latex particles dispersed in water were the most suitable. These latex particles are commercially available, have relatively narrow particle size distribution, and are spherical.
From preliminary estimations and experiments using the flow systems described previously, it was found that a quantity of water 200 cm3 in volume with 10 per cent concentration in latex particles was needed for a particular run, so that a measurable degree of coagulation would take place in our system. This consumption of the latex particle dispersion made prohibitively expensive the use of uniforn latex emulsions supplied by Dow Chemical or Particle Information Service. Instead we used a much more amenable acrylic latex dispersion supplied by UCAR Co. with the
commercial name UCAR Latex 878.
Its average particle diameter was directly measured by taking an
electronmicrograph of the dispersed particles and by analyzing the
dis-persion by means of the Coulter Counter. The average particle diameter was measured to be 0.59 pm with standard deviation 0.07 pm. The mean
3
particle volume defined in Equation (2-23) was estimated to be 0.15 (pm)
The density of the dispersed particles, invoked from measurements of the
3
emulsion density, was 1.15 gm/cm3. The concentration in weight of the stock supplied by the manufacturer (50.8 per cent) was measured repeatedly
by drying a certain quantity of the emulsion (see, e.g., Blackley (1966)). 3.7 Preparation and Destabilization of the Latex Polymer Emulsion
It is generally accepted (Van den Hul and Wanderhoff (1970)) that
intrinsic properties and the emulsifier imposed by the manufacturer to insure stability of the dispersion for a long time. In the present experiments the emulsion was diluted with distilled filtered water to a concentration 10 per cent in weight and was stored in the emulsion
tank at least one day before an experiment was run.
After preliminary experimentation with salts and acids as destabili-zers, the most effective destabilizer for the acrylic latex used in
these experiments was a mixture of ICl and CaCl2. An aqueous solution of 1M/lt HC1 and 5.6 t4/lt CaCl2 was used in all experiments. The density of this solution was measured to be 1.38 gm/cm . The volumetric
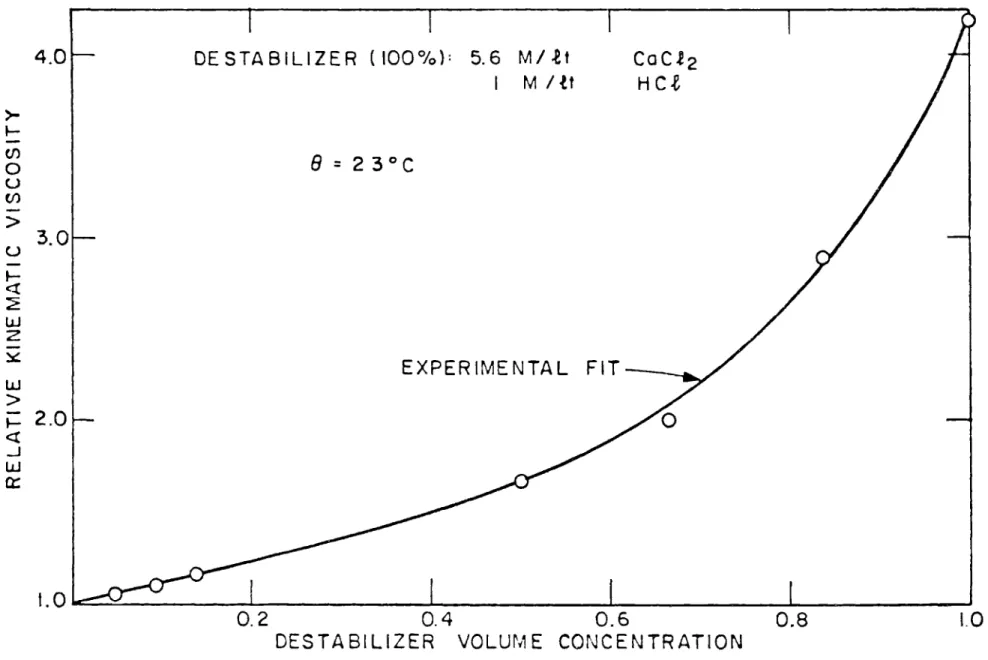
concen-tration of the above solution inside the turbulent pipe flow varied from 1 per cent to 10 per cent. The change of the physical parameters of the system due to the mixing of the destabilizer was measured prior to the analysis of the experimental results. The density of the continuous phase varied from 1 gm/cm for pure water to 1.038 gm/cm for the maximum con-centration of the destabilizer. The viscosity of the mixture in the pipe was measured by a Cannon-Fenske viscometer in a precision tempera-ture control viscosity bath supplied by Precision Scientific Co. (Chicago). Figure 6 depicts the relative kinematic viscosity vs. the destabilizer volume concentration of the above mixture at a typical temperature of 230 C. From this figure it is seen that the kinematic viscosity varied only slightly, namely, from 1 to 1.1 cm2/sec for the range of the destabili-zer concentrations used in these experiments.
The influence of the destabilizer on the surface properties of the latex particles in thermal equilibrium was investigated by measuring
-41-their Brownian coagulation rates for varying destabilizer concentrations and the zeta surface potential for destabilizer concentrations near the one corresponding to zero surface charge effects. These results are presented in the next chapter.
3.8 Experimental Procedure
A typical experimental run was carried out in the following way. Constant flow rate was established by means of the overflow tank shown in Figure 3. The flow rate was measured by the rotameter also shown in Figure 3.
Injection of the emulsion and the destabilizer from the respective pressurized tanks was obtained automatically by a timer through two solenoid valves. A typical injection time was 10 sec and was selected so that steady flow conditions prevailed between sampling stations one to five (see Figure 3) before a sample was withdrawn.
Samples at stations one to five were taken through solenoid valves near the end of the injection period for a typical time less than one second. The quantity sampled at each station was invoked by measuring the water displaced from each flask.
A measured quantity from each flask was next diluted in a beaker containing 120 cm3 of an aqueous solution of 1 per cent sodium chloride. Finally these samples were used to directly measure the particle size distribution with the Coulter Counter.
Further information concerning exact dimensions of the experimental components is presented in Table I (page 78).
4. PRESENTATION AND DISCUSSION OF RESULTS 4.1 Characteristics of Turbulent Pipe Flow
Before correlating the experimental results of turbulent coagula-tion rata, the turbulent characteristics, as energy dissipacoagula-tion per unit mass, Kolmogorov time scale and Kolmogorov microscale of turbulence inside the pipe flow had to be known. Fortunately the fully developed
turbulent pipe flow has been extensively investigated (Rotta (1972)). Considerable effort has been made in this work to ensure that the flow was fully developed along the test section as we have already described
in the Section 3.2.
According to the classical experiments by Laufer (1954), the fully developed turbulent pipe flow is approximately isotropic up to 90 per cent of the radius from the pipe axis. In the present experiments the sampling method was designed, as it has been described in the Section 3.4, so that a sample representative mostly of the conditions prevailing in the core of the pipe was withdrawn. Hence the turbulent characteristics at the core of the pipe were used in correlating the experimental results.
The rate of turbulent energy dissipation per unit mass at the core
of the pipe flow (Laufer (1954)) is
3
u*
E: = 4 -- .(4-1)
D p
Here u* is the friction velocity, and Dp is the pipe diameter. The
fric-tion velocity is given by
-43-where U is the average pipe velocity, and f is the turbulent friction coefficient for smooth pipes
f = 0.316 (4-3)
1/4 Re
It follows that, for a certain flow rate and pipe diameter, the
3
Kolmogorov microscale ((3) 4) and the time scale ((2)1/2) of turbulence
E E
at the core of the pipe can be readily estimated.
4.2 Brownian Coagulation Rate and Particle Surface Potential
Experiments to measure the Brownian coagulation rate were conducted in parallel with the turbulent coagulation experiments using the same latex dispersion. The purpose of these experiments was twofold. First, the value of the destabilizer concentration for which the dispersion becomes fully destabilized can be defined, and second, the values of Brownian coagulation rates can be compared with the turbulent coagulation rates under similar destabilizer concentrations.
Neglecting viscous interactions during particle collisions (see, e.g., Spielman (1970)), the change of particle number density with time
in a Brownian coagulation process (Smoluchowski (1916)) is
dt
The volume Brownian coagulation rate b is equal to
b-4kT (4-5)
3p'
For room temperatures (200 C) and dispersions in water, the value
-12 3 of bis 5.4 x10 cm /sec.
Equation (4-4) also describes the particle number density evolu-tion with time in partially destabilized dispersions, the coefficient on the right-hand side taking on a smaller value (Swift and Friedlander
(1964)).
The particle size distributions in the Brownian coagulation experi-ments were measured by means of the Coulter Counter where samples taken
from a beaker at specified time intervals were analyzed. The volumetric destabilizer concentration varied from 1 per cent to 10 per cent and
the volume fraction of the dispersed phase from 10 to 10
Figures 7 and 8 show the measured experimental inverse particle number density vs. time for two different destabilizer concentrations. The associated value of the coefficient b is also given.
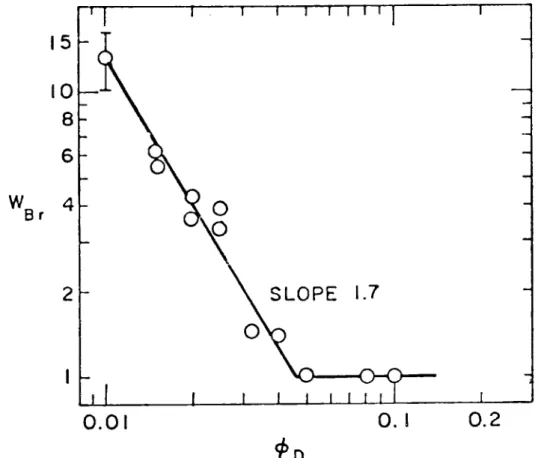
The ratio of the volume Brownian coagulation rate (b) for a fully destabilized dispersion to the value for a partially destabilized dis-persion is called stability factor WBr of the disdis-persion (Reerink and Overbeek (1954)). A log-log plot of the stability factor vs. the
destabilizer concentration is shown in Figure 9. A linear experimental fit according to theoretical analysis (Reerink and Overbeek (1954)) and previous related experience (Ottewilland Shaw (1966)) is also drawn in this figure. The slope of this line is 1.7.
From this figure it is deduced that full destabilization of the dispersion is expected for destabilizer concentrations larger than 4.5 per cent.
Measurements of the potential, usually denoted as zeta potential, of the latex particles were attempted for destabilizer volumetric
-45-concentrations 1 per cent to 10 per cent by the method described in Black and Smith (1962). The zeta potential was found to be very small in this range of destabilizer concentrations, approximately - 1.5 mV
with an estimated error + 30per cent.
In Appendix B an estimate of the Brownian stability factor near the destabilizer concentration necessary for full destabilization of the dispersion is obtained.
The apparent zero surface charge, where the zeta potential is equal to zero, observed here, may be due to both an essentially charge-less surface and the ionic strength acting to swamp the surface poten-tial (see, e.g., Ottewil and Watanabe (1960)).
4.3 Turbulent Coagulation Rate Experiments
In the present experiments the pipe flow rate varied from 5 gpm to 15 gpm, the volume fraction of the dispersed phase from 0.1 per cent to 0.5 per cent, and the volumetric destabilizer concentration from 1 per cent to 10 per cent. The particles used in the experiments described in this section had always a diameter less than the Kolmogorov microscale.
Samples were taken at each sampling station (see Figure 3) and
analyzed with the Coulter Counter. The Coulter Counter measures directly the cumulative particle size distribution
N = f n(v) dv (4-6)
V v
which represents the number density of particles with volume larger than the volume v.
A typical set of experimental results for the cumulative particle size distribution is presented in Figure 10. It was checked that the
volume fraction of the dispersed phase remained constant along the
pipe.
In Figure 11 the experimental results of the cumulative particle size distribution are plotted in dimensionless variables, see Equations
(2-25) and (2-26). From this plot it is seen that the particle size distribution remains similar to the initial particle distribution at
station one. Due to the limited length of the pipe no experiments could be run to test whether the particle size distribution remains
self similar for times much larger than the characteristic coagulation time.
Recent analytical studies by Pulvermacher and Ruckestein (1974) have shown that for the present collision function in Equation (2-31),
there cannot exist a self-similar solution. Instead, the dimensionless particle size distribution $(C,t) (see Equation (2-26)) is an explicit function of time.
Nevertheless, in the present experiments, as we mentioned previ-ously, the particle size distribution remains approximately similar to the initial particle size distribution. This means that the polydispers-ness factor A(t) (see Equation (2-31)) is approximately constant. Using the curve of Figure 11, passing through the experimental results, we compute that
A(t) = 0.90 . (4-7)
In Figures 12, 13, and 14 the measured total particle number density is plotted vs. distance along the pipe flow for different flow rates.