Publisher’s version / Version de l'éditeur:
Vous avez des questions? Nous pouvons vous aider. Pour communiquer directement avec un auteur, consultez la première page de la revue dans laquelle son article a été publié afin de trouver ses coordonnées. Si vous n’arrivez pas à les repérer, communiquez avec nous à [email protected].
Questions? Contact the NRC Publications Archive team at
[email protected]. If you wish to email the authors directly, please see the first page of the publication for their contact information.
https://publications-cnrc.canada.ca/fra/droits
L’accès à ce site Web et l’utilisation de son contenu sont assujettis aux conditions présentées dans le site LISEZ CES CONDITIONS ATTENTIVEMENT AVANT D’UTILISER CE SITE WEB.
Building Research Note, 1984-05
READ THESE TERMS AND CONDITIONS CAREFULLY BEFORE USING THIS WEBSITE. https://nrc-publications.canada.ca/eng/copyright
NRC Publications Archive Record / Notice des Archives des publications du CNRC :
https://nrc-publications.canada.ca/eng/view/object/?id=b8320768-b8c7-4459-bb0b-2650dd7d1622 https://publications-cnrc.canada.ca/fra/voir/objet/?id=b8320768-b8c7-4459-bb0b-2650dd7d1622
NRC Publications Archive
Archives des publications du CNRC
This publication could be one of several versions: author’s original, accepted manuscript or the publisher’s version. / La version de cette publication peut être l’une des suivantes : la version prépublication de l’auteur, la version acceptée du manuscrit ou la version de l’éditeur.
For the publisher’s version, please access the DOI link below./ Pour consulter la version de l’éditeur, utilisez le lien DOI ci-dessous.
https://doi.org/10.4224/40000505
Access and use of this website and the material on it are subject to the Terms and Conditions set forth at
NRCC passive solar test facility performance of direct-gain units
Ser
m
392 LSSA 0701-5232
NRCC PASSIVE SOLAR TEST FACILITY
PERFORMANCE
OF
DIRECFGAIW UNITSS.A. Barakat
D i v i s i o n of B u i l d i n g Research, National Research CouncFl of Canada
NATIONAL RESEARCH COUNCIL CANADA D I V I S I O N OF
BUILDING RESEARCH
NRCC PASSIVE
SOLAR TEST
FACILITY PERFORMANCE OF DIRECT-GAIN UNITSS . A . Barakat:
Ottawa May 1984
NRCC PASSIVE SOLAR TEST FACILITY PERFORMANCE OF DIRECT-GAIN UNITS
SUMMARY
Experimental data collected for t w o heating s e a s o n s at the p a s s i v e
s o l a r t e s t f a c i l i t y o f the D t v i s i o n o f Building Research are presented f o r
three two-zone and four single-zone direct-gafn u n i t s . The e f f e c t s of solar gaFn, thermal storage mass and b u i l d t n g thermal load o n t h e utilization of solar galns to satisfy the space heating requirement are examined. The use o f t h e experimental d a t a f o r verifying energy-related c a l c u l a t i o n s
for
d i r e c t - g a i n passive s o l a r houses is illustrated.In
a direct-gain system, additional thermal mass (in e x c e s s of t h a tnormally found i n a woo&£ rame house) produces only
a
modest reduction in purchased space heating energy but does lead to improved comfort c o n d i t i o n s in the space (less overheating). B o t h t h e s e improvementsin
performance, however, a r e more easily achieved by circulating the air between t h e south solar heated space and the remainder o f the b u i l d h g .1.
INTRODUCTIONThe passive solar t e s t
f a c i l i t y
contains t h r e e two-zonedirect
gatnu n i t s ( U n i t s 1 to 31, each consisting of a s o u ~ h and a n o r t h room
( e . g . , room IS and
1N
f o r U n i tI ) ,
and f o u r single-room direct-gain units(R1 t o R4). The construction d e t a i l s o f
all
u n i t s are g i v e n in Reference 1.Reference 1 also describes the data acquisition s y s t e m , presents the methad used to a n a l y s e the data to o b t a i n varTous performance factors a n d discusses
t h e uncertainties associa~ed with these f a c t o r s .
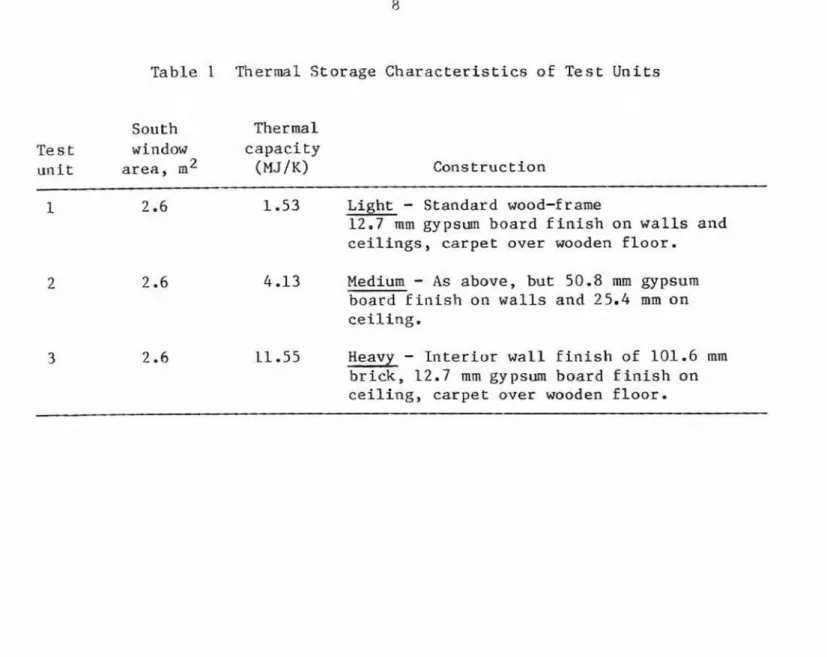
The b a s i c d i f f e r e n c e h e t w e e n t h e two-reorn u n i t s is their i n t e r n a l
storage mass, as given in Table 1. The four s l n g l r r o o m units each have the
same mass h u t each has a window f a c i n g one of the four cardinal d i r e c t i o n s . Each of t h e two-zone units w a s operated in two modes a l t e r n a t e l y for
t w w w e e k p e r i o d s . 51 Mode 1 , the unit is monf rored as t w o separate rooms
while
in Mode 2 the connecting door is opened and air circulated between t h et w o r o a m , using a small f a n above t h e door. Data gathered between
October land A p r i l 30 in 1980/81
and
1981182 were reduced using the methoddescribed in Reference
1
and are p r e s e n t e d i n T a b l e s 2 and3.
Data f o rs i n g l e room UnZts R I to
R4
are a l s o p r e s e n t e d . Far any u n i t , data aree l i m i n a t e d f o r any i n t e r v a l i f t h e y are i n c o m p l e t e due to equipment f a i l u r e .
The data in Tables 2 and 3 are examined in t h e fallowkng s e c t i o n s to assess t h e effects of various f a c t o r s on t h e performance of d i r e c ~ g a i n p a s s i v e
solar systems. The data are also used t o check energy calculation methods
f o r d i r e c t - g a i n p a s s i v e s o l a r houses.
2. PERFORMANCE FACTORS
The fallowing are the main factars used to describe the performance o f
the units. Details en these and other parameter c a l c a l a r i o n s a r e given in
Reference I. A l l factors are calculated over the heating season f o r each of the two modes o f o p e r a t i o n separately.
(1) Useful solar gain
This is the p o r t i o n of t h e s o l a r g a t n that contributes to the
reduction in t h e purchased heating requirement. Tt i n c l u d e s t h e solar g a i n u s e d t o o f Eset heat l o s s e s ,
plus
t h e p o r t i o n s t o r e d Fnt h e
thermal
mass and used t o offsetlosses
ata l a t e r
time. It d o e s not i n c l u d e the excess gain thatmust
be
vented to preventroom temperature from exceedtng
a
preset maximum, nor any gainu t i l i z e d to o f f s e t additional losses caused by a rise in room
temperature above t h e thermostat s e t t i n g .
(2) Reference heat l o s s
This is the heat loss calculated at thermostat s e t t i n g (20°C).
( 3 ) Gain-load ratio
,
GLRThis i s t h e ratio of solar gain t o the net h e a t i n g load
( 4 ) Mass-gain r a t i o , MGR
T h i s is t h e ratio of the thermal capacity of the unit t o t h e
average hourly solar gain.
It
r e f l e c t s t h e thermal storagecharacterlstlics o f each u n l t . ( 5 ) Solar utilization f a c t o r , Q
T h i s is t h e f r a c t i o n of tf;e t o t a l s o l a r g a i n t h a t c o n t r i b u t e s to a reduction of the heating requirement.
It i s , therefore, t h e
r a t i o o f t h e useful s o l a r g a i n to the t o t a l s o l a r g a i n .( 6 ) Purchased heating Eraction, F h
This
is t h e fraction af the n e t heatlng load (reference heat loss) of the building that is s u p p l i e d by the h e a t i n g system ( F ~ = 1-
Fs,
where Fs is the s o l a r h e a t i n g f r a c t i o n ).
3. RESULTS
3.1 Effect of thermal s t o r a ~ e mass
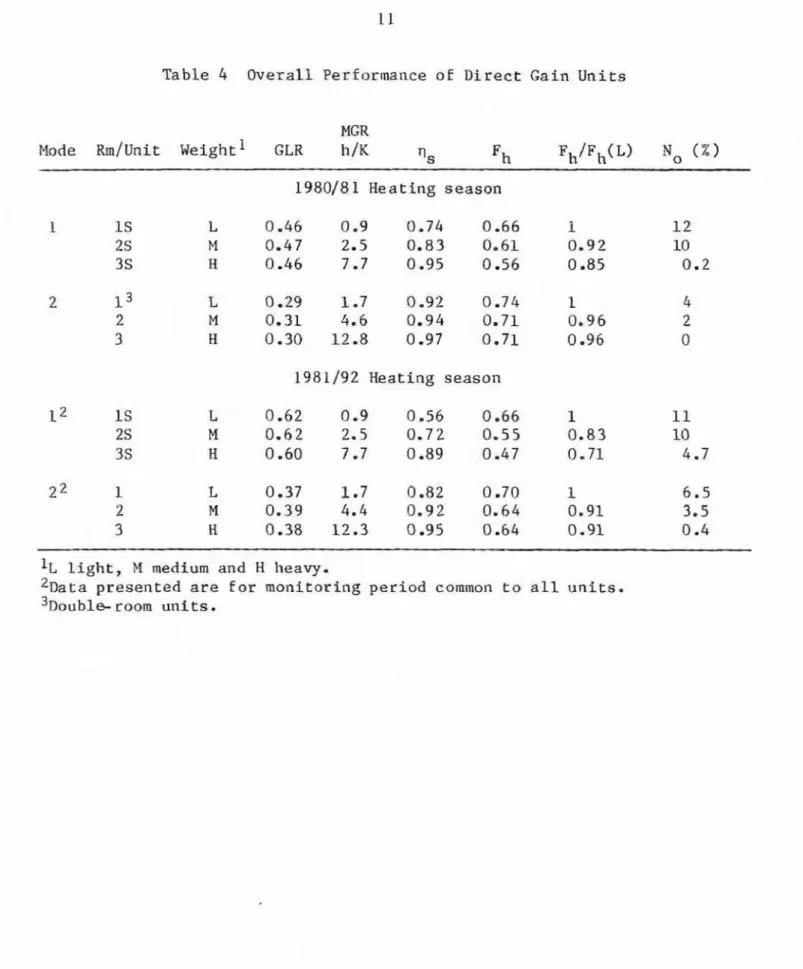
Table 4 summarizes the performance of the south rooms of t h e t e s t units
(15,
25 and 35) operated in Mode I (no inter-room a i r circulation) and o fthe double-room u n i t s o p e r a t e d fn Mode 2, f o r both h e a r i n g seasons. The d a t a are a l s o presented in F i g u r e s I and 2 in terms of the solar utilization factor and t h e purchased heating f r a c t i o n as functions of mass-gain r a t i o
(MGR). Units
1,
2
and 3 have the same solar g a i n and nearly t h e sameheating load, as i n d i c a t e d by t h e value of t h e gafn-load r a t i o (GLR), For rhe same gain-load r a t i a , the s o l a r atlllzation factor (qs)
increases and t h e purchased h e a t i n g fraction
IF^)
decreases w i t h increase inmass (MGR). The increase in TI is, however, relatively small c o n s i d e r i n g t h e magnitude of the i n c r e a s e i n
rterraal
mass; the e f f e c t is even less f o r Fh.With an eight-fold increase in thermal mass, the s o l a r utilization f a c t o r increased from 0 . 5 6 to
0.89;
and t h e purchased h e a t i n g f r a c t i o n decreasedf r o m 0 . 6 6 to 0.47 under the best combination of conditions. T h f s amounts t o
a 29 % r e d u c t i o n compared with t h e light-mass u n l t .
The
real b e n e f i t of mass i s the reduction in overheating, as i n d i c a t e d by the percentage of time the temperature in each room or unit w a s above25OC (No). While the light-mass units, operating in Mode 1, had
temperatures above
25OC
for 11-12 % of the t i m e during b a t h heating seasons,the heavy unit overheated (above 25°C) for l e s s than h a l f t h i s time in
1981/82 and almost never ( 0 . 2 % of the t %me)
in
the 1980J81 season.3.2 E f f e c t of b u i l d i n g load
In comparing data for a given test unit over two heating seasons
{approximately the same MGR)
,
s o l a r utilization factor decreases as GLR increases (the GLR was increased by adding i n s u l a t i o n between the 1980/81and 1981182 h e a t i n g seasons). T h i s difference in solar u t i l i z a t i o n is more
pronounced £ o r the u n i t s w i t h l o w thermal mass (low MGR). l k s p i t e the
r e d u c t i o n in solar u t i l i z a t l a n f a c t o r , t h e parchased heating f r a c t l o n also decreases because Lhe reduced useful solar gain satisfies a larger fraction o f the reduced h e a t i n g lead (i .e., higher solar heating f r a c t i o n ) . T h e
i s i n d i c a t e d by an increase I n the number of o v e r h e a t i n g hours i n 1981f82 f o r t h e heavy-mass unit i n Mode 1 and f o r a l l the units in Made 2 cornpared t o the corresponding u n i t s in 1980/8l (when t h e i r GLR was lower).
3.3 Effect of Interzone A i r C i r c u l a t i o n
Air exchange with the north room p r o v i d e s t w o benefits: a larger heating l a a d Fs a v a i l a b l e t o u t i l i z e t h e solar gain ( l o w e r GLR); and more mass is a v a i l a b l e f o r storing the excess g a i n s (higher MGR). Bath effects
tend to increase solar utilization.
Table 5 gives t h e performance parameters
(ns,
Ph) and percentageoverheating time (No) for U n i t s 1, 2 and 3 operating under both modes. The increase in
ns
(or decrease in Fh) due to a i r c i r c u l a r i o n is g r e a t e s t f o rt h e l i g h t e r units because t h e heavy unlts a l r e a d y have s i g n i f i c a n t thermal storage available in the south room. I n a l l units a i r circulation between rooms r e s u l t e d in a reduction in overhearing. For example, the percentage overheating t i m e decreased from 12% of t h e time to 4% f o r Unit 1 in
198018 1.
3 . 4
Effect
of Window O r i e n t a t i o nThe effect of reduced s o l a r gain due to window o r i e n t a t i o n is shown in Table 6 , which compares data
for
the four s i n g l e room units. These u n i t s have n e a r l y identical heating loads andthermal
storage characteristics. Asthe window orientation changes
from
south t o n o r t h , t h e reduction in s o l a r gain results in an increase in the solar utilizarian factor, but a l s o an increase in purchased heating fraction. A change in window o r i e n t a t i o n fromsouth t o e a s t o r west increases the purchased heating by about 7 and 9%
respectively. T h i s effect is somewhat underestimated because af t h e l o w
performance of Unit
l
U
( o n l y q = 0.59 and F = 0 . 6 8 ) due to i t s less than optimum ~ i n d o v s i z e . The r e s u f t s i n d i c a t e ,fi
owever. thatsmall
d e v i a t i o n s f r o m a southerly window orfentationwill
n o t have a major effect onpurchased energy. This c o n f i r m s previous f i n d i n g s which showed that
4 0
degrees o f f south w o u l d r e s u l t i n less than
4%
reduction of performance of a passive solar heating system (2),3.5 Window Effectiveness
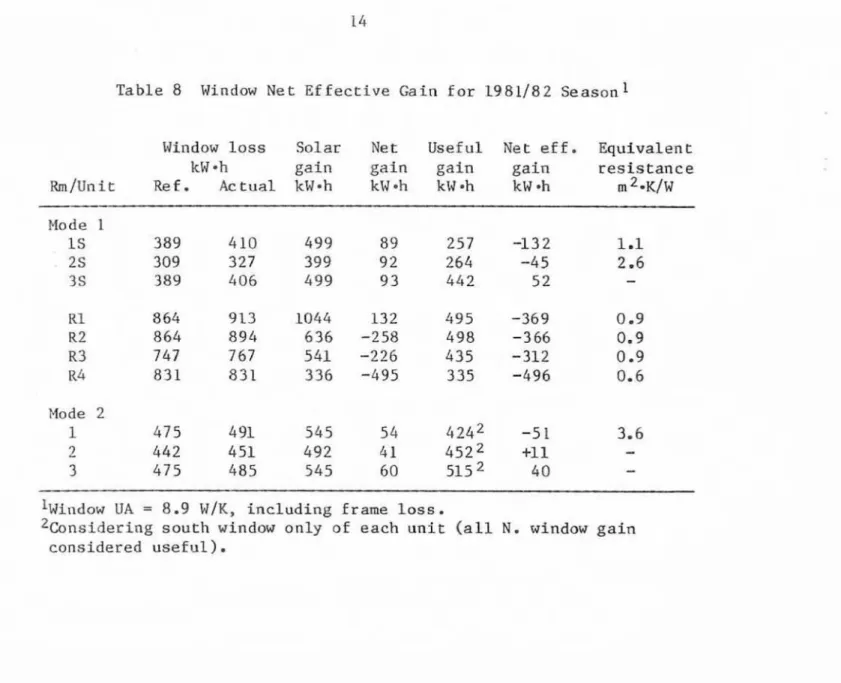
The net heat gain through a window, d e f i n e d a s s o l a r gain mlnus windaw reference lass*, is a measure of a window's p o t e n t i a l t o reduce the h e a t i n g requirement of a house. Over the heating season, south-oriented
d o u b l e g l a z e d windows p r o v i d e a n e t heat gain ta t h e apace if all t h e s o l a r
gain is used t o offset the heating requirement (1.e. q, = 1) ( 3 ) . For l a r g e
w i n d o w sizes, overheating nay occur and dumping of t h e excess solar g a i n
will reduce the n e t window contribution. Tn t h i s ; case a n e t e f f e c t i v e gain
can be d e f i n e d as the difference between t h e useful s o l a r galn and the
window reference loss. The net effective g a i n is a measure of the a c t u a l contribution of the window (or a passive system) t o t h e heating requirement of t h e space.
If
the net effective g a i n fs negative, t h e windaw r e s u l t s in a n e t heatloss.
If
t h e w i n d o w were replaced by an i n s u l a t e d w a l l which results in thesame heating requirement, t h e thermal resistance of such a wall is defined
as t h e equivalent wall r e s i s t a n c e (R ). e
Tables 7 and
8
g i v e the n e l h e a t gain, net e f f e c t f v e gain ande q u t v a l e n t wall r e s l s t a n c e f o r windows o f a l l d i r e c p g a i n units. For t h e
operating conditions studied
in
Ehe two h e a t i n g seasons, with the e x c e p t t o n of w i n d o w s in the heavy unit (3s) in Mode1
and t h e medium and heavy units( 2 and 3) in Mode 2, the windows were net energy losers. For the 1980181 s e a s o n , a greater reduction
in
e n e r g y consumption would have r e s u l t e d if thewindows of U n i t s IS, R1, R 2 ,
R3
and R4 were replaced by a wall section(RSI
2.1). F o r t h e 1981/82 season, all t h e w i n d o w s (except U n i t s 3S, 2 and3) would have heen outperEssmed by a w a l l s e c t i o n ( R S L 4.2). This is due to t h e lower utilization of solar energy as a result of increasing t h e GLR
(seducing r h e load).
VERIFICATION
OF ENERGYCALCULATION
METJ4ODSOne of the majar o b j e c t i v e s of the test f a c t l i t y is t o check the energy
consumpti on p r e d i c t i o n s of computer programs or s i m p l i f i e d procedures which take i n t o account solar gain and thermal storage.
A simpliEied calculation method ( 4 , 5 ) is a v a i l a b l e to p r e d i c t t h e s o l a r
u t i l i z a t i o n f a c t o r and h e a t i n g energy requfrement 0 E houses.
In
t h i smethod, values f o r
ns
and Fh were derived using an hour-by-hour computers i m u l a t i o n and p r e s e n t e d as a f u n c t i o n of GLR and MGR f o r different:
allowable rises i n roam temperature.
Table 9 compares values of TI,, F h and energy consumption measured d u r i n g t h e 1980J8L season f o r d i r e c t - g a i n u n i t s with calculated v a l u e s at t h e same values of GLR and MGR. The agreement I s good, w i t h a maximum
difference between the calculated and measured purchased heating of less Ehan 5%.
Figures 3 to 5 p r e s e n t a preliminary comparison between experimental
horlrly values o f room a i r r e v e r a t a r e and energy consumption w i t h values
c a l c u l a t e d u s i n g t h e ENCORE-CANADA Program (65 €or the s o u t h room o f U n i t 1. T h e ptel%m.lnary r e s u l t s indicate very good agreement between measured and c a l c u l a t e d values.
D e t a i l e d comparisons f o r ether units will b e presented in a future
report. In addition, hourly d a t a f r o m r h e t e s t f a c i l i t y were supplied t o
t h e participating countrfes of the International Energy Agency T a s k V111,
P a s s i v e and H y b r i d Lon Energy B u i l d i n g , t o be compared w i t h r e s u l t s produced
by several hourly computer simulation programs a s a p a r t of an Fnternarlonal
"validation" e f f o r t . Results oE t h i s work w i l l be p u b l f s h e d in an LEA report
.
5. CONCLUSIONS
Performance d a t a f o r seven direct-gain t e s t u n i t s have been p r e s e n t e d f o r two h e a t i n g seasons. The f o l l o w i n g conclusions can be i n f e r r e d f ram
(1)
In
direct-gainpassive
solar systems, an increaae inthermal
storage mass l e a d s t o a r e l a t i v e l y small r e d u c t i o n in purchased energy. Themain benefit of the increased thermal mass is a reduction in room overheating.
( 2 3
Air
circulation between the south and north zones of a houseleads
to areduction in both purchased enerm and overheatbg.
(3) Reduction in solar g a i n due to o f f - s o o t h ( S E or
SW)
orientation of d i r e c t - g a i n windows is p a r t l y compensated by an increase in solaru t i l i z a t t o n .
As a r e s u l t , the penalty in increased purchased heatingis
small (less than 10%). In some cases, however t h i s could cause thewindow to be a net energy loser.
( 4 ) Unless a south windew is p r o p e r l y s i z e d to achieve maximum utilization
of solar gain, t h e w i n d o w h e a t l o s s may exceed t h e u s e f u l solar g a i n and the window may be a net energy loser. If large window areas rmrstl be used, the window should have a h i g h thermal resistance, and provision
s h o u l d also be made f o r interzone air c i r c u l a t i o n or extra mass in t h e
building to increase s o l a r
u
tllization and r educe overheating. ( 5 ) Data from carefully d e s i g n e d and controlled experiments, such asthat obtained from t h e NRC p a s s i v e s o l a r t e s t f a c i l i t y , can be used
REFERENCES
1. Barakat, S.A* NRCC Passive Solar T e s t F a c i i t y : Description and D a t a
Reduction,
Building
Research Note 2 1 4 , Division of B u i l d i n g Research, National Research Council Canada, Ottawa,1984.
2. BaZcamb, J.D., D. Barley, R. McFarLand, J . Perry
Jr., W.
Wray andS . N o l l . P a s s i v e Solar D e s i g n Handbook - V o l u m e 11, Passive S o l a r
Design A n a l y s i s , U . S . Department of Energy, DOEiCS -0127i2, Washington,
J a n u a r y 19 80.
3. Rarakat, S.A. Solar H e a t Gains Through Windows in Canada, DBR P a p e r No. 9 4 4 , NRCC 1 8 5 7 4 , Biv5sFon of B u i l d i n g Research, National Research
Council Canada, Ottawa, 1980.
4 . Barakat, S . A . , and B.M. Sander. A S i m p l e Method for k c e r m i n l n g t h e H e a t i n g Requirements of D i r e c t - G a i n P a s s i v e Solar H Q U S ~ S , Building
Research Note 195, Division of B u f l d i n g Research, National Research
Council Canada, Ot tawa, 1982.
5. Rarakat, S . A . , and D.M. Sander. Utilization of Solar Gains Through Windows f o r Heating Houses, Building Research N o t e 1 8 4 , D i v i s i o n of
Building Research, National Research Council Canada, Ottawa,
1982.
6 . Konrad, A m , and B .T. Larsen. ENCORE-CANADA: Computer Program f o r t h eStudy of Energy Consumption of R e s i d e n t i a l Buildings in Canada,
DBR
P a p e r No. 855, MRCC 17663, D i v i s i o n of Building &search, NationalTable 1 T h e r m a l Storage Characteristics of Test U n i t s
South Ther ma1
Test window c a p a c i t y
u n i t area, m 2 (MJ/K) Construct i o n
1 2 . 6 1.53 L i g h t
-
Standard wood-f rame12.7 m m gypsum board f i n i s h on w a l l s and
c e i l i n g s , c a r p e t over wooden floor. 4 -13 Medium
-
As above, but50.8
m gypsumboard f i n i s h on w a l l s and 25.4 mrn on
c e i l i n g
.
3 2 . 6 11.55 Heavy
-
I n t e r i o r wall finish of 101.6 m mb r i c k , 12.7 m m g y p s m board f i n i s h on
rOmt-- m m e m b a
. T q d q * ? m q m <
d o d o d o d o d o
Table 3 S e a s o n a l Performance of Direct-Gain Unf tls f o r 19 81/82
Av
* Max.T o t a l
Solar Useful Over-
o u t d o o r indoor l o s s e s H e a t i n g C o o l i n g gain solar heating
MGR
~ m / U n i t Bays
t e m p . ,'I:
temp., oc k ~ m hk~
4-1kw
41 k~ -h kwh hGLR
~ J K q B FhMode 1 1s 80
ZN
80 2s68
2N
683
S
80 3N 80ELI
17 6 R2 17 6 R3 15 2 R4169
Mode 2l2
96 2 9 0 396
l~outh
room, Unit 1.Table 4 Overall Performance of D i r e c t G a i n U n i t s
MGR
Mode
~ m / ~ n i t
weight1
hl'K qs FhP ~ / F ~ ( L )
No
( 2 )1980/8
1 H e a t i n g season1981192 Heating season
light, M medium and H heavy.
%ata presented are for monitoring p e r i o d common to all u n i t s . 3 ~ o u b l ~ room unfts
.
Table 5 E f f e c t o f I n t e r z o n e A i r C i r c u l a t i o n
Rm/Unit Weight Mode GLR
"23 Fh No(% ) 198018 1 Heating season 0.31 0.77 0.29 0.9 2 0.33 10.85 0.31 0 . 9 4 0 -31 0.95 0.30 0,97 1981182 Weatlng season 0.44 U - 5 5 0.37 10.82 0 . 4 6 0.69 0 . 3 9 0.92 0.42 0.9 0.38 0.95 Table 6 E f f e c t of Window O r i e n t a t i o n Unit Orientation MGR GLR 'ls Fh F ~ / F ~ ( I U
1
- . - - - R 1 S o u t h 0.9 0.54 0.59 0 . 6 8 1 R2 East 1 . 40.33
0.81 0.7 3 1.07 R 3 We sr
1.4 0 , 3 0 0-86 0.74 1.09 R4 North 2.7 0.16 0 -98 0 -84 1.24T a b l e 7 Window N e t E f f e c t i v e Gain for 1980/81 season l
Window loss
Solar
N e t Useful Net EEF. E q u i v a l e n tkW
a h g a i n gain gain galn resistanceR m l T J n i t s R e f . Actual kWah kW oh kW -h kW *h m
2 * ~ / W
Mode 1 1 S 334 2s 3s Mode 2 1 257 2 I" 3 *II Window
U A
= 8 ' 9WIK,
i n c l u d i n g frame Loss.*
Considering south window only of each unit ( a l l N . window gain consideredTable
8 Window Net: E f f e c t i v e G a i n f o r 1981182 s e a s o n 1Window lass S o l a r Net U s e f u l N e t ef f
.
Equivalent kWmh g a i n gain g a i n gafn r e s i s t a n c eh / U n i t Ref. Actual
k W * h
kW*h kW*h kWah m 2 - ~ / ~Mode 1
1s
25 3s R1 R 2 R 3 R 4 Mode 2 12
3 l ~ i n d o wUA
=8.9
W/K,
i n c l u d i n g frame l o s s .2 b n s i d e r i n g s o u t h window o n l y of each unit ( a l l N. window g a i n c o n s i d e r e d useful).
MGR. h l K F I G U R E 1 V A R I A T I O N
OF
S O L A R U T l L F Z A T l O N F A C T O R W I T H T H E R M A L MASS F O R D 1 R E C T - G A IN U N I T S 0 0 9 0 . 1 8 0 . 2 7 0.3 6 0 . 4 5 0 . 5 A G L R : 0.62 4 0 2 4 6 8 10 12 1 4 16 0 , 6 F I G U R E 2 V A R I A T I O N O F P U R C H A S E D H E A T I N G F R A C T I O N W I T H T H E R M A L MASS F O R D I R E C T - G A I N U N I T S30 w 25 W fE 3 20 Q Q= W a 5 W M E A S U R E D 2 1 . 0 ' ~ A V E R A G E + 15 --- P R E D I C T E D 2 1 . 1 3 c A V E R A G E 10 16 17 18 19 20 2 1 22 2 3 2 4 25 26 27 2 8 D A T E , D E C E M B E R 1980 F I G U R E 3 C O M P A R I S O N O F M E A S U R E D AND C A L C U L A T E D ( E N C O R E 1 R O O M T E M P E R A T U R E
-
U N I T 1 S l a 0 0 I 1 1 1 1 1 1 1 1 1 1 1 1 1 ~ ~ 1 1 1 1 1 1 5 u M E A S U R E D 1 6 3 . 2 k w h T O T A L LLt - - - P R E D I C T E D 1 5 5 . 5 k W h T O T A Lz
12110 a D A T E , D E C E M B E R 1980 C O h l P A R l S O N OF M E A S U R E D A N D C A L C U L A T E D I E N C O A E ) A U X I L I A R Y H E A T I N G P O W E R - U N I T 1 5--- P R E D I C T E D 23.3 kWh T O T A L
DATE, D E C E M B E R
1980 F I G U R E 5C O M P A R 1 S O N O F M E A S U R E D A N D C A L C U L A T E D ( E N C O R E 1 A U X I L I A R Y C O O L I N G P O W E R