HAL Id: hal-03039800
https://hal-univ-tlse2.archives-ouvertes.fr/hal-03039800
Submitted on 4 Dec 2020
HAL is a multi-disciplinary open access archive for the deposit and dissemination of sci-entific research documents, whether they are pub-lished or not. The documents may come from teaching and research institutions in France or abroad, or from public or private research centers.
L’archive ouverte pluridisciplinaire HAL, est destinée au dépôt et à la diffusion de documents scientifiques de niveau recherche, publiés ou non, émanant des établissements d’enseignement et de recherche français ou étrangers, des laboratoires publics ou privés.
Genetic-Voronoi algorithm for coverage of IoT data
collection networks
Wajih Abdallah, Sami Mnasri, Thierry Val
To cite this version:
Wajih Abdallah, Sami Mnasri, Thierry Val. Genetic-Voronoi algorithm for coverage of IoT data collection networks. 30th International Conference on Computer Theory and Applications (ICCTA 2020), Arab Academy for Science, Technology & Maritime Transport (AASTMT); Computer Scientific Society (CSS); IEEE Alexandria subsection, Dec 2020, Alexandrie, Egypt. �hal-03039800�
XXX-X-XXXX-XXXX-X/XX/$XX.00 ©20XX IEEE
Genetic-Voronoi algorithm for coverage of IoT data
collection networks
Wajih Abdallah
UT2J, CNRS-IRIT (RMESS), University of Toulouse, Toulouse, France
ISAM Gafsa, Dept. of Design, University of Gafsa ,Tunisia
Sami Mnasri
CNRS-IRIT (RMESS), University of Toulouse, Toulouse, France
University of Tabuk, Community College, Dept. of computer sciences, Tabuk, KSA
Thierry Val
UT2J, CNRS-IRIT (RMESS), University of Toulouse, Toulouse, France
Abstract—IoT data collection networks, formerly known as
wireless sensor networks, have become one of the most active areas of research in the field of information technology. The deployment of connected objects represents a fundamental phase on the establishment of IoT collection networks. The IoT deployment problem consists in positioning all the sensors constituting the network. This paper proposes an approach maximizing the coverage of a region of interest by the hybridization between the Voronoi diagram and the genetic algorithm. The first algorithm divides the field into cells and generates initial solutions (positions of deployed IoT objects). The latter algorithm is used to improve these positions in order to maximize the overall coverage of the region of interest. Obtained results reveal that the performance of the hybrid algorithm exceeds that of the original algorithms in terms of coverage degree, RSSI, lifetime and number of neighbor of objects.
Keywords— Deployment, Voronoi Diagram, Genetic Algorithm, IoT collection networks, coverage, optimization
I. INTRODUCTION
IoT data collection networks typically consist of a large number of multifunctional connected objects characterized by small size, low cost, low power consumption and short distance communications [1].
An IoT object or thing consists of four basic units: a detection unit for collecting the information from its environment, a processing unit for receiving data, a storage unit for temporarily storing data and a communication unit which controls transmissions and receptions of data via a radio communication medium [2].
An IoT object can also include optional units such as energy control unit, mobility unit, tracking unit (GPS, WiFi, BLE), etc. In a data collection network, each object detects the environment around itself then sends the collected data to the base station via hops between objects. In this regard, the coverage of region of interest (RoI) is one of the most relevant data collection network issues.
IoT collection networks are implemented for many applications and use cases in various fields such as environment [3], healthcare [4], military [5], commerce and intelligent homes [6], etc.
The performance of IoT collection networks is very dependent to the thing’s deployment. Following the network application, things are deployed either randomly, or deterministically [7]. Usually, the random deployment is applied under dangerous and unfavorable environmental conditions or in hazardous areas were things may be dispersed from an aircraft or using multi-robot systems [8]. While deterministic deployment is preferred in harmless environments.
Generally, the aim of an IoT network deployment is to maximize the coverage and minimize the number of nodes assigned to a RoI. This type of problems is often categorized as an optimization problem and is known to be NP-hard [9] [10].
Many population-based stochastic optimization algorithms have been designed to solve various optimization problems [11]. Among these algorithms commonly used in the deployment of collection networks : genetic algorithm (GA) [12] [13], harmony search algorithm (HSA) [14], particle swarm optimization (PSO) [15], artificial bee colony (ABC) [16], ant colony optimization (ACO) [17], gravitational search algorithm (GSA) [18], and many others. Different combinations and hybridizations between these algorithms or with other paradigms can be proposed to improve the performance of the deployment.
In this article, we propose an approach that is based on a hybridization between a geometric method of deployment presented by the Voronoi diagram with a genetic algorithm, this hybridization aims to position the nodes in an IoT data collection network and thereafter to maximize the coverage of a RoI with the minimum of the nodes. The VD presents the starting point of our work which will generate the initial population presenting a random deployment of objects. Thus a genetic algorithm will be executed whose goal is to optimize this deployment.
This paper is divided into four sections: section II discusses a set of related work. Section III presents the Voronoi diagram algorithm (VD) and the genetic algorithm (GA). Section IV illustrates a description of the proposed hybrid VD-GA algorithm for the deployment of things in IoT collection networks. Section V compares the performance of the hybrid
algorithm and the original ones. Section VI provides a discussion and a conclusion.
II. RELATED WORKS
So far, despite several methods have been proposed to solve the problem of deploying objects in IoT data collection networks, few studies investigate the deployment of IoT networks using hybrid VD-GA algorithm. In this section, the focus is set on the studies suggesting an hybridization between VD and GA for different applications and contexts, in order to highlight the advantage of our proposed VD-GA algorithm and it contribution in resolving the deployment problem.
In the robotics field, Benavides et al [19] use the VD for the planning of paths of mobile robots : the generating points of the diagram are presented by the obstacles in the environment. Then, a GA finds a collision-free path between the starting point and the end point followed by the robot. However, the findings of this paper rely only on simulations without any experimental tests.
In [20], authors present a VD-GA approach for zoning optimization design problem. This approach uses a multi-objective GA as a first step to set the optimal number of zones for the zoning method. Afterwards, the VD defines the optimal zones. However, the efficiency of the proposed strategy is not assessed for large-scale instances of the problem.
In order to solve the problem of expansion of distribution systems, the study in [21] applied Voronoi polygons to establish the coverage of areas for each system. Then, the GA is used to allocate the final areas which equilibrates the among feeders load. However, the proposed hybridization relies on a simple consecutive execution of the VD then the GA.
In the context of WSN reallocation, the studies [22] combined GA with VD to improve the network lifetime and maximize the coverage in WSN. However, these studies rely basically on the GA which evaluates the solutions using a fitness function. Then determines the next repartition of node. The VD was only used to detect the coverage holes.
There are also hybridizations between PSO and VD aiming to maximize the coverage in WSNs. For example, in [23,24], the authors identify the next positions of the sensor nodes using PSO then VD detect the coverage holes.However, the quality of the coverage solutions proposed by the PSO cannot be evaluated since known optimization metrics such as IGD and Hypervolume are not involved in the measures.
Other studies [25, 26, 27] use the ACO algorithm simultaneously with a Voronoi-based process to ensure the optimization of the route planning in order to determine the shortest path between the nodes of a WSN.
In [28], authors suggest a comparison between two optimization algorithms resolving the coverage and localization problem in IoT collection networks. They assess the behavior of MOEA/D and NSGA-III with two and three objectives using simulation tests.
In [29,30], the authors used Voronoi cells to detect the coverage holes and to determine all possible paths in a
network. Then they used an optimization algorithm called ACO to deploy the nodes.
In general, ACO is typically used to identify the shortest path, while the GA manages the generation of new candidate solutions (locations) in order to effectively modifying the node distribution and adding additional needed mobile nodes.
III. OVERVIEW OF VORONOI DIAGRAM AND GENETIC
ALGORITHM A. Voronoi Diagram
In the field of vision and computational geometry, VD is one of the main structures which are frequently used in visibility graphs. Moreover, VD are used in the networking to find optimal paths without collision. It is also used for the construction of trajectories and maps [31].
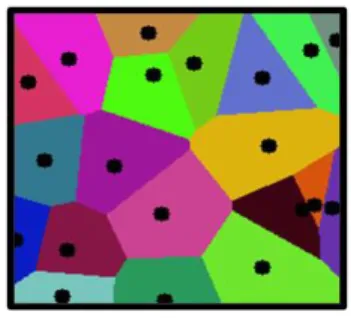
S be a finite set of n points on the plan. As shown in Fig.1, a Voronoi region or Voronoi cell associated with an element p of S, is the set of points from S which are the closest to p.
Knowing that designates the distance between
x et p.
In the context of deploying nodes in data collection networks, most of Voronoi-based approaches aim to maximize the coverage through the detection of coverage holes [32, 33].
Fig. 1. The Voronoi diagram cells
B. Genetic algorithm
The GA is an evolutionary meta-heuristic algorithm. It is a search technique used mainly for random optimization where it finds, among the available solutions, a set of optimal solutions belonging to the PF (Pareto Front) [34, 35].
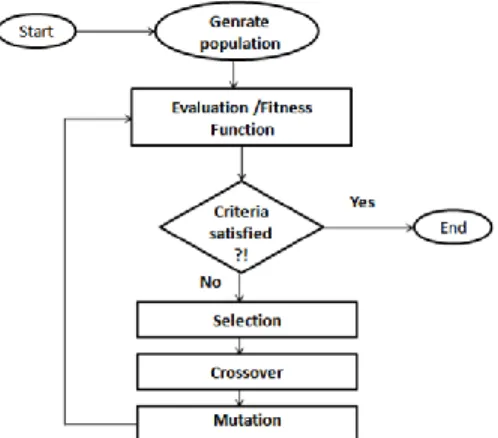
The GA process begins with a set of individuals composing a set of randomly generated possible solutions called population. Each solution is represented by a string or an array of genes. A fitness function is assigned for each individual. The higher the fitness value, the closer the solution is to the optimal set of solutions (PF). After selecting two solutions (called parents), a crossing phase is applied to produce two new solutions (called children). Then, the phase of mutation is performed on randomly chosen chromosomes to ensure the diversity of the population of solutions. This genetic process is repeated until a stopping condition is satisfied. These steps are described in Fig. 2
In this study, the standard GA is applied with some appropriate modifications explained in the next section.
Fig. 2. Flowchart of the standard GA steps
IV. PROPOSED ALGORITHM
In this section, the used hybrid algorithm is explained and justified. It is assumed that all IoT objects used in the RoI, are of the same type, sensing and transmitting radius. As a first step, the proposed VD-GA algorithm use the Voronoi process to divide the RoI into a set of cells and subsequently generates a set of solutions presenting a first deployment repartition of objects. Afterwards, relying on the VD solutions, the GA iteratively improves the coverage degree.
A. Proposed Voronoi Diagram
In most of the works discussed in section II, the VD is used to detect coverage holes after the deployment. In contrary, our hybrid VD-GA uses the VD first to subdivide the RoI into cells. Each cell has a single IoT object. Each Voronoi vertex is located exactly at the center of the polygon of the cell. This vertex is defined by the generating points of the cells representing the coordinates of an object. As shown in Fig. 3, each deployed object is situated in a Voronoi cell.
Subsequently, the VD allows generating a number of solutions. Each solution contains the positions of N objects deployed in the RoI. The number of solutions indicates the number of VD iterations which can be set at the start of the VD process.
Fig. 3. Repartition of things on the VD cells after the deployment
In order to ensure a maximum coverage of the RoI with less overlap between sensing and transmitting radius of objects, as shown in Fig. 4, we overwritten the Voronoi solutions which contains more than two overlapping objects. This simplifies
improving the positioning by the GA.
Fig. 4. Representation of the initial population of the VD
B. Proposed Genetic Algorithm a) Chromosomes coding
In order to ensure a maximum coverage of the RoI with less overlap, the Voronoi solutions which contain more than two node overlaps, are overwritten as shown in Fig. 4. This simplifies the GA process of improvement of positioning. The representation of the chromosomes determining the solutions in the GA is illustrated in Fig. 5.
Object 1 Object 2 …... Object n x 108 99 75 134 … … 12 y 173 149 110 77 … … 88 Fig. 5. Representation of a chromosome in the GA
b) Initial Population
The process of the GA begins with the initial population which presents the set of all the individuals used to find the global solution. In our hybrid VD-GA, the result given by the VD is the initial population of the GA: if the population is composed of M individual as shown in the example in Fig. 6, M Voronoi output solutions constitute the M input GA individuals. 108 173 15 95 143 65 99 149 58 101 68 44 75 110 33 192 … … … 128 80 … … … … 12 88 186 69 182 77 Individual 1 Individual 2 Individual M
Fig. 6. Representation of the GA initial population
c) Fitness Function
The aim of our approach is to determine the best solutions that guarantee the maximum coverage of the RoI. The fitness function is generally used in the GA to evaluate and identify the best solutions.
Knowing that S is the RoI and n is the number of deployed objects. The more the difference between S and the sum of all the areas of the objects decreases, the more the coverage increases.
If there is no overlap between two objects, their distance is equal to or greater than 2r as illustrated in Fig.7(b): X = 2r - distance (p1, p2).
Fig. 7. Objects overlap
If there is an overlap between two objects as shown in Fig.8, the distance between them is less than 2R. The surface of the lens L (intersection space between the two objects) is twice that of the segment.
Knowing that d is the distance between the centers of the two objects, h = d/2.
Object 1 Object 2
Fig. 8. Computation of the area of overlapping objects
d) Selection
To produce new generations after the phase of initiation of the population, we applied a tournament selection mechanism in order to select individuals. The goal of this phase is to select the most suitable individuals to use their genes on the next generation.
e) Recombination
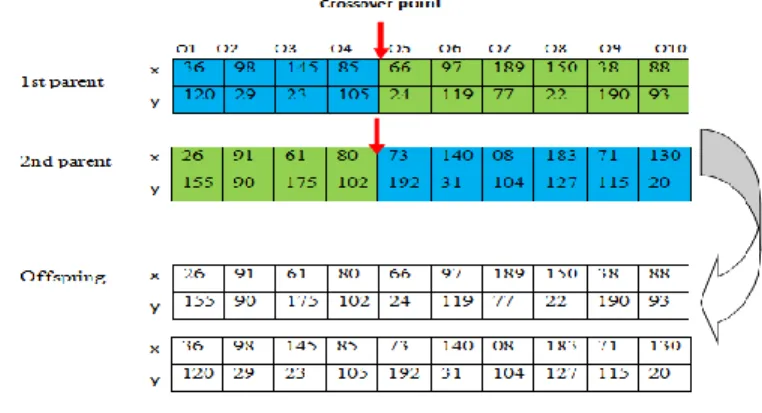
Using two parents selected from the population, we applied a recombination at a random point to produce a new individual. A crossing operation on 10 individuals is shown in Fig. 9: The second parent exchanges the first gene segment with the first parent. All the individuals in the population have a certain probability to be recognized as parents. A roulette process is
used to select the second parent in the population to apply the crossing phase.
Fig. 9. One-point crossover
C. Mutation
A new population is formed by N individuals after performing the selection and crossing operators. Subsequently, each individual will participate in a mutation at a point. Usually, the location of the mutant gene that will be replaced by a different value is chosen at random. The mutation operator is shown in Fig. 10 with the same example of 10 nodes.
Fig. 10. One-point mutation operator
As termination criterion for the GA, the maximum number of iterations is set to 450.
V. EXPERIMENTALRESULTS
To evaluate the proposed VD-GA algorithm, OMNeTpp is used for simulations. First, we applied the VD on a RoI of 100*100 meters and IoT objects with a detection range of 10 meters. Table 1 shows the used simulation parameters. The choice of the values of the parameters relies on empirical tests and on our previous studies explained in [28].
TABLE I. SIMULATION PARAMETERS
Parameter Value
Number of deployed objects 40 Number of iterations [20..450] Population size: Number of individuals 100 Probability of mutation 0,1 Probability of crossover 0,8
The VD divides the region into a set of Voronoi cells and subsequently generates a number of solutions which present the positions of each IoT object in a 2D plane as shown in Fig.11. The solutions given by the VD represent the initial population of the GA. The GA is used to optimize the solutions found by the VD by replacing the nodes in order to find the
d O O’ d/2 d/2 ((a) ) ((b) )
best positioning for them in the RoI and subsequently having the maximum degree of coverage.
Fig. 11 and Fig. 12 show the difference, in terms of coverage degree, between the initial random coverage generated only by the Voronoi diagram and the coverage degree provided by the proposed VD-GA.
Fig. 11. Initial random deployment using VD
Fig. 12. Deployment after executing VD-GA
Fig. 13 shows an average coverage rate of 25 runs of the GA, as a function of the number of iterations of the GA.
Fig. 13. Comparing the coverage degree according to the Number of iterations for VD, GA and VD-GA
Fig. 13 shows that the coverage degree is enhanced when the number of GA iterations increases. Moreover, Fig. 13 demonstrates that the GA is better than the VD for a number of iterations of GA less than 100, while the GA gives a better coverage degree for more than 100 iterations. The hybrid algorithm (VD-GA) is better than VD and GA for a number of iterations of GA exceeding 56.
Table II presents the Hypervolume values (best, average and worst) of a 25 execution of the GA, for different number of objectives and different number of iterations.
TABLE II. BEST, AVERAGE AND WORST VALUES OF HYPERVOLUME OF THE GENETIC ALGORITHM
ObjNbr Max nbr of iterations GA
1 100 0.9393 0.9264 0.9031 400 0.9495 0.9422 0.9247 2 100 0.9383 0.9296 0.8835 400 0.9438 0.9399 0.8934
Table II shows that when considering one objective (the coverage degree) instead of two objectives (coverage degree and cost of deployment), the GA gives higher (better) values of Hypervolume. Moreover, augmenting the number of iterations, allows the GA to obtain better results (higher values of the Hypervolume).
Table III compares the behavior of the tested algorithms regarding the RSSI values, the lifetime and the average number of neighbors for all nodes. Indeed, the RSSI gives an idea about the quality of the transmitted signal, then it indicates the quality of coverage. The lifetime is defined by the time (in seconds) at the end of which the first node shuts off. Regarding the number of neighbors of each node, a node i is considered as neighbor of another node j if the average RSSI between i and j is greater than a threshold (set to 100 in our tests) and the maximum FER rate between the two nodes does not exceeds another threshold (set to 0,1 in our tests).
TABLE III. COMPARING THE AVERAGE VALUES OF RSSI, LIFETIME AND NUMBER OF NEIGHBORS
VD GA VD+GA RSSI 132.39 131.83 137.28 Lifetime (in seconds) 1298 1367 1693 Number of neighbors 4.23 4.65 5.98
Table III indicates that the proposed hybrid algorithm is better than GA alone and the VD alone, in the RSSI, the lifetime and the average number of neighbors. An interesting observation is that despite the better performance of the GA compared to the VD regarding the lifetime and the number of neighbors, the latter algorithm gives better results than the GA regarding the RSSI values.
VI. CONCLUSION
In this paper, the problem of deployment in IoT data collection networks is investigated while maximizing the coverage degree of the RoI. A hybridization between the VD and the GA is suggested. VD randomly generated the positions of the IoT objects. These positions presented the initial population of the GA. The latter algorithm is used to determine the best positions of objects. Compared to the standard original GA and the VD, the hybrid algorithm showed an improvement of the deployment solution. As a future direction of this study, we aim to propose other hybridizations between geometric
Number of iterations of GA Coverage degree
deployment methods other than VD (such as Virtual Forces) and optimization algorithms other than GA (such as PSO and ACO). Besides, the aim is to assess the behavior of the proposed VD-GA on an experimental environment by prototyping on a real testbed using CStick nodes equipped with ESP32 CPU.
REFERENCES
[1] I.F. Akyildiz, W. Su, Y. Sankarasubramaniam,and E. Cayirci, “Wireless sensor networks: a survey,” Computer Networks 38 (2002) 393–422. [2] I.F. Akyildiz, W. Su, Y. Sankarasubramaniam, “A survey on sensor
networks,” IEEE Communications magazine, 2002, vol. 40, no 8, p. 102-114.
[3] D. Chen, Z. Liu, L. Wang, M. Dou, J. Chen, and H. Li, “Natural disaster monitoring with wireless sensor networks: a case study of data-intensive applications upon low-cost scalable systems,” Mobile Networks and Applications, 2013, vol. 18, no 5, p. 651-663.
[4] Y.J. Chang, C.H. Chen, L.F. Lin, R.P. Han, W.T. Huang, and G.C. Lee, “Wireless sensor networks for vital signs monitoring: Application in a nursing home,” International Journal of Distributed Sensor Networks, 2012, vol. 8, no 11, p. 685107.
[5] E. Felemban, “Advanced border intrusion detection and surveillance using wireless sensor network technology,” 2013
[6] W. Huiyong, W. Jingyang, and Min, H. “Building a smart home system with WSN and service robot,” In : 2013 Fifth International Conference on Measuring Technology and Mechatronics Automation. IEEE, 2013. p. 353-356.
[7] M. Shizuka, and M. Aida, “Performance study of node placement in sensor networks,” In : 24th International Conference on Distributed Computing Systems Workshops, 2004. Proceedings. IEEE, 2004. p. 598-603.
[8] F. Nematy, A. M. Rahmani, M. Teshnelab, and N. Rahmani, “Ant colony based node deployment and search in wireless sensor networks,” In : 2010 International Conference on Computational Intelligence and Communication Networks. IEEE, 2010. p. 363-366.
[9] B.H Liu and K.W Su, “Enhanced algorithms for deploying the minimum sensors to construct a wireless sensor network having full coverage of critical square grids,” Wireless networks, 2014, vol. 20, no 2, p. 331-343.
[10] S. Mnasri, K. Zidi, and K. Ghedira, “A heuristic approach based on the multi-agents negotiation for the resolution of the DDBAP,” 4th International Conference on Metaheuristics and Nature Inspired Computing (META 2012), Sousse - Tunisia, 2012.
[11] Y. Yoon and Y.H. Kim, “An efficient genetic algorithm for maximum coverage deployment in wireless sensor networks,” IEEE Transactions on Cybernetics, 2013, vol. 43, no 5, p. 1473-1483.
[12] S. Mnasri, K. Zidi, and K. Ghedira, “A multi-objective hybrid BCRC-NSGAII algorithm to resolve the VRPTW,” 13th International Conference on Hybrid Intelligent Systems, Gammarth, 2013, pp. 60-65, doi: 10.1109/HIS.2013.6920455.
[13] J.H. Holland, Adaptation in natural and artificial systems: an introductory analysis with applications to biology, control, and artificial intelligence. MIT press, 1992.
[14] M. El-Abd, “An improved global-best harmony search algorithm,” Applied Mathematics and Computation, 2013, vol. 222, p. 94-106. [15] J. Kennedy and R. Eberhart, “Particle swarm optimization,” In :
Proceedings of ICNN'95-International Conference on Neural Networks. IEEE, 1995. p. 1942-1948.
[16] D. Karaboga, An idea based on honey bee swarm for numerical optimization. Technical report-tr06, Erciyes university, engineering faculty, computer engineering department, 2005.
[17] M. Dorigo, V. Maniezzo, and A. Colorni, “Ant system: optimization by a colony of cooperating agents,” IEEE Transactions on Systems, Man, and Cybernetics, Part B (Cybernetics), 1996, vol. 26, no 1, p. 29-41.
[18] RASHEDI, Esmat, NEZAMABADI-POUR, Hossein, et SARYAZDI, Saeid. GSA: a gravitational search algorithm. Information sciences, 2009, vol. 179, no 13, p. 2232-2248.
[19] F. Benavides, G. Tejera, M. Pedemonte, and S. Casella, “Real path planning based on genetic algorithm and Voronoi diagrams,” In : IX Latin American Robotics Symposium and IEEE Colombian Conference on Automatic Control, 2011 IEEE. IEEE, 2011. p. 1-6
[20] G. Pirlo, and D. Impedovo, “Voronoi-based zoning design by multi-objective genetic optimization,” In : 2012 10th IAPR International Workshop on Document Analysis Systems. IEEE, 2012. p. 220-224 [21] G.A. Jimenez-Estevez, L. Vargas, and L. Palma-Behnke, “Genetic
Algorithms and Voronoi Polygons applied to decision making in the Distribution Systems expansion problem,” In : 2008 IEEE/PES Transmission and Distribution Conference and Exposition: Latin America. IEEE, 2008. p. 1-7
[22] J. Zou, S. Gundry, J. Kusyk, C.S. Sahin, and M.U. Uyar, “ Bio-inspired and Voronoi-based Algorithms for Self-positioning of Autonomous Vehicles in Noisy Environments,” In Proceedings of the 8th International Conference on Bioinspired Information and Communications Technologies; ICST (Institute for Computer Sciences,Social-Informatics and Telecommunications Engineering): Brussels, Belgium, 2014; pp. 17–22
[23] M. Kumar, V. Gupta, “Benefits of using particle swarm optimization and Voronoi diagram for coverage in wireless sensor networks,” In Proceedings of the 2017 International Conference on Emerging Trends in Computing and Communication Technologies (ICETCCT), Dehradun, India, 17–18 November 2017; pp. 1–7.
[24] Y. Qu and S.V Georgakopoulos, “A centralized algorithm for prolonging the lifetime of wireless sensor networks using Particle Swarm Optimization,” In Proceedings of the WAMICON 2012 IEEE Wireless Microwave Technology Conference, Cocoa Beach, FL, USA, 15–17 April 2012; pp. 1–6.
[25] P. Marbateand P. Jaini, “Role of Voronoi Diagram Approach in Path Planning,” Int. J. Eng. Sci. Technol. (IJEST) 2013, 5, 527.
[26] Y. Li, T. Dong, M. Bikdash, and Y.D. Song, “Path Planning for Unmanned Vehicles Using Ant Colony Optimization on a Dynamic Voronoi Diagra,” In Proceedings of the 2005 International Conference on Artificial Intelligence, ICAI 2005, Las Vegas, USA, June 2005; pp. 716–721.
[27] C. Blum, “ Ant colony optimization,” Introduction and recent trends. Phys. Life Rev. 2005, 2, 353–373.
[28] S.Mnasri, A.Van den Bossche, N. Nasri, and T.Val “The 3D Deployment Multi-objective Problem in Mobile WSN: Optimizing Coverage and Localization”. International Research Journal of Innovative Engineering - IRJIE, 2015. 1 (5). ISSN 2395-0560
[29] K.Eledlebi, H. Hildmann, D. Ruta, and A.F Isakovic, “A hybrid Voronoi Tessellation/Genetic Algorithm Approach for the Deployment of Drone-Based Nodes of a Self-Organizing Wireless Sensor Network (WSN)” in Unknown And GPS Denied Environments. Drones, 2020. 4(3), 33. [30] T.S. Panag, and J.S. Dhillon, “Maximal coverage hybrid search
algorithm for deployment in wireless sensor networks” in Wireless Networks, 2019.25(2), 637-652.
[31] N. A. Ab. Aziz, K. Ab. Aziz, W. Z. W Ismail, “Coverage Strategies for Wireless Sensor Networks,” World Academy of Science, Engineering and Technology ,2009.
[32] A. Pietrabissa, F. Liberati, and G. Oddi, “A distributed algorithm for Ad-hoc network partitioning based on Voronoi Tessellation,” Ad Hoc Networks 2016, 46, 37–47
[33] M. Abo-Zahhad, N. Sabor, S. Sasaki, and S.M Ahmed, “ A centralized immune-Voronoi deployment algorithm for coverage maximization and energy conservation in mobile wireless sensor networks,” Inf. Fusion 2016, 30, 36–51.
[34] C. Gazen and C. Ersoy, “Genetic algorithms for designing multihop lightwave network topologies,” Artificial Intelligence in Engineering 13 (1999) 211–221.
[35] D.E. Goldberg, Genetic Algorithms in Search, Optimization, and Machine Learning, Addison Wesley, Reading, MA, 1989